1525
Vertical Dynamic Pressure: a promising biomarker for describing inflammation in intracranial aneurysm1Center for Biomedical Imaging Research, Tsinghua University, Beijing, China, 2Beijing Neurosurgical Institute, Capital Medical University, Beijing, China, 3Tiantan Hospital, Beijing, China
Synopsis
Keywords: Data Processing, Velocity & Flow, Intracranial Aneurysm
Increasing histopathological evidence suggested that the inflammation processes and hemodynamics in vessel wall may mediate the growth and rupture of IA. For hemodynamics, previous studies reported that lower wall shear stress (WSS) is the most highlighted parameter associated with inflammation. Some studies also explored the dynamic pressure distribution at the sites of aneurysms based on computational fluid dynamics. Vertical dynamic pressure(VDP) can be seen as a possible measure for the force of the fluid impinging on the vessel wall. In this study, we propose to investigate the correlation of two hemodynamic parameters(WSS, VDP) with inflammation by advanced MRI techniques.INTRODUCTION
The prevalence of intracranial aneurysms (IA) is estimated to be 3%-5% worldwide[1]. The rupture of IAs can be a catastrophic event and leading to intracranial subarachnoid hemorrhage, which has a mortality rate of up to 50%[2]. Increasing histopathological evidence suggested that the inflammation processes and hemodynamics on vessel wall may mediate the growth and rupture of IA[3]. CRstalk(aneurysm-to-pituitary stalk ratio) has been indicated as a marker of inflammatory changes of IA wall in several studies[4]. As for hemodynamic parameters lower wall shear stress (WSS) has been reported to be the most highlighted parameter associated with inflammatio[5] and have a weak negative correlation with CRstalk[6]. Moreover, based on computational fluid dynamics (CFD), the dynamic pressure distribution at the sites of aneurysms has been also explored in some studies[7]. Vertical dynamic pressure(VDP) can be proposed as a possible measurement for the force of the fluid impinging on the vessel wall. However, further study is needed to clarify if the change in dynamic pressure could elicit any inflammatory response. In this study, the associations of two hemodynamic parameters (WSS, VDP) with CRstalk were investigated by advanced MRI techniques in the perspective of 3D measurement to figure out a more remarkable biomarker associated with inflammation.METHODS
Patient inclusion criteriaStudy participants were recruited from Tiantan Hospital (Beijing, China) and selected from patients with unruptured IA, which were diagnosed using magnetic resonance angiography, computed tomography angiography, or digital subtraction angiography. The exclusion criteria were: 1) patients with poor image quality, 2) patients with fusiform, dissecting, or thrombosed aneurysms, and 3) patients who had irregular aneurysms. A total of 36 patients with 38 IAs were included.
MRI acquisition
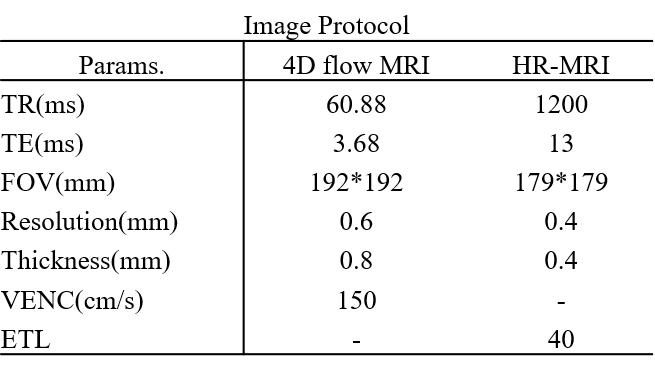
In this study, four-dimensional flow MRI (4D flow MRI) was performed to make a comprehensive assessment of real IA hemodynamics. High-resolution vessel wall magnetic resonance imaging (HR-MRI) was imaged to assess the aneurysmal wall inflammation. Post-contrast HR-MRI was performed 15 minutes after injection of a gadolinium-based contrast agent (Omniscan TM; GE Healthcare, Chicago, IL, USA) into an antecubital vein (0.1 mmol/kg dose at 5 mL/s). All scans were performed on 7T Siemens Skyra. The image protocol settings and patient demographic data are shown in Table 1.
Statistical analysis
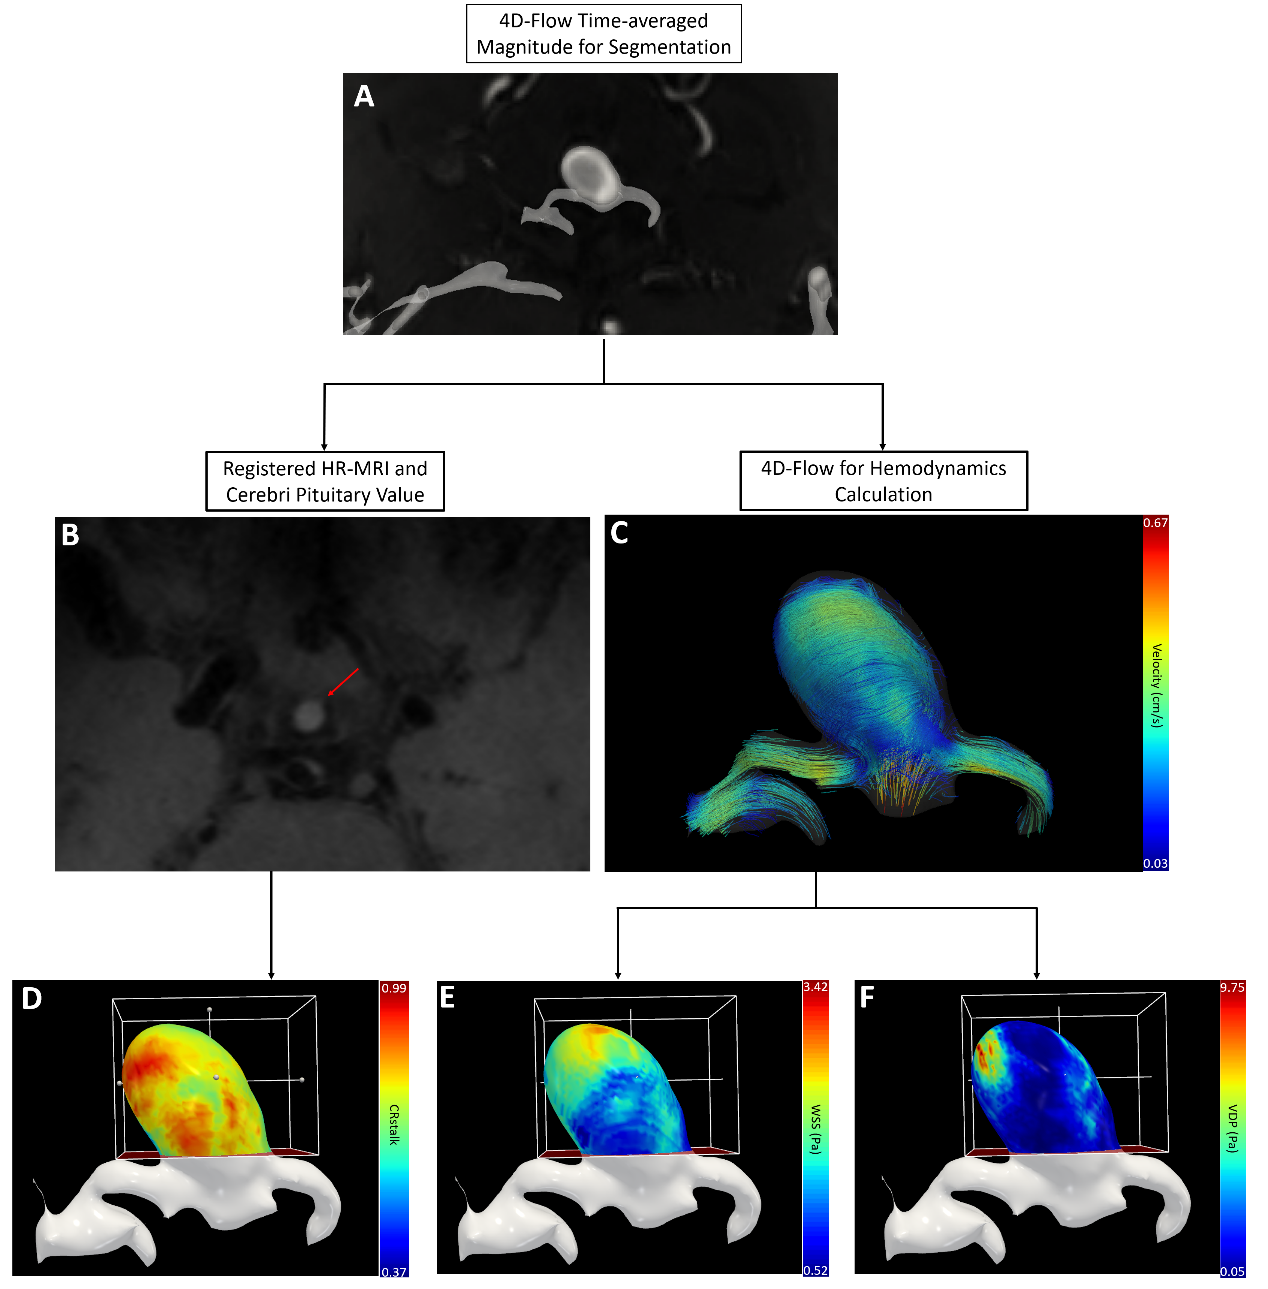
In order to explore the association between CRstalk and hemodynamic parameters, a workflow reported by Fu. et al [8]was used to obtain quantified values,which is shown in Figure 1. The 3D model of aneurysm was generated by threshold segmentation of time-averaged 4D flow magnitude. The registered post-contrast HR-MRI was used to obtain the spatial distribution of CRstalk and 3D velocity filed calculated from 4D flow MRI was used for calculating hemodynamic parameters. Finally, all parameters are generated and mapped on 3D surface of IA, as shown in Figure 1(D-F). WSS is the friction force of the blood flow against the blood vessel wall and was calculated by following formula, where μ means the dynamic viscosity and y means the distance to the wall:
$$WSS=μ(\frac{\partial v_{parallel}}{\partial y})_{y=0}$$
VDP is the kinetic energy of the flowing blood acting vertically on the wall of IA. Let ρdonates density of blood. By mapping the 3D velocity field on IA patterns, the VDP was obtained by following equation:
$$VDP=\frac{1}{2}\rho v^2_{vertical}$$
The time-averaged WSS and VDP were calculated using the average of obtained value at all timepoints during a cardiac cycle. CRstalk was calculated as the quotient of aneurysm wall signal intensity and pituitary stalk signal intensity on post-contrast HR-MRI. Statistical analyses were conducted using Scipy.stats version 1.6.2. Correlation was examined using Spearman’s method and P <0.05 was considered significant.
RESULTS
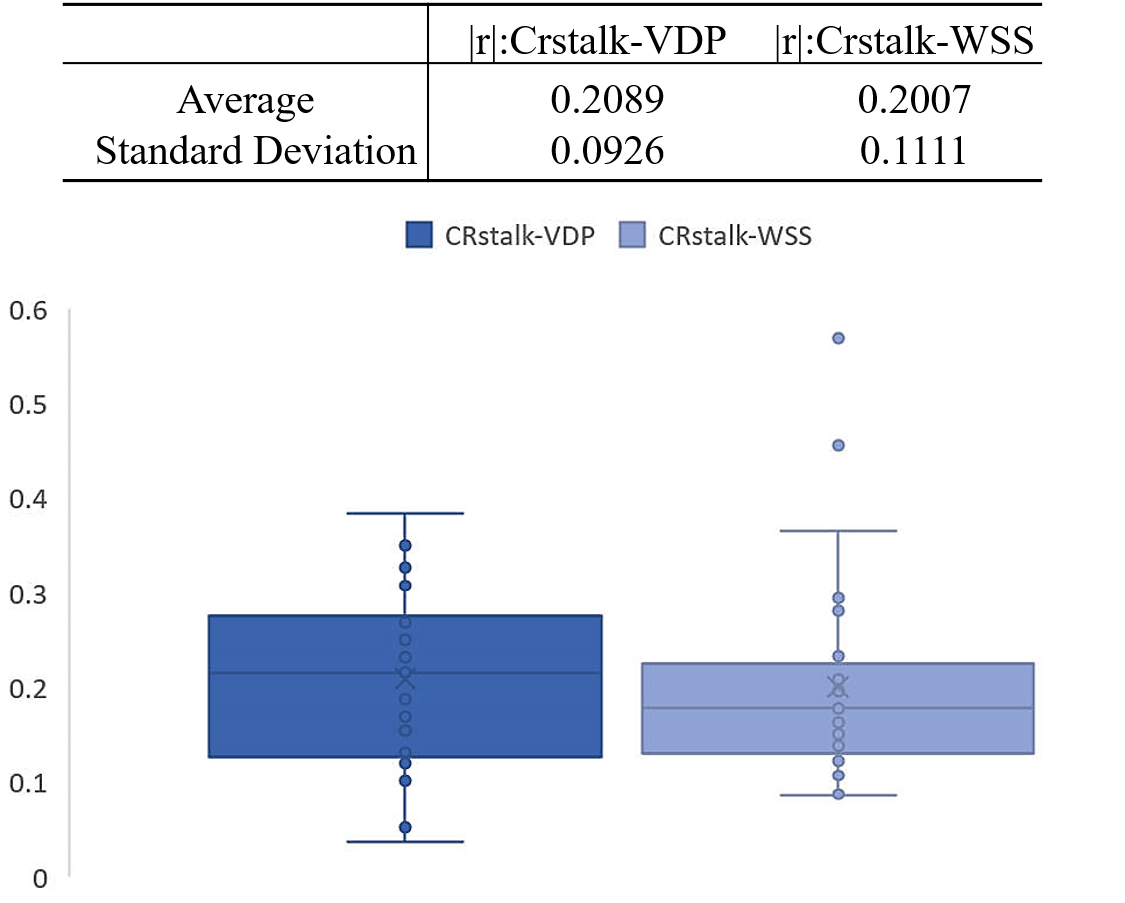
Finally, 29 IAs in 29 patients were included for statistic analysis. In order to investigate the strength of correlation between two hemodynamic parameters, we take the absolute value of the significant data and make statistical analyses. The characteristics of correlation coefficient’s distribution are shown in Figure 2. As shown in the results, the absolute value of correlation between CRstalk and VDP(|r|: CRstalk-VDP) has higher mean value than the value between CRstalk and WSS(|r|: CRstalk-WSS). The boxplot shows that the correlation degree of CRstalk-VDP is more stable. It seems VDP is a more promising biomarker for describing inflammation in IA.DISCUSSION and CONCLUSION
Previous studies about dynamic pressure in IAs were assessed by CFD[7] and it is needed to investigate the associations between inflammation and hemodynamics with advanced imaging techniques. 4D-flow MRI and HR-MRI provides a feasible method to explore the inflammatory and actual flow velocity in IAs. In this study, we investigated the relationship between CRstalk and hemodynamic parameters, in which VDP was measured for the first time using 4d flow MRI. Our findings showed that VDP had higher and more stable correlation with CRstalk. However, the relatively small number of IAs is still limited to demonstrate the reliability of VDP. The future work included a larger group of aneurysm patients will be performed to validate the validity and reliability of the VDP.Acknowledgements
No acknowledgement found.References
[1] Vlak MH, Algra A, Brandenburg R, et al. Prevalence of unruptured intracranial aneurysms,with emphasis on sex, age, comorbidity, country, and time period: a systematic review and metaanalysis. Lancet Neurol. 2011; 10: 626–636.
[2] Nieuwkamp DJ, Setz LE, Algra A, et al. Changes in case fatality of aneurysmal subarachnoid haemorrhage over time, according to age, sex, and region: a meta-analysis. Lancet Neurol. 2009;8:635-42.
[3] Turjman AS, Turjman F and Edelman ER. Role of fluid dynamics and inflammation inintracranial aneurysm formation. Circulation. 2014; 129: 373–382.
[4] XiaoBing Wu, JingLian Zhong, ShengWen Wang, et al. Circumferential wall enhancement with contrast ratio measurement in unruptured intracranial aneurysm for aneurysm instability. Brain and Behavio. 2022; 12:5.
[5] Signorelli F, Sela S, Gesualdo L, et al. Hemodynamic Stress, Inflammation, and IntracranialAneurysm Development and Rupture: A Systematic Review. World Neurosurg. 2018;115:234-44.
[6] Sricharan SV, Hamidreza RO, Nándor K, et al. Aneurysm risk metrics and hemodynamics are associated with greater vessel wall enhancement in intracranial aneurysms. Royal Society Open Science. 2021; 8:211119
[7] C. Karmonik, A. Mantha, C. M. Strother, et al, Dynamic pressure at sites of virtually removed paraclinoid aneurysms: a computational fluid dynamics study. Proc. SPIE 6143, Medical Imaging 2006: Physiology, Function, and Structure from Medical Images, 61430L (13 March 2006).
[8] Fu M, Peng F, Zhang M, et al. Aneurysmal wall enhancement and hemodynamics: pixel-level correlation between spatial distribution. Quant Imaging Med Surg 2022.
Figures