1524
Association Between Epicardial Adipose Tissue volume and Microvascular Obstruction with ST-segment elevation myocardial infarction Patients1Department of Radiology, Affiliated Nanjing Drum Tower Hospital of Nanjing University Medical School, nanjing, China, 2Philips Healthcare, Shanghai, China
Synopsis
Keywords: Atherosclerosis, Cardiovascular
Epicardial adipose tissue (EAT) is a novel factor for risk stratification of coronary artery disease. EAT in microvascular obstruction formation in patients with ST-segment elevation myocardial infarction (STEMI) remain unclear. This study aimed to evaluate the correlation between EAT and MVO volume detected by CMR on a clinical 1.5T CMR system with a 28-channel coil array in STEMI patients.Synopsis
Epicardial adipose tissue (EAT) is a novel factor for risk stratification of coronary artery disease. EAT in microvascular obstruction formation in patients with ST-segment elevation myocardial infarction (STEMI) remain unclear. This study aimed to evaluate the correlation between EAT and MVO volume detected by CMR on a clinical 1.5T CMR system with a 28-channel coil array in STEMI patients.Introduction
Epicardial adipose tissue (EAT), a metabolically active fat depot between the visceral pericardium and the outer margin of the myocardium, has gradually emerged as a novel target for risk stratification of coronary artery disease due to its distinctive location and multifaceted metabolic properties. Microvascular obstruction (MVO) after primary percutaneous coronary intervention (pPCI) is identified as an independent risk factor for poor prognosis in patients with acute myocardial infarction (AMI). However, the clinical implications of EAT in microvascular obstruction formation in patients with ST-segment elevation myocardial infarction (STEMI) remain unclear. Recently, cardiac magnetic resonance (CMR) has emerged as the gold standard technique to detect the extent of MVO and evaluate EAT volume. This study aimed to evaluate the correlation between EAT and MVO volume detected by CMR in STEMI patients.Methods
A total of 129 STEMI patients who underwent pPCI successfully were enrolled between February 1, 2022 to August1, 2022. Clinical characteristics, including demographic characteristics, cardiovascular risk factors, laboratory data, and angiographic parameters, were recorded from each patient by 1 trained physician. All patients underwent CMR on a clinical 3.0T MR system (Ingenia CX, Philips Healthcare, Best, The Netherlands) with a 28-channel body phase array coil within 1 week following pPCI. PSIR-LGE and black-blood T2WI in three different views were used to evaluate infarct size, MVO volume, and EAT distribution. All CMR data were analyzed using Q-MASS MR 8.1 imaging system (Medis, Leiden, The Netherlands) and interpreted twice by 2 expert radiologists who were blinded to the angiographic and clinical data of patients.Results
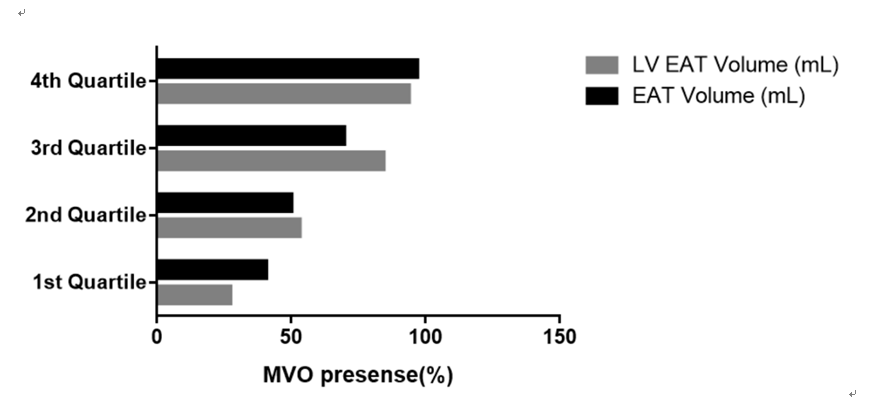
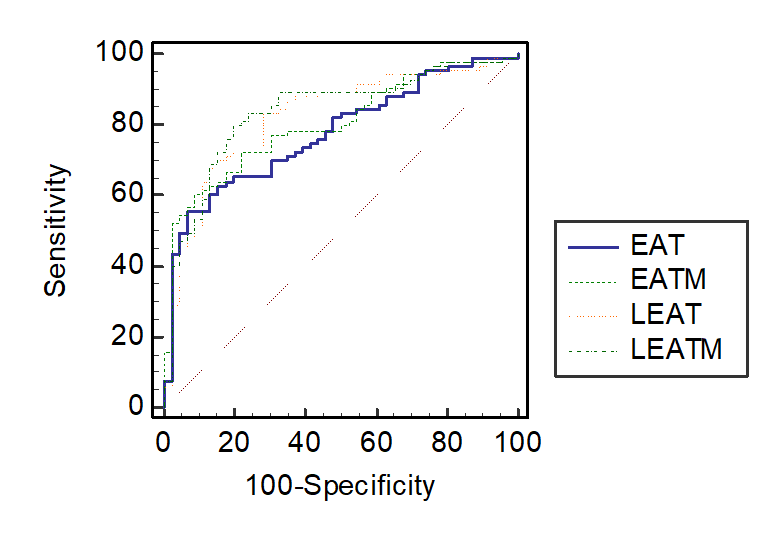
Compared to STEMI patients without MVO, STEMI patients with MVO presented with higher peak troponin-T levels, an increase in neutrophil-lymphocyte ratio (NLR) and C-reactive protein (CRP), larger infarct size, and compromised left ventricular ejection fraction (LVEF%). Total EAT volume, EAT mass index, left atrioventricular EAT volume, left atrioventricular EAT mass index, and thickness of EAT in the left atrioventricular groove were unanimously associated with the occurrence of MVO. The left atrioventricular EAT mass index in STEMI patients with MVO was significantly larger than that in STEMI patients without MVO (24.72±5.049 g/m2 vs. 18.63±3.670 g/m2, P<0.001). Multivariate logistic regression analysis demonstrated that NLR, peak troponin T levels, and left atrioventricular EAT mass index were independent predictors of MVO. Left ventricular EAT mass significantly predicted the presence of MVO (area under the curve [AUC]: 0.83 [95% CI: 0.760 to 0.895; P<0.001).Discussion & Conclusions
The left atrioventricular EAT mass index is an independent predictor of MVO. Measurement of EAT using CMR could be used for risk stratification and may be a promising target in developing new therapies to reduce myocardial reperfusion injury in patients with STEMI. A quick identification of a high EAT mass index could define a subset of patients in which potential therapeutic strategies, such as GLP-1 or targeted therapy against EAT, could be developed to alleviate myocardial damage.Acknowledgements
NoneReferences
1.Han D, Liu J, Sun Z, Cui Y, He Y, Yang Z. Deep learning analysis in coronary computed tomographic angiography imaging for the assessment of patients with coronary artery stenosis. Comput Methods Programs Biomed. 2020;196:105651. 22. Falk T, Mai D, Bensch R, Cicek O, Abdulkadir A, Marrakchi Y, et al. U-Net: deep learning for cell counting, detection, and morphometry. Nat Methods. 2019;16(1):67-70. 2. Zhang C-J, Xia D, Zheng C, Wei J, Cui Y, Qu Y, et al. Automatic Identification of Coronary Arteries in Coronary Computed Tomographic Angiography. IEEE Access. 2020;8:65566-72.
3. Raff GL, Abidov A, Achenbach S, Berman DS, Boxt LM, Budoff MJ, et al. SCCT guidelines for the interpretation and reporting of coronary computed tomographic angiography. Journal of cardiovascular computed tomography. 2009;3(2):122-36. 2
4.Raff GL, Chinnaiyan KM, Cury RC, Garcia MT, Hecht HS, Hollander JE, et al. SCCT guidelines on the use of coronary computed tomographic angiography for patients presenting with acute chest pain to the emergency department: a report of the Society of Cardiovascular Computed Tomography Guidelines Committee. Journal of cardiovascular computed tomography. 2014;8(4):254-71.
Figures