1516
Contrast-to-noise ratio of carotid artery perivascular adipose tissue on MRI: A potential indicator for carotid vulnerable plaque1Center for Biomedical Imaging Research, Tsinghua University, Beijing, China, 2Peking University Third Hospital, Beijing, China
Synopsis
Keywords: Atherosclerosis, Inflammation, Carotid artery PVAT, Vulnerable plaques
Inflammation of carotid artery perivascular adipose tissue (PVAT) is associated with atherosclerotic disease. This study investigated the association between carotid artery PVAT and atherosclerotic plaques using multi-contrast MR vessel wall imaging. The contrast-to-noise ratio (CNR) of PVAT was measured on TOF MRA images. We found that the CNR of carotid artery PVAT measured by TOF MRA is independently associated with carotid vulnerable plaque features, suggesting that the CNR of PVAT might be a potential indicator for vulnerable atherosclerotic plaques.
Introduction
It has been shown that inflammation of perivascular adipose tissue (PVAT) is associated with coronary and carotid artery atherosclerotic disease.1 Increasing evidence showed that carotid artery PVAT measured by computed tomography (CT) is associated with carotid plaque vulnerability.2,3 Apparently, CT can only provide CT attenuation for quantification of PVAT which may not be an ideal indicator for activity of PVAT. The signal intensity measured by magnetic resonance (MR) imaging can better quantitatively characterize tissues. However, there lacks investigations of the association between carotid artery PVAT characterized by MR imaging and carotid vulnerable plaques. The aim of this study was to investigate the association between carotid artery PVAT measured by time-of-flight (TOF) magnetic resonance angiography (MRA) and carotid vulnerable plaques.Methods
Study sample: Patients with moderate to severe carotid atherosclerotic stenosis referred to carotid endarterectomy (CEA) were recruited and underwent carotid multi-contrast MR vessel wall imaging before CEA. The study protocol was approved by institutional review board and consent form was obtained.MR imaging protocol: The carotid MR vessel wall imaging was performed on a 3.0T MR scanner (uMR 780, United Imaging, Shanghai, China) with 8-channel carotid coil. The imaging protocol included TOF MRA, T1 weighted (T1W), T2 weighted (T2W) and SNAP imaging sequences. All sequences were acquired with the identical in-plane spatial resolution of 0.54 mm × 0.54 mm and slice thickness of 2 mm. The imaging parameters are detailed in Table 1.
MR image analysis: Two radiologists with >5 years’ experience in neurovascular imaging reviewed the MR vessel wall images of stenotic carotid artery to identify plaque compositional features of calcification (CA), intraplaque hemorrhage (IPH), lipid-rich necrotic core (LRNC), loose matrix (LM) and ulcer. Presence of IPH, ulcer, or LRNC with an area ratio of more than 40% to the arterial wall was considered as vulnerable plaque feature. The lumen and outer wall boundaries were outlined on black blood T1W images and mapped on TOF MRA images registered with T1W images. The outer wall boundaries on TOF MRA were also magnified 1.5 times which will be considered as the region of interest (ROI) for quantification of PVAT. According to the fat suppression of T1W imaging and the difference in signal intensity between tissues, k-means clustering algorithm was used to automatically segment the fat mask on T1W images. The optimal number of clusters was determined as 4 using elbow method. The first group represents background and vessels, the second group represents fat, the third group represents muscle, and the fourth group represents lymph nodes and other high-intensity tissues, respectively. Carotid artery PVAT was identified as the fat component within the ROI region. An example for MR image analysis is shown in Figure 1. In addition, a circular ROI with a radius of 1mm was semi-automatically generated in the background and muscle regions respectively. The contrast-to-noise ratio (CNR) of PVAT at each slice was calculated, which is the ratio of the signal intensity difference between PVAT and muscle to the background noise signal intensity.
Statistical analysis: Generalized linear mixed model (GLMM) was conducted to investigate the associations between CNR of carotid artery PVAT and carotid plaque compositional features by minimizing the effect of slices from the same patient. P value <0.05 was statistically significant. All statistical analyses were performed on SPSS Statistics 26.
Results
A total of 61 patients (64.9±7.0 years old, 16 males) were recruited and 1000 axial slices were included. Clinical characteristics of study population are listed in Table 2. After adjusting for clinical risk factors including sex, age, smoking, alcohol, diabetes, hypertension, hyperlipidemia and coronary heart disease, the GLMM analysis showed that the CNR of carotid artery PVAT was significantly associated with the presence of CA (OR=1.679, 95%CI: 1.310-2.153, P<0.001), LRNC (OR=1.421, 95%CI: 1.170-1.725, P<0.001), and vulnerable atherosclerotic plaque (OR=1.232, 95%CI: 1.009-1.504, P=0.040) (Table 3).Discussion
The CNR of carotid artery PVAT was significantly associated with the presence of LRNC, but not with IPH and ulcer, possibly because there were too few slices containing IPH or ulcers. However, the CNR of carotid artery PVAT was significantly associated with the presence of most of vulnerable plaque features. Future studies with larger sample size are warranted.Conclusion
Our study demonstrated that the CNR of carotid artery PVAT measured by TOF MRA is associated with carotid vulnerable plaque features, suggesting that the CNR of carotid artery PVAT on TOF MRA might be a potential indicator for vulnerable atherosclerotic plaques.Acknowledgements
None.References
1. Lin A, Dey D, Wong DTL, et al. Perivascular Adipose Tissue and Coronary Atherosclerosis: from Biology to Imaging Phenotyping. Curr Atheroscler Rep. 2019; 21(12): 47.
2. Antonopoulos AS, Sanna F, Sabharwal N, et al. Detecting human coronary inflammation by imaging perivascular fat. Sci Transl Med. 2017; 9(398): eaal2658.
3. Saba L, Zucca S, Gupta A, et al. Perivascular Fat Density and Contrast Plaque Enhancement: Does a Correlation Exist? AJNR Am J Neuroradiol. 2020; 41(8): 1460-1465.Figures
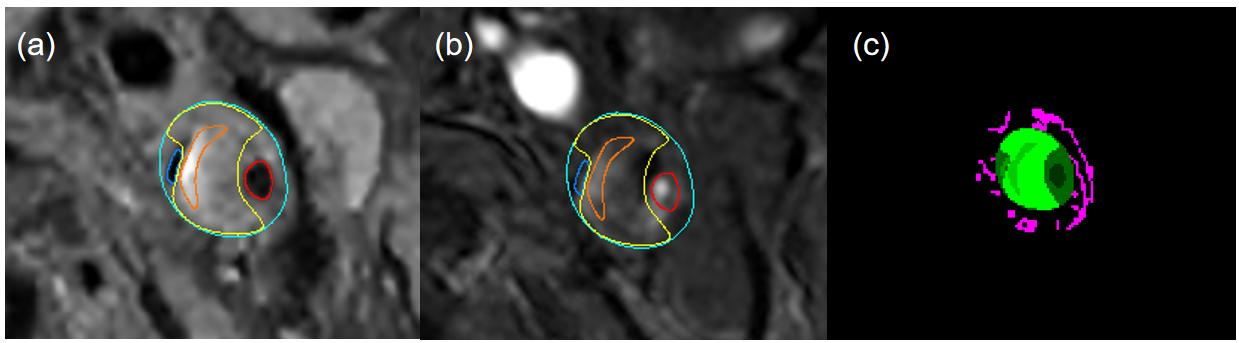
Figure 1. An example for MR image analysis. Image (a) and image (b) represent T1W and TOF image delineation results, respectively. Green: outer wall; red: lumen; blue: CA; yellow: LRNC; orange: IPH. Image (c) is the segmentation of PVAT mask. Green: carotid artery; pink: PVAT.
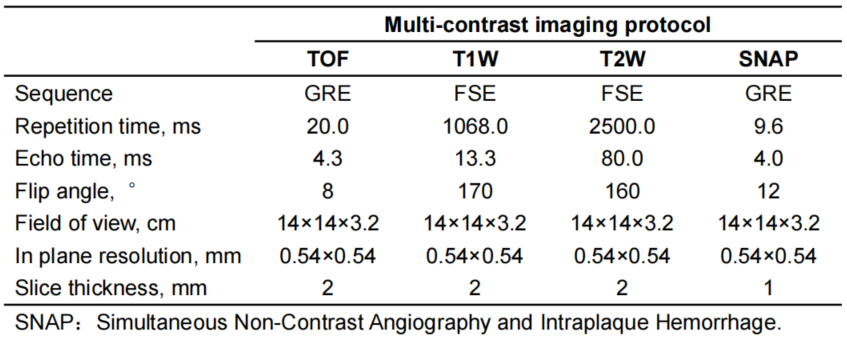
Table 1. Imaging parameters of MR imaging.
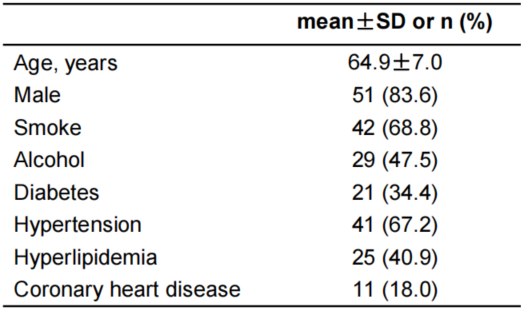
Table 2. Clinical characteristics of enrolled patients.
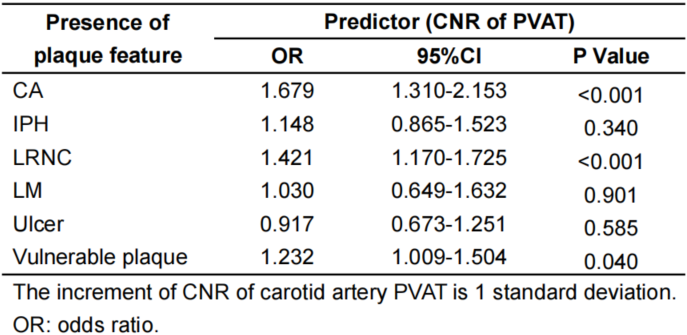
Table 3. GLMM analysis results.