1504
Discriminating Locally advanced and Metastatic Lung Cancer using Restriction Spectrum Imaging and Intravoxel Incoherent Motion Model1Institute of Biomedical and Health Engineering, Shenzhen Institutes of Advanced Technology, Chinese Academy of Sciences, Shenzhen, China, 2Department of Medical Imaging, Henan Provincial People’s Hospital & Zhengzhou University People’s Hospital, Zhengzhou, China, 3Central Research Institute, United Imaging Healthcare, Shanghai, China, 4Paul C. Lauterbur Centre for Biomedical Imaging, Shenzhen Institutes of Advanced Technology, Chinese Academy of Sciences, Shenzhen, China, 5Key Laboratory for Magnetic Resonance and Multimodality Imaging of Guangdong Province, Shenzhen, China
Synopsis
Keywords: Lung, Diffusion/other diffusion imaging techniques
A novel diffusion weighted imaging model called restriction spectrum imaging (RSI) captures the distinct diffusion behavior of tumors. The restricted diffusion correlates to tumor cellularity, a potential indicator of cancer aggressiveness. To assess its capability of characterizing lung cancer metastasis, we applied a three-compartment RSI model and intravoxel incoherent motion model to DWI images of locally advanced and metastatic lung cancer patients with the diagnosis of biopsy. The RSI model demonstrated its ability to discriminate the lung cancer of locally advanced (III) and metastatic (IV) stage, and the results outperforms the traditional IVIM model.INTRODUCTION
Lung cancer is one of the most common cancers in the world and the leading cause of cancer-related death in both genders1. Diffusion weighted imaging techniques have proved useful in the detection, characterization, and assessment of lung cancers2-5. Cancer staging is a crucial reference for clinical treatment strategies since it assesses the proliferation and aggressiveness of the cancer6. Utilizing DWI techniques to evaluate cancer metastasis could be a noninvasive option in clinical application7-9. Restriction spectrum imaging model is a novel DWI model that separates restricted diffusion from other compartments10, 11. The restricted diffusion correlates to tumor cellularity and is expected to be a potential indicator of cancer aggressiveness12, 13. In this study, we applied RSI and IVIM model to evaluate and compared their ability on differentiating stage III and stage IV lung cancer.METHODS
Twenty stage III patients and twenty-five stage IV lung cancer patients with the diagnosis of biopsy were involved in this study. DWI acquisitions were performed on a 3T whole-body scanner (uMR 790, Shanghai United Imaging Healthcare, Shanghai, China) using a body coil. DWI was performed using Single Shot-Echo Planar Imaging (SS-EPI) at b values of 0-1000 s/mm2 with 3 directions at each respective nonzero b value. Other parameters of DWI were: TR/TE = 1651.0/69.6 ms, FOV = 300 × 400 mm2, matrix = 192 × 256, slice thickness = 5 mm, intersection gap = 6 mm, number of slices = 10, scanning time≈5 min.All DWI data underwent preprocessing procedures including eddy current, motion, and EPI distortion correction by TORTOISE14, 15. Two experienced radiologists were in charge of the cancer ROI delineation on DWI images, and they were blinded to the histopathological information of each patient.
The RSI model used in this study can be represented as the sum of three exponential decay terms:
$$ S(b)=C_1 e^{-bD_1}+C_2 e^{-bD_2}+C_3 e^{-bD_3}, D_1<D_2<D_3. $$
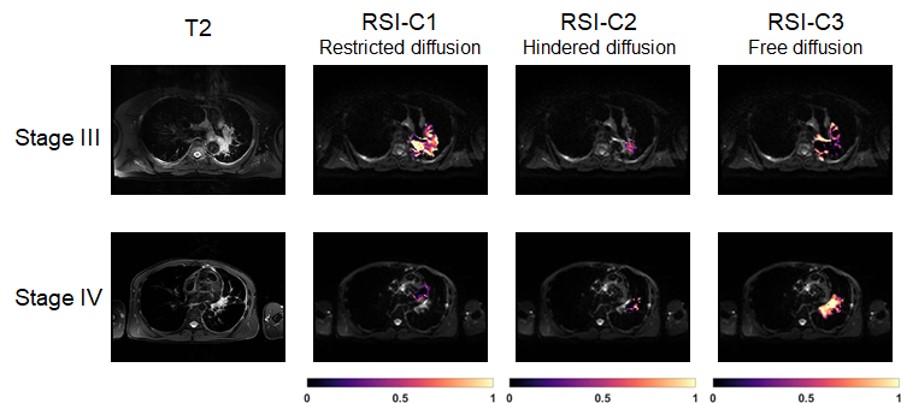
The three terms with different ADC values represent different water diffusion compartments15, 16. In equation 1, S(b) corresponds to the signal attenuation at each b-value. C1, C2, and C3 represent the weighting factors of restricted diffusion, hindered diffusion, and free water diffusion compartments, respectively17. D1, D2, and D3 denote the ADCs of the corresponding compartments. According to theoretical values and experimental trials16-19, the ADCs were globally determined as 0, 1.5×10⁻³ mm2/s, and 3.0×10⁻³ mm2/s. The D values were determined and fixed to prevent overfitting during the fitting process17.
Intravoxel Incoherent Motion (IVIM) model were applied to the DWI data and processed with in-house prototype software developed by MATLAB (Mathworks, Natick, Mass). Statistics analysis including Mean ± Standard Deviation, analysis of variance (ANOVA) followed by the Tukey’s test, correlation analysis were used in this study. P < 0.01 was considered statistically significant. Receiver operating characteristic curves (ROC) and area under the curve (AUC) were used to compare the performance of RSI and IVIM models in differentiating the advanced lung cancer – stage III and stage IV.
RESULTS
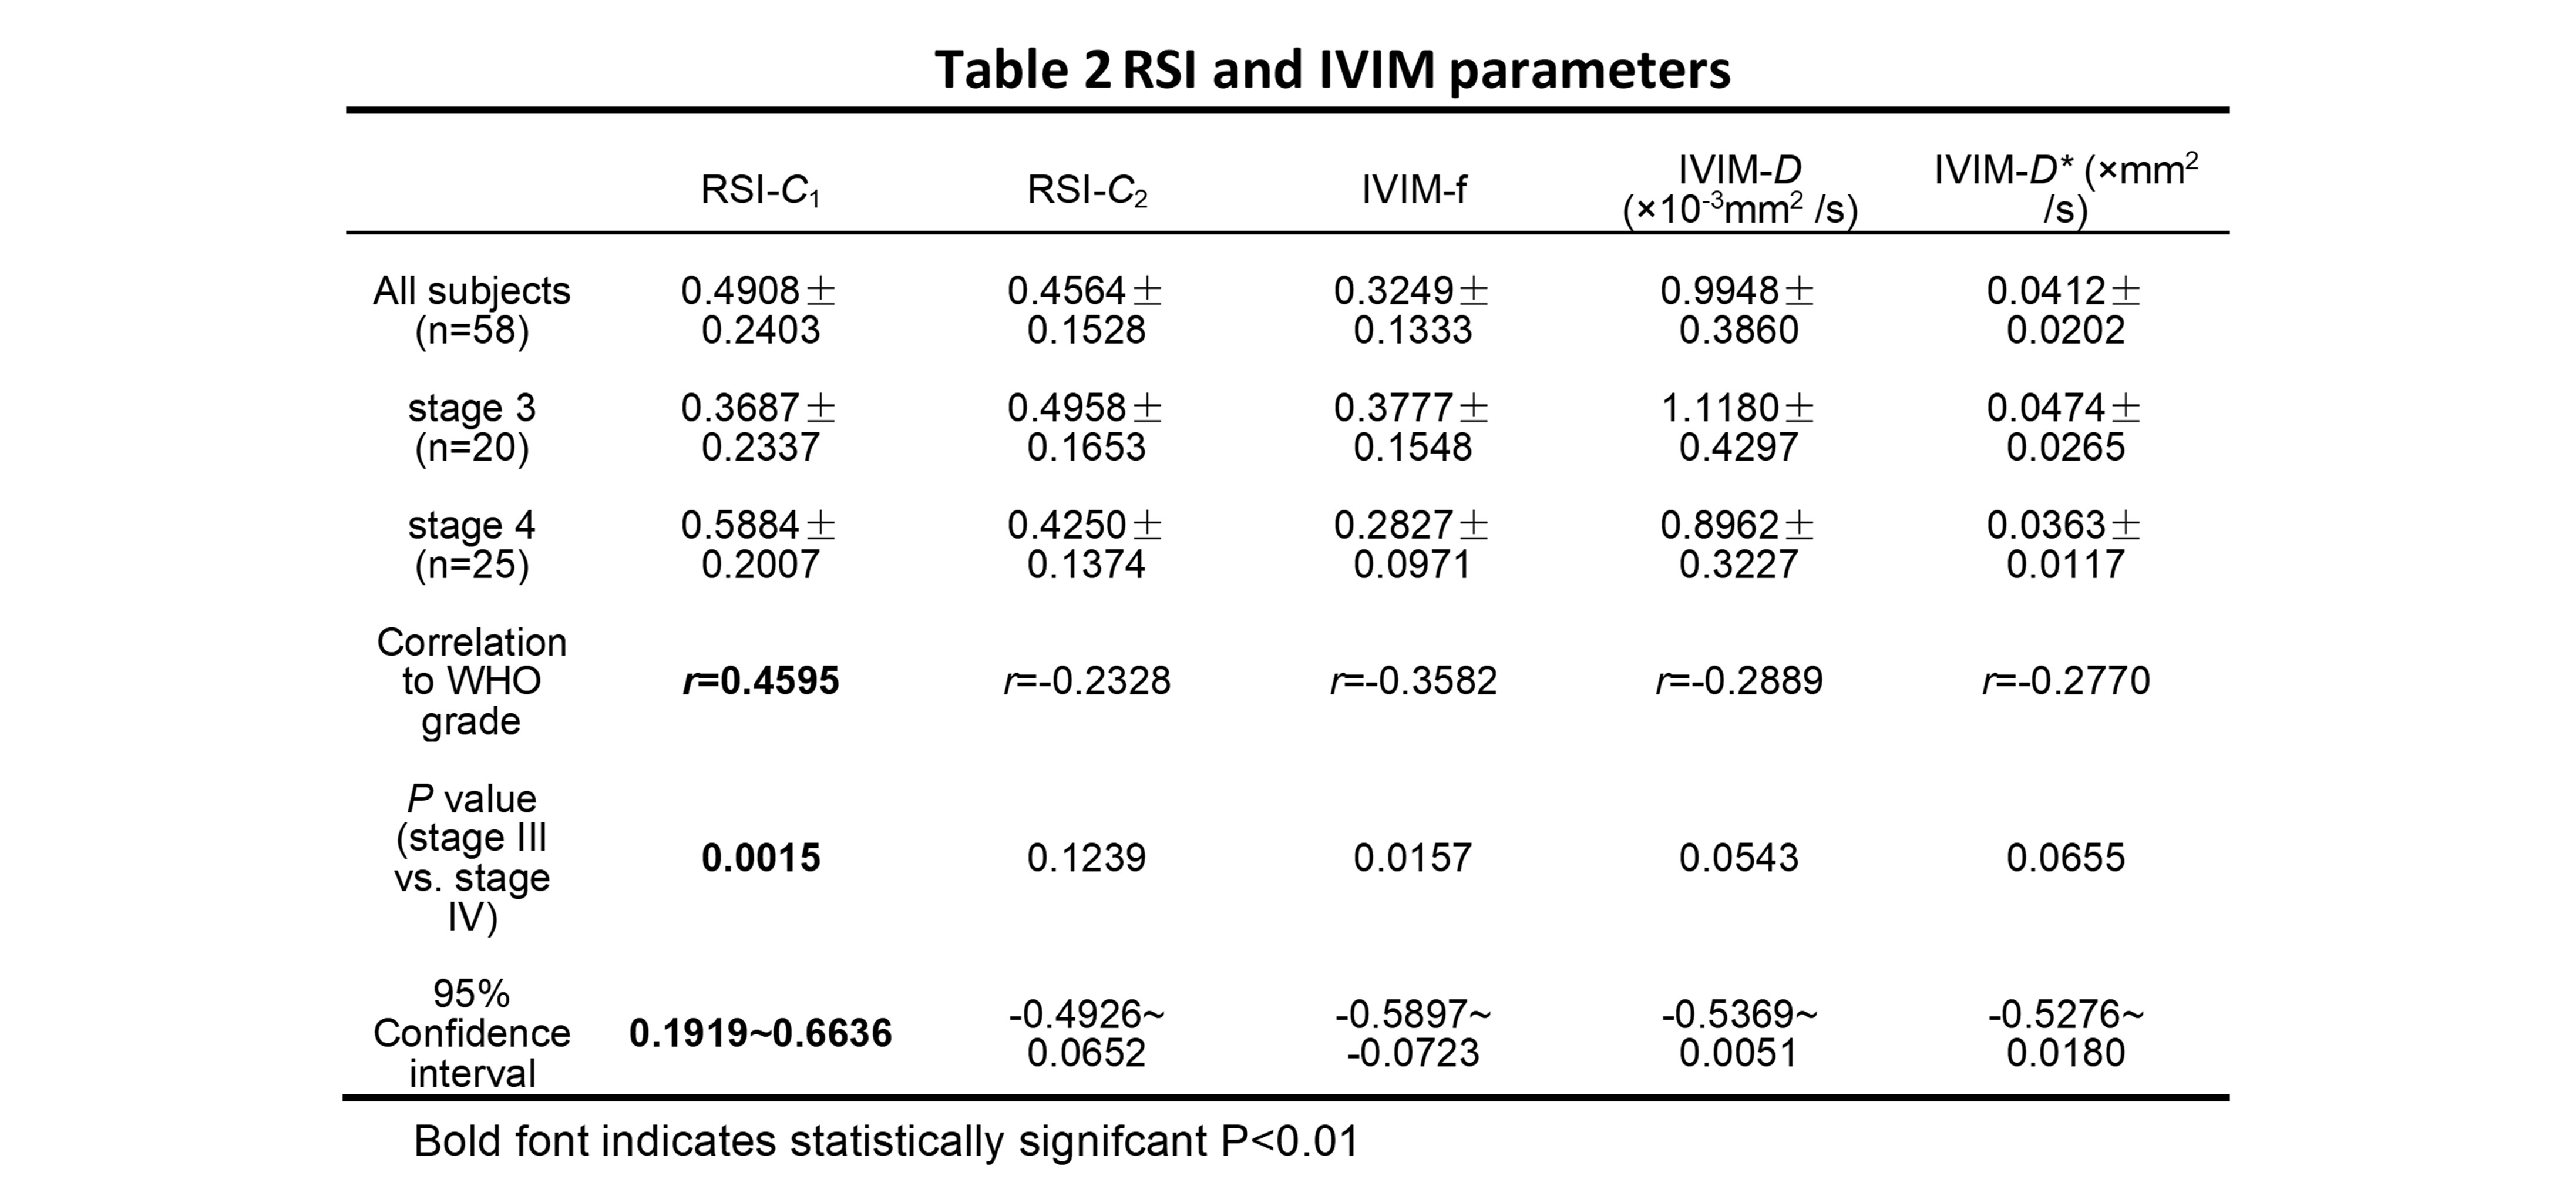
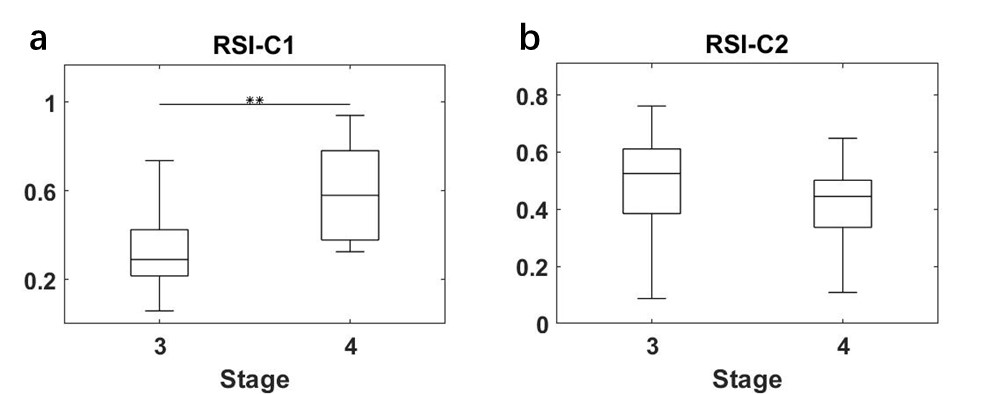
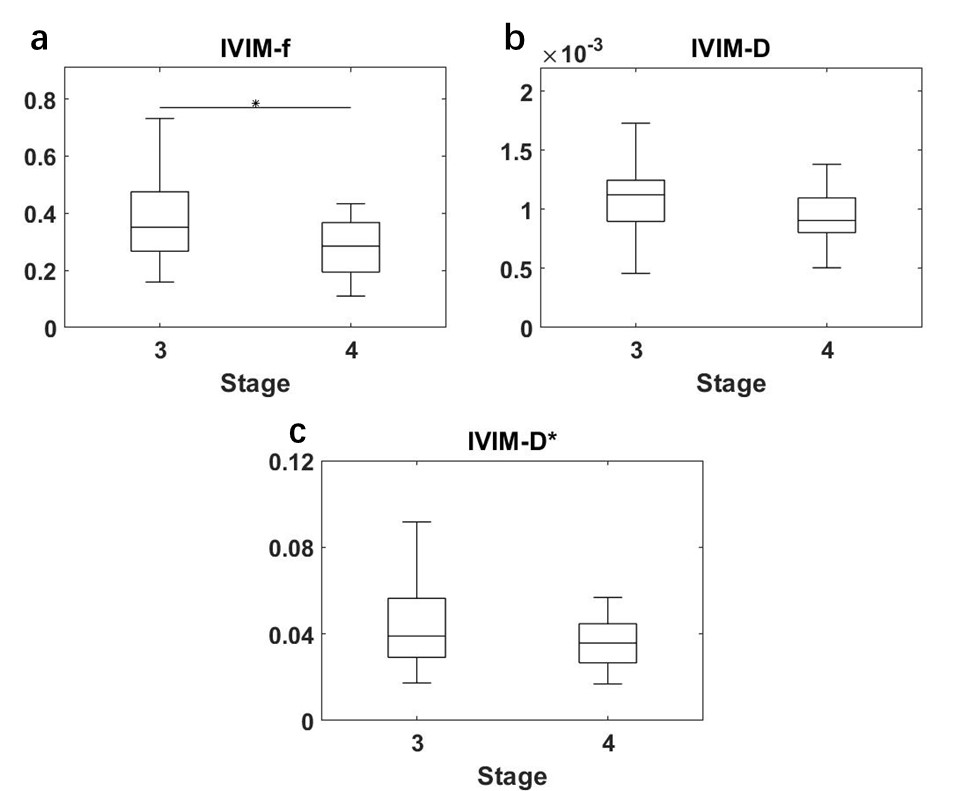
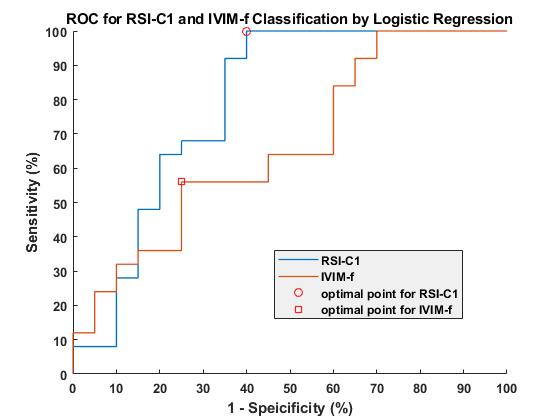
All statistical results were presented in table 1. Since the compartment of free water diffusion (RSI-C3) provides no tumor-specific information, the analysis of RSI would focus on the restricted diffusion and hindered diffusion compartment (RSI-C1 and RSI-C2). According to the results, the volume fraction of restricted compartment C1 from RSI was significantly correlated with stages and showed significant difference between stage III and stage IV (r = 0.4595, P = 0.0015). As for IVIM parameter, the correlation with stages of perfusion volume fraction f is r = -0.3582 with P = 0.0157.Figure 4 demonstrates the diagnostic performance of RSI-C1 and IVIM-f. The sensitivity, specificity, and AUC of RSI-C1 in discriminating stage III and stage IV lung tumor were 100%, 60.0% and 0.792, while those of IVIM-f were 56%, 75% and 0.666, respectively.
DISCUSSION
Our study shows that three-compartment RSI model has great capability of discriminating stage III and stage IV patients. According to the results, RSI has better performance on advanced lung cancer discrimination than IVIM, which shows its potential in clinical lung tumor staging noninvasively.These results are a preliminary study of RSI ability on tumor staging. More data are being collected for detailed staging categories. According to the International Staging System for Lung Cancer20, the general categories of stage I-IV are determined by the combinations of the T, N, M categories, which represents the size and extent of the tumor, the involvement of tumor in the lymph Nodes, and the spread of the tumor, respectively20. The staging can be further divided into subgroups of A stage and B stage for tumor aggressiveness. Further studies would be conducted in the future and more pathological information would be included.
Although integrated PET/CT currently has the upper hand for staging of lung cancer. Considering cost and diagnostic efficacy21, MRI and PET/MRI have a role to play for future evaluation of lung cancer patients22. In that case, RSI could be a potential non-invasive MRI marker for lung cancer.
CONCLUSION
In conclusion, our study shows the RSI model outperforms the IVIM model in lung cancer staging. It shows great potential in clinical lung cancer assessment and provides a novel non-invasive DWI marker for lung cancer.Acknowledgements
This research was supported by the National natural Science Foundation of China [Grant Number 61901462 and 81801724], the Guangdong Grant Key Technologies for Treatment of Brain Disorders’ [Grant Number 2018B030332001], Scientific Instrument Innovation Team of the Chinese Academy of Sciences [Grant Number GJJSTD20180002], International Partnership Program of Chinese Academy of Sciences Grant [Grant Number 154144KYSB20180063], and the Strategic Priority Research Program of Chinese Academy of Sciences [Grant Number XDB25000000].References
1.Fitzmaurice C, Dicker D, Pain A et al: The global burden of cancer 2013. JAMA oncology 2015, 1(4):505-527.
2.Shen G, Hu S, Deng H et al: Performance of DWI in the nodal characterization and assessment of lung cancer: a meta-analysis. AJR Am J Roentgenol 2016, 206(2):283-290.
3.Qi LP, Zhang XP, Tang L et al: Using diffusion-weighted MR imaging for tumor detection in the collapsed lung: a preliminary study. European radiology 2009, 19(2):333-341.
4.Usuda K, Zhao X-T, Sagawa M et al: Diffusion-weighted imaging is superior to positron emission tomography in the detection and nodal assessment of lung cancers. The Annals of thoracic surgery 2011, 91(6):1689-1695.
5.Usuda K, Iwai S, Funasaki A et al: Diffusion-weighted magnetic resonance imaging is useful for the response evaluation of chemotherapy and/or radiotherapy to recurrent lesions of lung cancer. Translational oncology 2019, 12(5):699-704.
6.Nicholls R, Mason AY, Morson B et al: The clinical staging of rectal cancer. Journal of British Surgery 1982, 69(7):404-409.
7.Kitajima K, Yamasaki E, Kaji Y et al: Comparison of DWI and PET/CT in evaluation of lymph node metastasis in uterine cancer. World journal of radiology 2012, 4(5):207.
8.Takenaka D, Ohno Y, Matsumoto K et al: Detection of bone metastases in non‐small cell lung cancer patients: Comparison of whole‐body diffusion‐weighted imaging (DWI), whole‐body MR imaging without and with DWI, whole‐body FDG‐PET/CT, and bone scintigraphy. Journal of Magnetic Resonance Imaging: An Official Journal of the International Society for Magnetic Resonance in Medicine 2009, 30(2):298-308.
9.Shen G, Lan Y, Zhang K et al: Comparison of 18F-FDG PET/CT and DWI for detection of mediastinal nodal metastasis in non-small cell lung cancer: A meta-analysis. PLoS One 2017, 12(3):e0173104.
10.White NS, Leergaard TB, D'Arceuil H et al: Probing tissue microstructure with restriction spectrum imaging: histological and theoretical validation. Human brain mapping 2013, 34(2):327-346.
11.Brunsing RL, Schenker‐Ahmed NM, White NS et al: Restriction spectrum imaging: An evolving imaging biomarker in prostate MRI. Journal of Magnetic Resonance Imaging 2017, 45(2):323-336.
12.Humphries PD, Sebire NJ, Siegel MJ et al: Tumors in pediatric patients at diffusion-weighted MR imaging: apparent diffusion coefficient and tumor cellularity. Radiology 2007, 245(3):848-854.
13.Yamin G, Schenker-Ahmed NM, Shabaik A et al: Voxel level radiologic–pathologic validation of restriction spectrum imaging cellularity index with Gleason grade in prostate cancer. Clinical Cancer Research 2016, 22(11):2668-2674.
14.Irfanoglu MO, Nayak A, Jenkins J et al: TORTOISE v3: Improvements and new features of the NIH diffusion MRI processing pipeline. In: Program and proceedings of the ISMRM 25th annual meeting and exhibition, Honolulu, HI, USA: 2017; 2017.
15.Pierpaoli C, Walker L, Irfanoglu MO et al: TORTOISE: an integrated software package for processing of diffusion MRI data. In: ISMRM 18th annual meeting: 2010: Stockholm; 2010.
16.Xiong Z, Geng Z, Lian S et al: Discriminating rectal cancer grades using restriction spectrum imaging. Abdominal Radiology 2022, 47(6):2014-2022.
17.Conlin CC, Feng CH, Rodriguez‐Soto AE et al: Improved characterization of diffusion in normal and cancerous prostate tissue through optimization of multicompartmental signal models. Journal of Magnetic Resonance Imaging 2021, 53(2):628-639.
18.Stejskal EO, Tanner JE: Spin diffusion measurements: spin echoes in the presence of a time‐dependent field gradient. The journal of chemical physics 1965, 42(1):288-292.
19.Morozov S, Sergunova K, Petraikin A et al: Diffusion processes modeling in magnetic resonance imaging. Insights into Imaging 2020, 11(1):1-9.
20.Rubin P, Hansen JT: TNM staging atlas with oncoanatomy: Lippincott Williams & Wilkins; 2013.
21.Usuda K, Funazaki A, Maeda R et al: Economic benefits and diagnostic quality of diffusion-weighted magnetic resonance imaging for primary lung cancer. Annals of Thoracic and Cardiovascular Surgery 2017:ra. 17-00097.
22.Kim HS, Lee KS, Ohno Y et al: PET/CT versus MRI for diagnosis, staging, and follow‐up of lung cancer. Journal of Magnetic Resonance Imaging 2015, 42(2):247-260.
Figures