1501
Models based on diffusion-weighted imaging in tumor staging and histologic grading of bladder cancer: A comparison study
Cong You1, Yujiao Zhao2, Cheng Zhang1, Mengyao Chen1, Jinxia Zhu3, Feifei Qu3, Thomas Benkert4, Robert Grimm4, and Wen Shen2
1The First Central Clinical School, Tianjin Medical University, Tianjin, China, 2Department of Radiology, Tianjin First Central Hospital, School of Medicine, Nankai University, Tianjin, China, 3MR Collaboration, Siemens Healthineers Ltd., Beijing, China, 4MR Application Predevelopment, Siemens Healthcare GmbH, Erlangen, Germany
1The First Central Clinical School, Tianjin Medical University, Tianjin, China, 2Department of Radiology, Tianjin First Central Hospital, School of Medicine, Nankai University, Tianjin, China, 3MR Collaboration, Siemens Healthineers Ltd., Beijing, China, 4MR Application Predevelopment, Siemens Healthcare GmbH, Erlangen, Germany
Synopsis
Keywords: Urogenital, Diffusion/other diffusion imaging techniques, bladder cancer; diffusion-weighted imaging; monoexponential model;intravoxel incoherence motion;diffusion kurtosis imaging
This comparative study aimed to investigate the ability of Gaussian distribution models, including monoexponential model (MEM) and intravoxel incoherence motion (IVIM), and non-Gaussian diffusion kurtosis models to differentiate the pathologic stages and histologic grades of bladder cancer. The results indicated that the diffusion kurtosis imaging (DKI) parameters had the highest diagnostic performance. The mean kurtosis (MK) value among individual parameters and the combination of MK and mean diffusivity (MD) among combined values had the largest area under the curves. Also, the MK values were most strongly correlated with the Ki-67 labeling index.Abstract
IntroductionThe clinical treatment modality and prognosis of bladder cancer (BC) depend on the stage and histologic grade of the tumor [1]. Diffusion-weighted imaging (DWI) is used to detect and evaluate BC in clinical practice. It can reflect tissue microstructural information by quantifying the diffusivity of water molecules within the tissue [2]. Apparent diffusion coefficient (ADC) calculated from the DWI monoexponential model (MEM) provides information on both water molecule diffusion and microcirculatory perfusion. The intravoxel incoherence motion (IVIM) model proposed by Le Bihan et al. simplified tissues into 2 separate pools of protons to estimate diffusion and perfusion separately and might describe tissues more accurately [3]. However, MEM and IVIM are based on the assumption that diffusion is unrestricted and obeys a Gaussian distribution; hence, they cannot accurately reflect the water diffusion coefficient in vivo. Diffusion kurtosis imaging (DKI) is based on a complex non-Gaussian distribution kurtosis model that quantifies deviations due to irregularity and heterogeneity of cellular microarchitecture and tissue composition [4]. Currently, which diffusion model has advantages in characterizing BC is unclear.
Our study aimed to evaluate the ability of DKI to differentiate BC stage and grade compared with MEM and IVIM models. It also explored whether a correlation existed between DKI parameters and the Ki-67 labeling index (LI).
Method
This prospective study included 58 patients (45 men and 13 women; median age, 71 years; age range, 47-88 years) with histopathologically proven bladder urothelial carcinomas. All patients were examined using a 3T system (MAGNETOM Prisma, Siemens Healthcare, Erlangen, Germany). The scanning sequences included axial T1-weighted [3-mm/0.3-mm gap; field of view (FOV) = 24×24 cm2; TR/TE = 591/24 milliseconds; matrix size = 200×320] and T2-weighted HASTE TSE (3-mm/0.3-mm gap; FOV = 24×24 cm2; TR/TE = 2100/82 milliseconds; matrix size = 175×320), and DWI sequence. Multi-b-value DWI sequence (3-mm/0.3-mm gap; FOV = 30×30 cm2; TR/TE = 2300/56 milliseconds; matrix size = 104×128) was acquired using integrated slice-specific dynamic shim (ishim) technique performed by a prototype sequence (with 13 b values (0, 10, 20, 30, 50, 100, 200, 300, 500, 800, 1000, 1500, and 2000 s/mm2).
The acquired DWI images were post-processed using prototype software (MR Body Diffusion Toolbox, Siemens Healthcare). The ADC values were calculated using the MEM model. The true diffusion coefficient (D), pseudodiffusion coefficient (D*), and perfusion fraction (f) were calculated using IVIM model [3]. The mean diffusivity (MD) and mean kurtosis (MK) were calculated using the DKI model [4]. The independent samples t-test were used for comparing parameters between non-muscle-invasive BC (NMIBC) (n=31) and muscle-invasive BC (MIBC) (n=27) groups, as well as high-grade (n=35) and low-grade (n=23) groups. The receiver-operating characteristic (ROC) analysis was performed to obtain the corresponding diagnostic test characteristics for distinguishing between the histologic grade and pathologic stage. Spearman rank correlation analysis was used to evaluate the correlation between the proliferation index and each parameter.
Results
Representative diffusion images of high-grade MIBC are displayed in Figure 1. The ADC, f, D, and MD values were considerably lower in the MIBC versus NMIBC and in high-grade versus low-grade groups (all P<0.05), whereas MK values were considerably higher in the MIBC versus NMIBC and high-grade versus low-grade groups (all P<0.001) (Table 1). The D* values demonstrated no substantial (P>0.05) differences between the MIBC and NMIBC groups, as well as between the high- and low-grade groups (Figure 2).
For differentiating MIBC from NMIBC, MK had the largest area under the curve (AUC) among individual diffusion parameters (0.952), followed by MD (0.872) and ADC (0.849). The combination of MK and MD had the highest AUC of 0.962. The AUC of the combination of MK and MD was considerably higher than that of the combination of f and D (0.869) (P=0.025).
Regarding the histologic grade, MK also had the largest AUC among individual diffusion parameters (0.898), followed by MD (0.851) and D (0.844). The combination of MK and MD had the highest AUC of 0.916. The AUC of the combination of MK and MD was not substantially different from that of the combination of f and D (0.899) (P=0.761) (Figure 3).
Figure 4 shows the Spearman rank correlation between Ki-67 LI and each diffusion parameter. MK revealed a strong positive correlation, and ADC, MD, and D revealed a moderate negative correlation (all P<0.05).
Discussion
This study evaluated the application value of DWI MEM, IVIM, and DKI models in the preoperative differentiation between BC pathologic stage and histologic grade. The MK values obtained from DKI models had the highest diagnostic performance, which was improved by the combination of MK and MD. Ki-67 LI is an established marker of cell proliferation and tumor invasion [5]. The MK values were strongly correlated with Ki-67 LI, indicating that they had great potential in the noninvasive evaluation of the cell proliferation and tumor invasiveness of BC.
Conclusions
DKI parameters displayed better performance than the MEM and IVIM parameters in differentiating MIBC from NMIBC and high-grade from low-grade BC. Also, the MK value more accurately reflected tissue microstructure characteristics and might serve as an imaging biomarker to reflect the invasiveness and proliferation of BC.
Acknowledgements
The authors appreciate all participants for contributing to the study.References
1 Babjuk M, Burger M, Comperat EM et al (2019) European Association of Urology Guidelines on Non-muscle-invasive Bladder Cancer (TaT1 and Carcinoma In Situ) - 2019 Update. Eur Urol 76:639-6572 Padhani AR, Liu G, Koh DM et al (2009) Diffusion-weighted magnetic resonance imaging as a cancer biomarker: consensus and recommendations. Neoplasia 11:102-125
3 Le Bihan D, Breton E, Lallemand D, Aubin ML, Vignaud J, Laval-Jeantet M (1988) Separation of diffusion and perfusion in intravoxel incoherent motion MR imaging. Radiology 168:497-505
4 Jensen JH, Helpern JA, Ramani A, Lu H, Kaczynski K (2005) Diffusional kurtosis imaging: the quantification of non-gaussian water diffusion by means of magnetic resonance imaging. Magn Reson Med 53:1432-1440
5 Margulis V, Lotan Y, Karakiewicz PI et al (2009) Multi-institutional validation of the predictive value of Ki-67 labeling index in patients with urinary bladder cancer. J Natl Cancer Inst 101:114-119
Figures
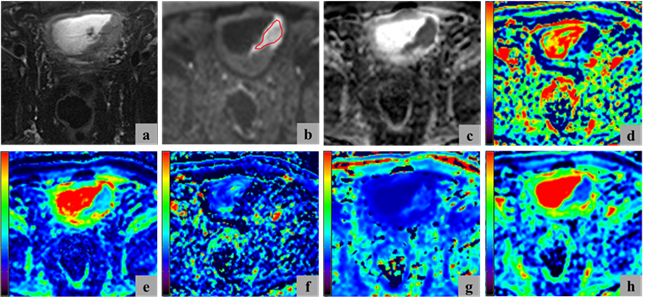
Figure 1. Representative diffusion images of high-grade MIBC. (a) T2-weighted image, (b) DWI (b = 1000 s/mm2), (c) ADC map, (d) f map, (e) D map, (f) D* map, (g) MK map, and (h) MD map. The region of interest used to calculate the mean and standard deviation for each parameter was marked by the red curve in (b).
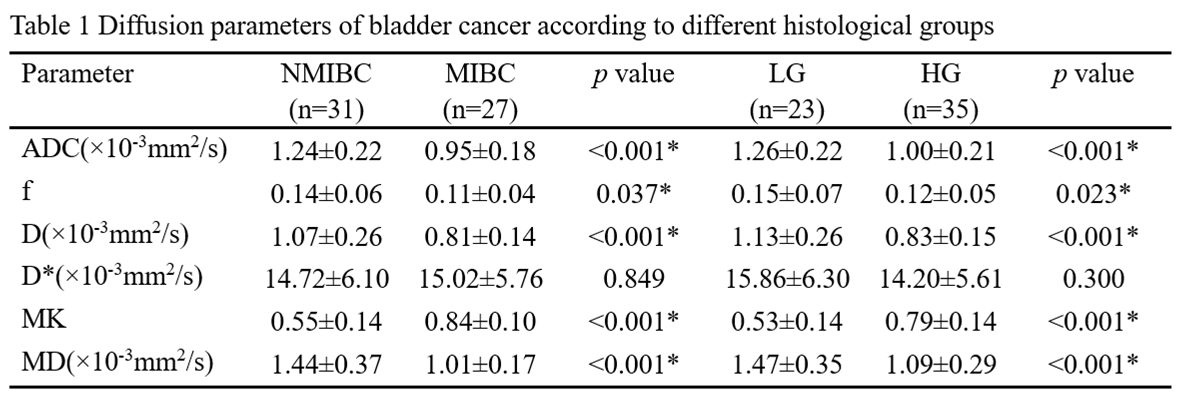
Table 1. Data represent means ± standard deviation values for all parameters. *Represents statistical significance.
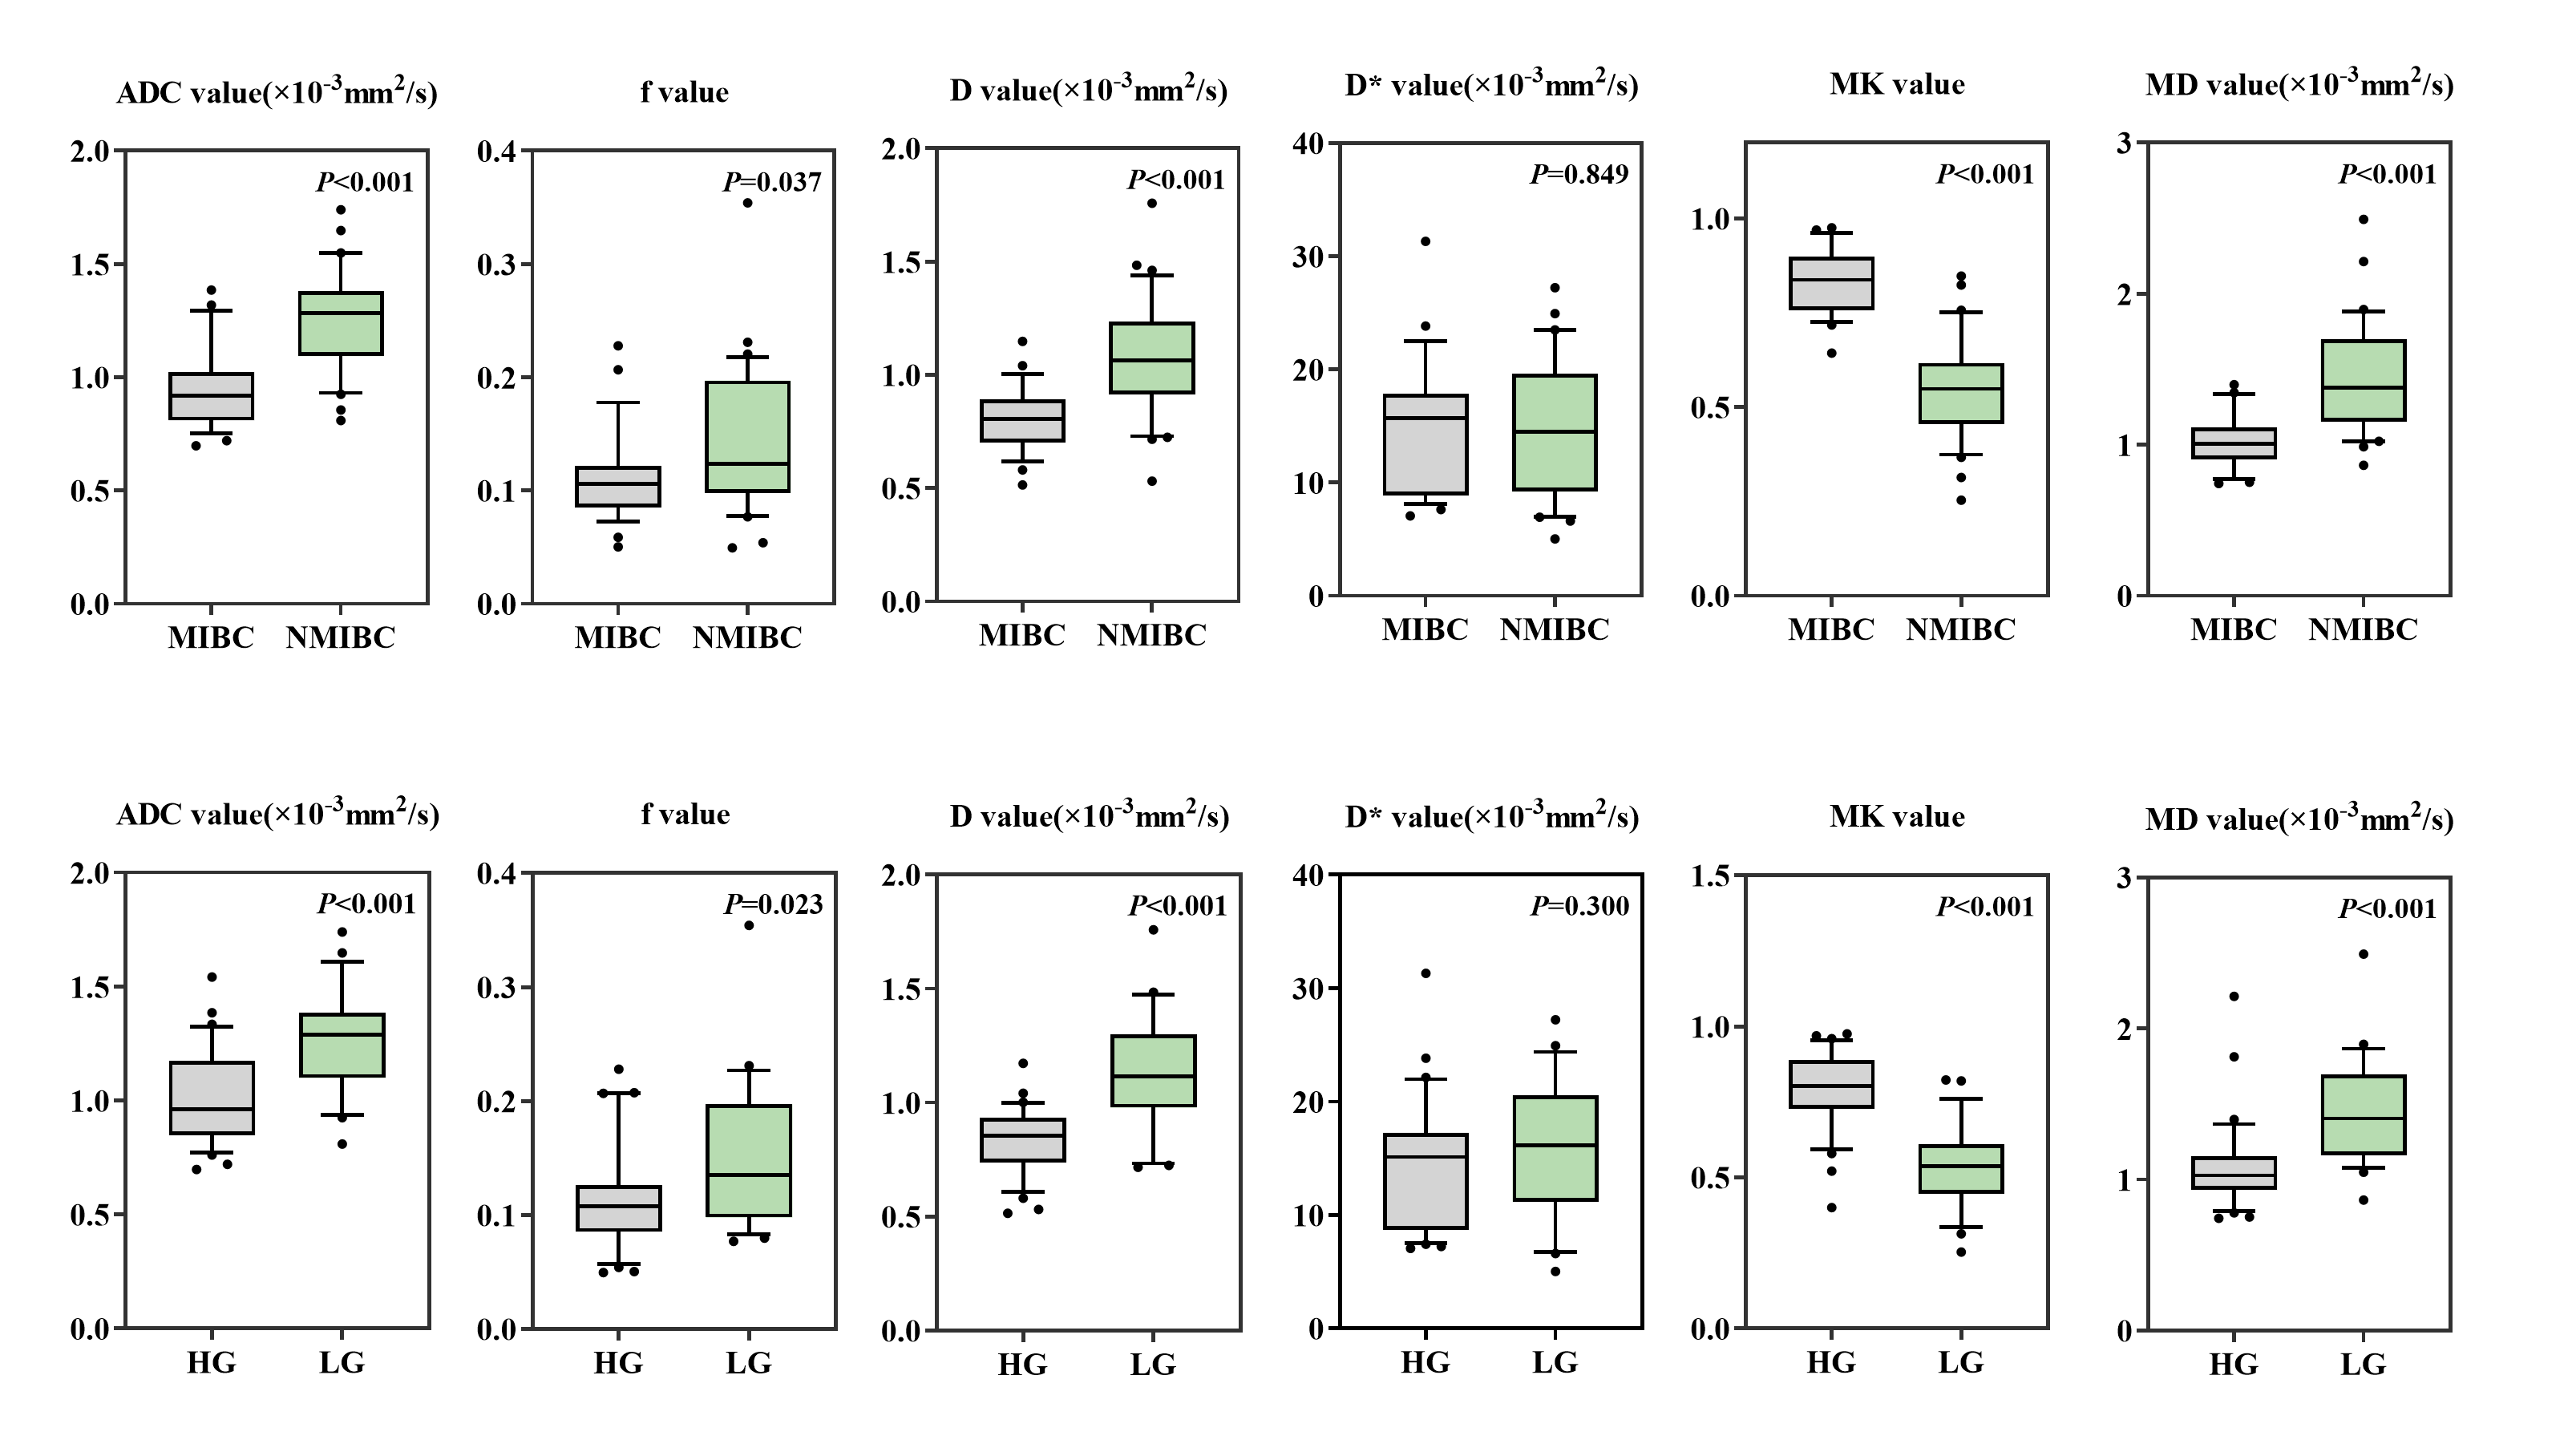
Figure 2. Box-and-whisker plots display the distributions of the MEM parameters (ADC), IVIM parameters (f, D, and D*), and DKI parameters (MK and MD) between the NMIBC and MIBC groups (first row) and between the low- and high-grade tumor groups (second row). Dots indicate outliers.
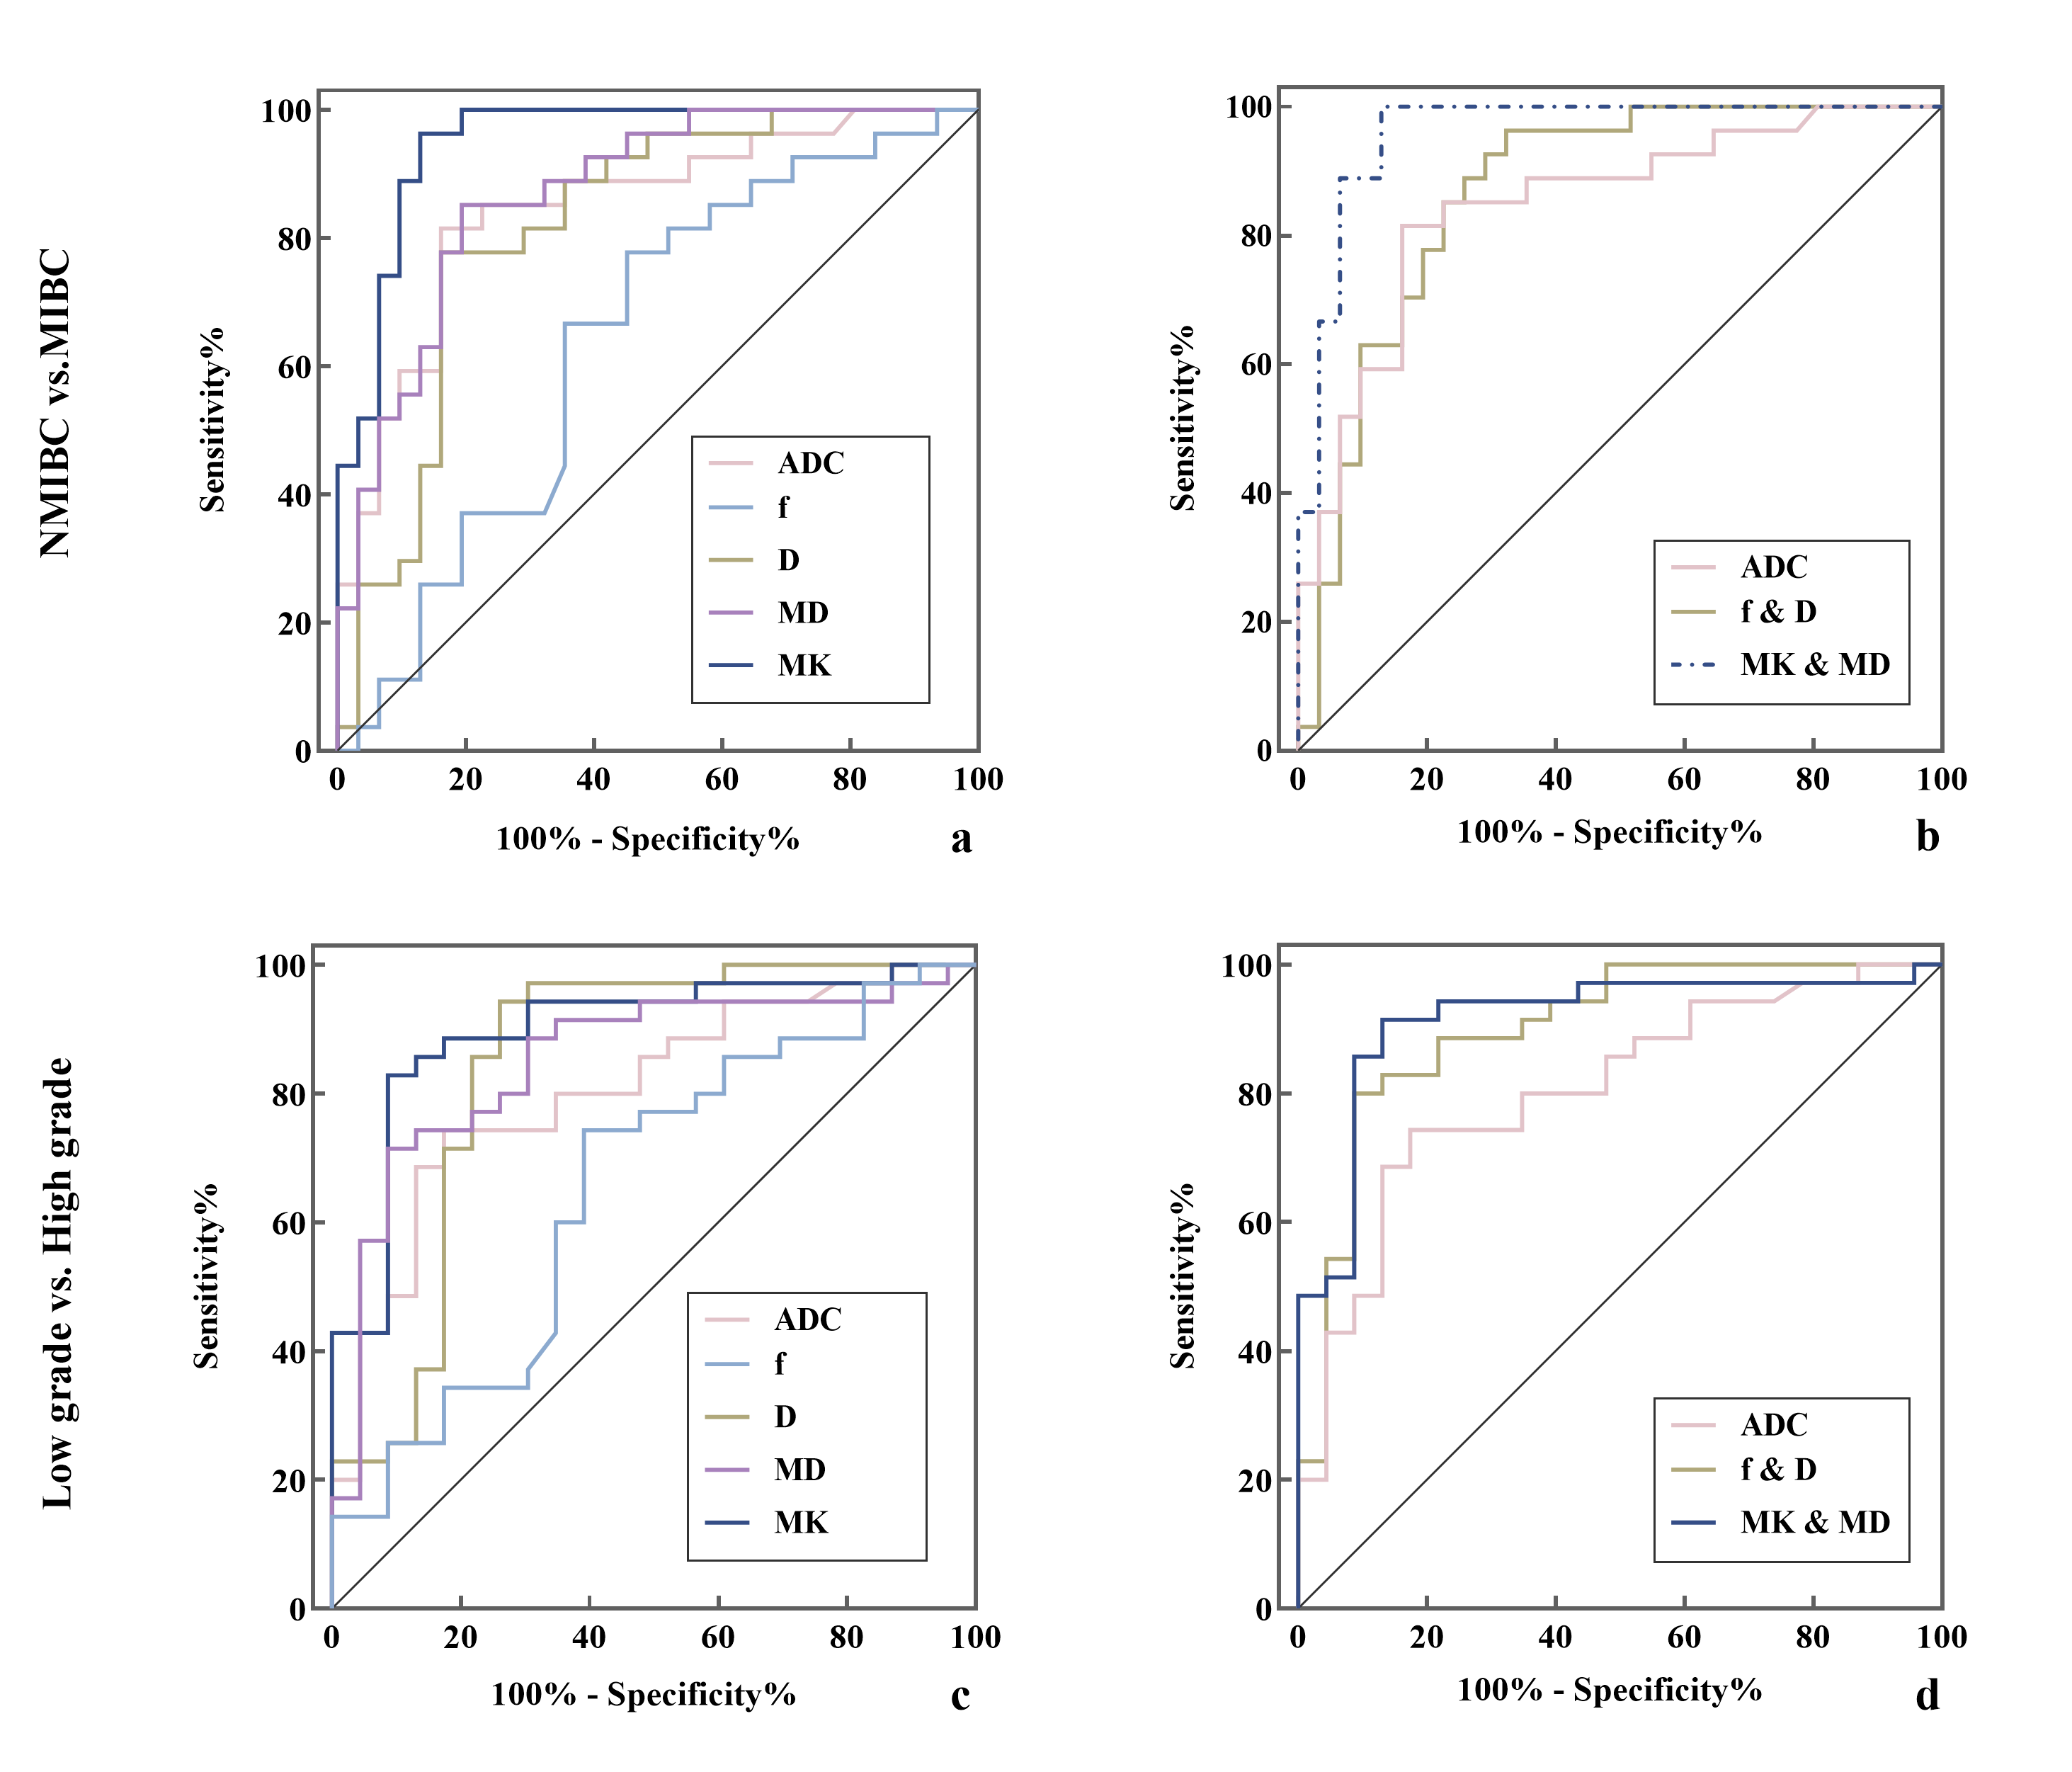
Figure 3. ROC curves of the diagnostic performance of the individual diffusion parameters (a and c) and the combination parameters of 3 diffusion models (b and d) for differentiating MIBC from NMIBC (a and b) as well as between low- and high-grade bladder cancer (c and d). The combination of MK and MD had the highest AUCs for distinguishing MIBC from NMIBC (AUC = 0.962) and differentiating high-grade from low-grade bladder cancer (AUC = 0.916).
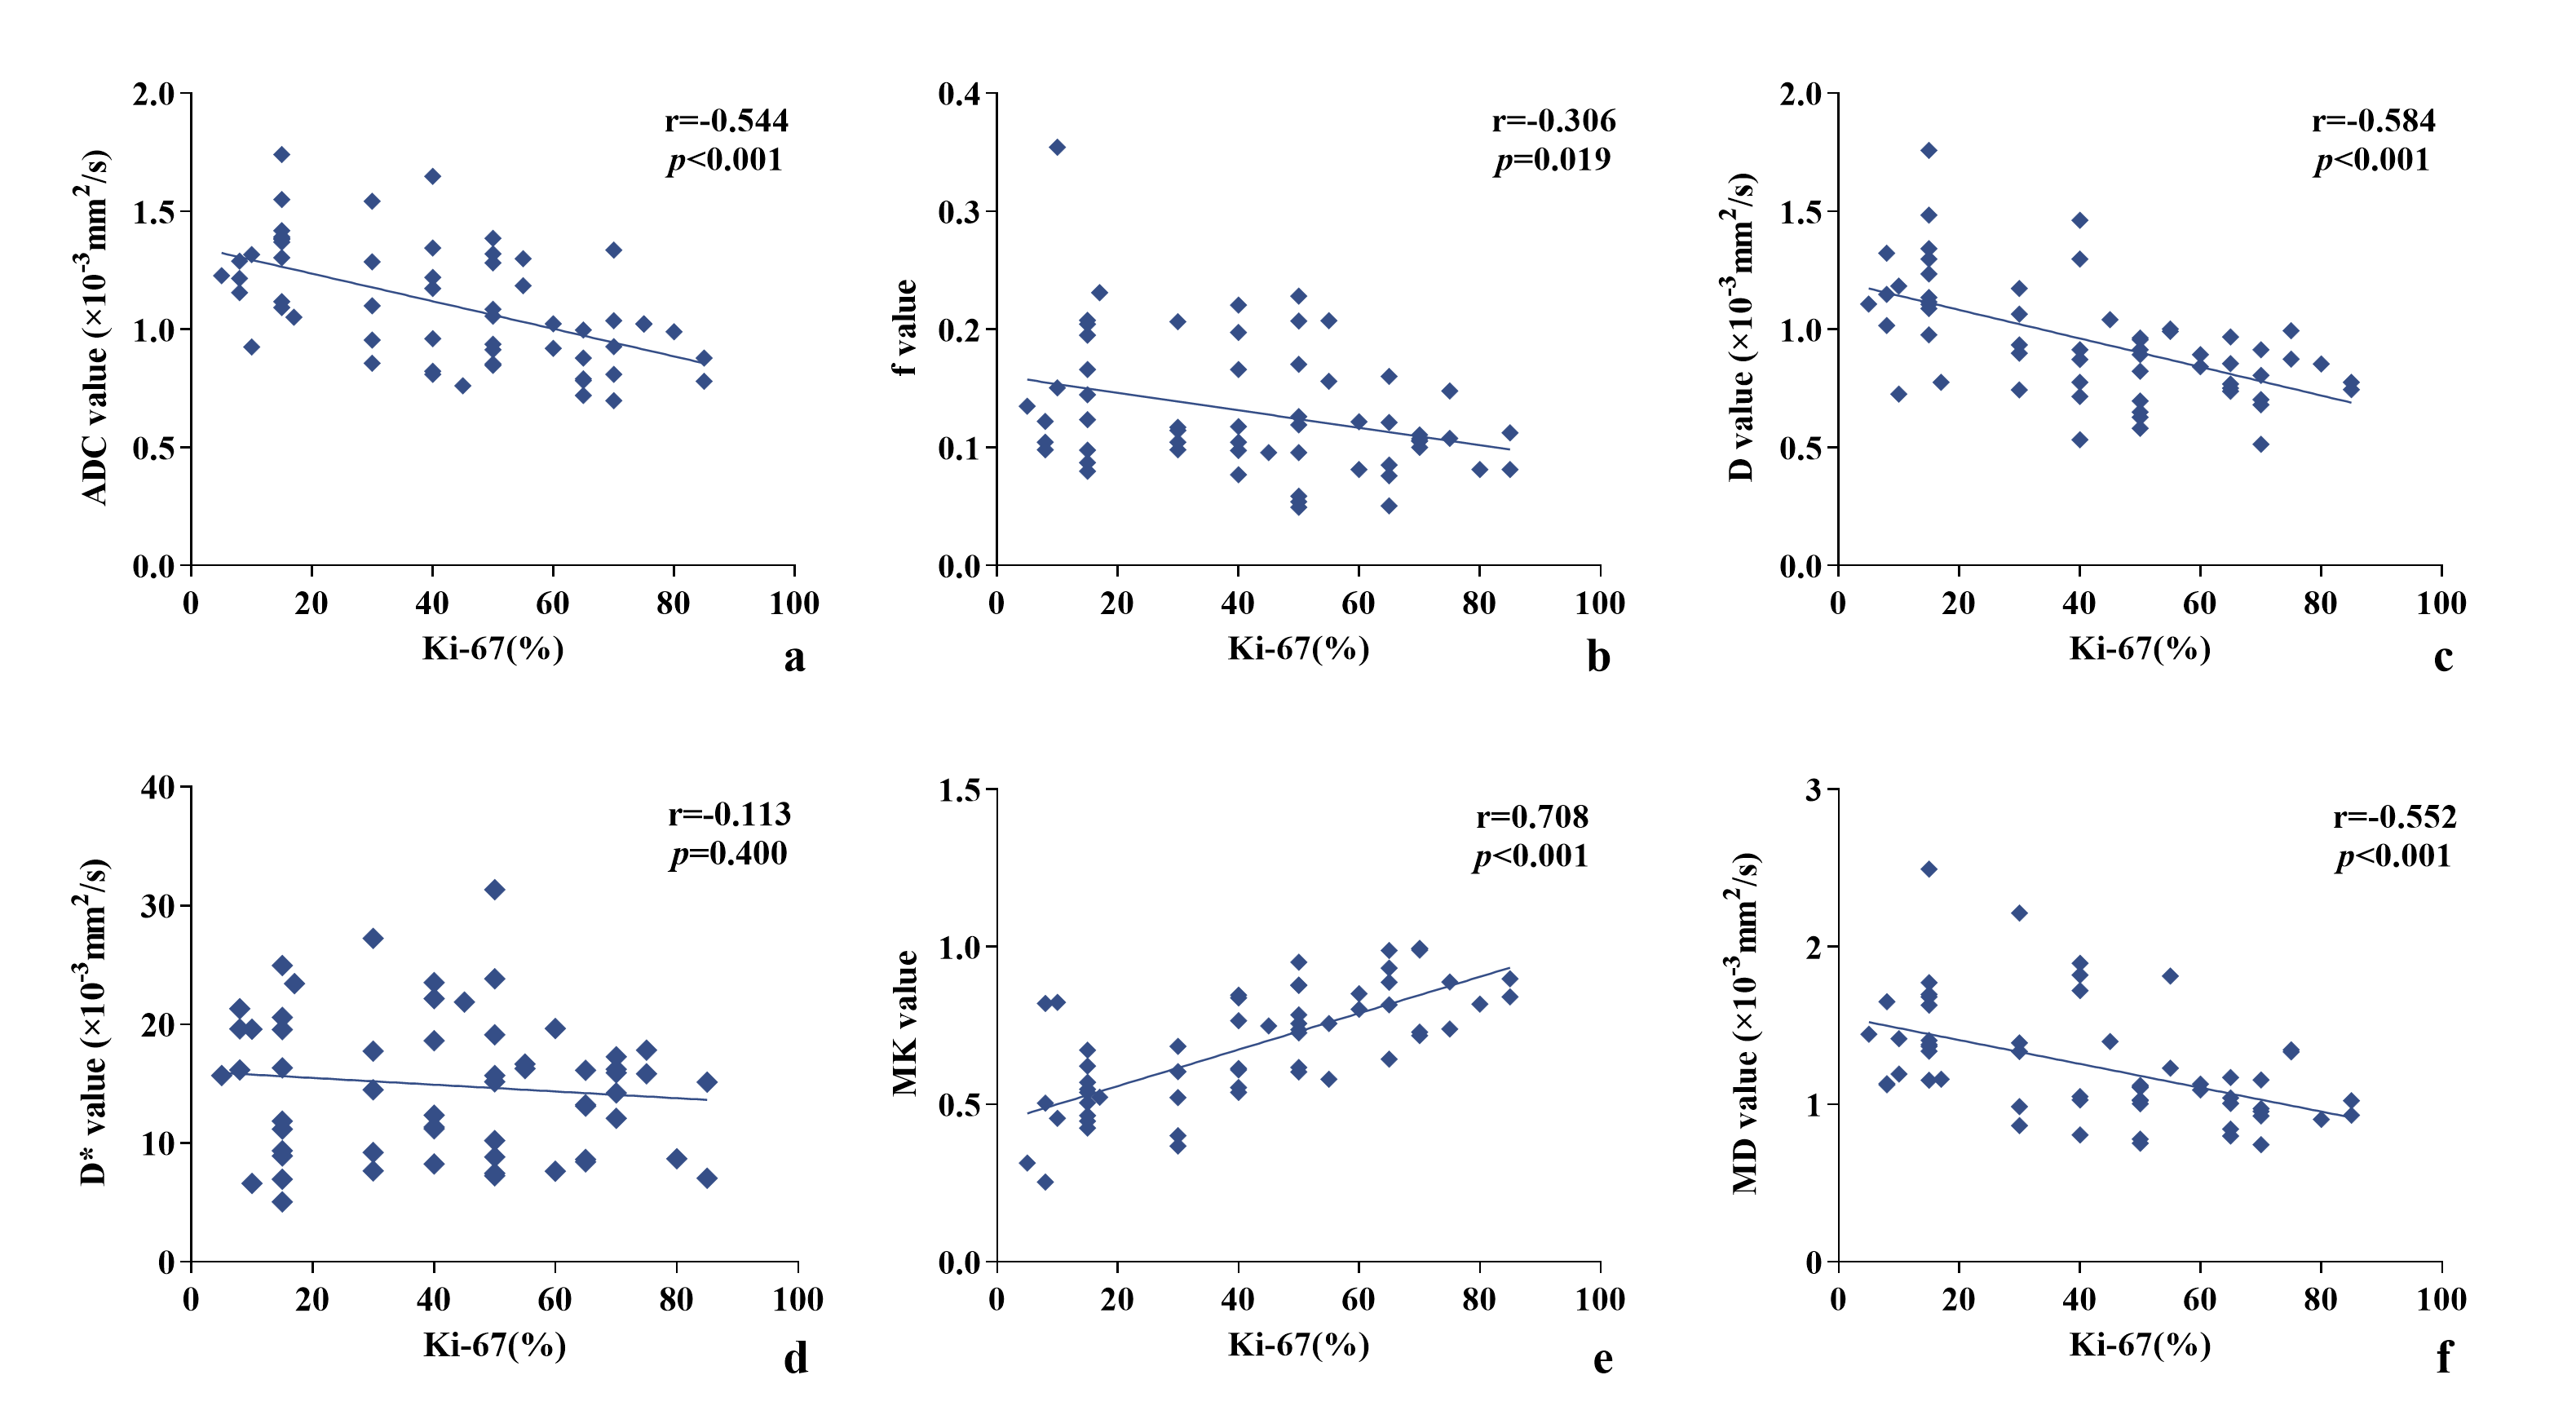
Figure 4. Scatterplot of the Spearman correlation between each diffusion parameter and Ki-67 LI.
DOI: https://doi.org/10.58530/2023/1501