1498
The effect of cardiac gating on the repeatability of quantitative renal diffusion MRI1Department of Radiology, NYU Langone Health, New York, NY, United States, 2Siemens Medical Solutions USA Inc., New York, NY, United States, 3Siemens Healthcare GmbH, Erlangen, Germany
Synopsis
Keywords: Kidney, Diffusion/other diffusion imaging techniques
The effect of cardiac gating on quantitative diffusion weighted magnetic resonance imaging of the kidney was investigated using an advanced cardiac triggered diffusion-weighted imaging sequence which allows the acquisition and estimation of diffusion tensor imaging and intra-voxel incoherent motion parameters. Cardiac gating significantly influences the repeatability of IVIM parameters that reflect flow of blood and fluids in the kidney and allow interpretations of renal function.Introduction
Quantitative diffusion-weighted imaging (DWI) has applications in research settings, with increasing potential for translation to eventual routine clinical deployment, as a tool that provides biomarkers of kidney function and microstructure. The intravoxel incoherent motion (IVIM) model probes renal vascular and tubular flow and separates it from diffusion in tissue 1. Diffusion tensor imaging (DTI) probes microstructural anisotropy and might enable the estimation of tubule diameters in vivo 2,3. Recently, IVIM and DTI have been combined in a method titled renal flow and microstructure anisotropy (REFMAP) 4. Echo planar imaging, the common readout for renal DWI, is rapid and insensitive to multishot phase errors but prone to artifacts (kidney motion, field inhomogeneity distortions, and eddy current distortion 5) that may reduce repeatability. Additionally, since vasculature is quite substantial in the kidneys, cardiac cycle pulsatility on DWI biomarkers has received significant attention 3,6-10. Most of these studies find dependences of IVIM parameters fp and D* on phases of the cardiac cycle. This study was performed to investigate the effect of this pulsatility on repeatability, by collecting DWI acquisitions twice in the systolic and twice at the diastolic cardiac phases.Methods
In this HIPAA-compliant and IRB-approved prospective study, 4 volunteers (2M, ages 32, 34, 38, and 61) provided written informed consent and had abdominal imaging performed on a 3 T MRI system (MAGNETOM Prisma; Siemens Healthcare, Erlangen, Germany) in supine position with posterior spine array and anterior body array RF coils and chest leads for ECG gating. Coronal oblique T2-weighted single-shot fast spin echo/half-Fourier acquisition single-shot turbo spin echo (SSFSE/HASTE) images were collected for anatomical reference. Sagittal phase-contrast (PC) MRI images through the left renal artery were collected at multiple cardiac phases to estimate systolic, and diastolic phases for kidney tissue. With a research application DWI sequence with dynamic field correction, cardiac triggered oblique coronal DWI (TR/TE 2800/81 ms, matrix 192/192/1, resolution 2.2/2.2/5 mm) were collected at 10 b-values between 0-800 s/mm2 and 12 directions. This DWI set was repeated four times in the same imaging session without repositioning, twice gated at the systolic phase and twice at the diastolic phase of the cardiac cycle. To correct for field inhomogeneity at least 16 forward (i.e. right-to-left) and reverse (i.e. left-to-right) phase-encoding b=0 images were acquired. All diffusion images were registered to a forward b=0 image taken as reference using the freely available software package FireVoxel, build 380, https://firevoxel.org/. The forward and reverse b=0 images were inputted to FSL TOPUP 11 to perform distortion correction on all DWI sets. MPPCA 12 was used to denoise the DTI sets.A combined IVIM-DTI analysis algorithm was applied to process the four denoised DWI sets separately and extract IVIM (fp, D*, D*∥, and D*⊥) and DTI (FA, MD, D∥, and D⊥) parameters. The repeatability of these parameters in the cortex and medulla was investigated at the systolic and diastolic phases, separately. Mean values of each parameter between systolic and diastolic phases were compared via mixed model analysis of variance, with side and cardiac phases as fixed classification factors and the subject as a random factor. Within each mixed model analysis, a likelihood ratio test (LRT) was used to compare the systolic and diastolic measurements in terms of within-subject variance. Finally, coefficients of variation (CoV) for repeatability were computed from the percentage ratio of within-subject standard deviation to the mean value for each parameter and phase. All statistical tests were conducted at the two-sided 5% significance level using SAS 9.4 software (SAS Institute, Cary, NC).
Results
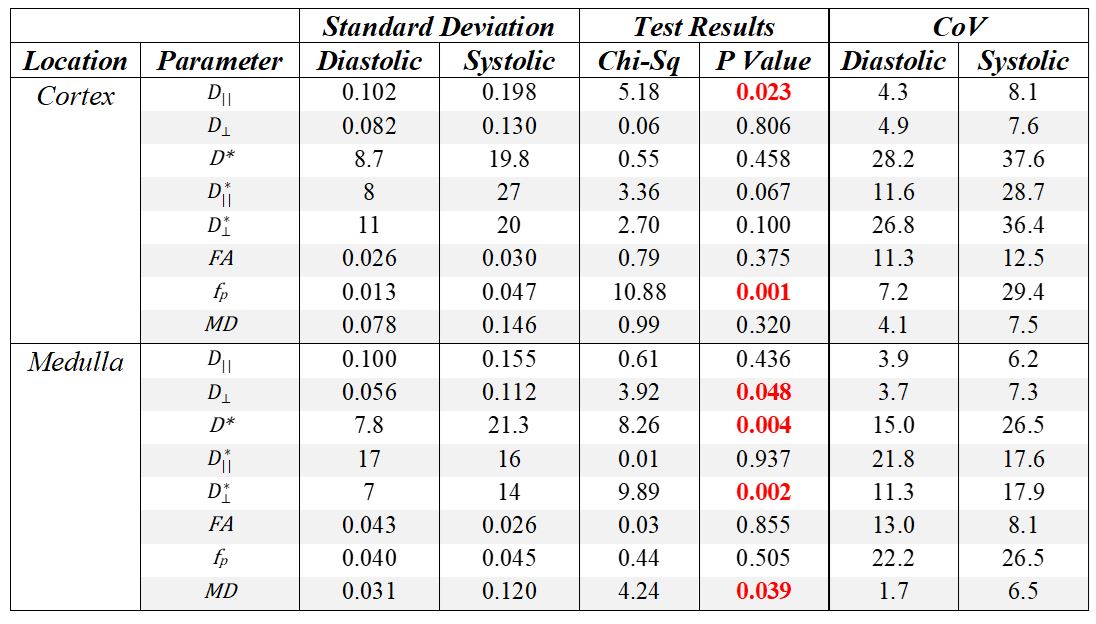
Figure 1 shows MD, FA, D*, and fp maps of the right kidney of a sample subject with systolic and diastolic gating. Figure 2 shows Bland-Altman plots for the parameters in this study, showing minimal bias and skewness for each parameter. Table 1 shows that the only parameters in this cohort that showed significant mean value differences between systole and diastole were the mean and directional values of pseudo-diffusion D* (Figure 3). Table 2 shows that pseudo-diffusion parameters fp in the cortex, (D*, D*⊥) in the medulla, and to a lesser extent DTI parameters D∥ in the cortex and (MD, D⊥) in the medulla, show significantly larger within-subject standard deviation in systole than in diastole.Discussion
The results indicate that renal IVIM parameters, especially those related to pseudo-diffusion, are sufficiently dependent on the cardiac phase of the acquisition to affect in-scanner repeatability. Systolic phase acquisitions have significantly reduced repeatability than diastolic for some parameters, likely due to slight variability in achieving peak systolic timing. This reduced repeatability must be considered in balance with the reduced sensitivity to perfusion exemplified by the differences in D*. More generally, these results suggest that efforts employing IVIM metrics for renal function characterization, in particular within longitudinal studies involving multiple visits, may benefit from cardiac gating for maximum repeatability.Acknowledgements
Funding support is acknowledged from the National Institute of Health (NIH).References
1 Sigmund, E. E. et al. Intravoxel incoherent motion and diffusion-tensor imaging in renal tissue under hydration and furosemide flow challenges. Radiology 263, 758-769, doi:10.1148/radiol.12111327 (2012). 2 Morozov, D. et al. Mapping kidney tubule diameter ex vivo by diffusion MRI. Am J Physiol Renal Physiol 320, F934-F946, doi:10.1152/ajprenal.00369.2020 (2021).
3 Sigmund, E. E. et al. Cardiac phase and flow compensation effects on REnal Flow and Microstructure AnisotroPy (REFMAP) MRI in healthy human kidney. J Magn Reson, Imaging, doi:10.1002/jmri.2817 (2022).
4 Liu, A. L. et al. REnal Flow and Microstructure AnisotroPy (REFMAP) MRI in Normal and Peritumoral Renal Tissue. J Magn Reson Imaging 48, 188-197, doi:10.1002/jmri.25940 (2018).
5 Pierpaoli, C. Artifacts in diffusion MRI. Diffusion MRI: theory, methods and applications, 303-318 (2010).
6 Lanzman, R. S. et al. Assessment of time-resolved renal diffusion parameters over the entire cardiac cycle. Magn Reson Imaging 55, 1-6, doi:10.1016/j.mri.2018.09.009 (2019).
7 Wittsack, H. J. et al. Temporally resolved electrocardiogram-triggered diffusion-weighted imaging of the human kidney: correlation between intravoxel incoherent motion parameters and renal blood flow at different time points of the cardiac cycle. Invest Radiol 47, 226-230, doi:10.1097/RLI.0b013e3182396410 (2012).
8 Heusch, P. et al. Impact of blood flow on diffusion coefficients of the human kidney: a time-resolved ECG-triggered diffusion-tensor imaging (DTI) study at 3T. Journal of magnetic resonance imaging : JMRI 37, 233-236, doi:10.1002/jmri.23751 (2013).
9 Ito, K. et al. Alterations in apparent diffusion coefficient values of the kidney during the cardiac cycle: Evaluation with ECG-triggered diffusion-weighted MR imaging. Magn Reson Imaging 52, 1-8, doi:10.1016/j.mri.2018.05.004 (2018).
Figures