1497
Detecting cancer immunotherapy response in ccRCC patients from 1H MRS of plasma1Division of Cancer Imaging Research, The Russell H. Morgan Department of Radiology and Radiological Science, JOHNS HOPKINS UNIVERSITY, SCHOOL OF MEDICINE, BALTIMORE, MD, United States, 2F.M. Kirby Research Center for Functional Brain Imaging, Kennedy Krieger Institute, JOHNS HOPKINS UNIVERSITY, SCHOOL OF MEDICINE, Baltimore, MD, United States, 3Genitourinary Oncology, Sidney Kimmel Comprehensive Cancer Center, JOHNS HOPKINS UNIVERSITY, SCHOOL OF MEDICINE, Baltimore, MD, United States
Synopsis
Keywords: Cancer, Metabolism, Clear Cell Renal Cell Carcinoma , Cancer , 1H MR metabolomics
A minimally invasive, blood-based assay to predict and detect response to immune-checkpoint inhibitors (ICIs) would be of significant importance. 1H MRS of plasma samples provides a robust reproducible assay that require minimal sample preparation, and convenience of sample storage. Here we evaluated changes in plasma metabolites of clear cell renal cell carcinoma (ccRCC) patients receiving ICIs using 1H MRS. We identified a significant increase of acetate, formate, glutamine, glycine, myoinositol, and lactate following ICI that may reflect response.Material and Method: Plasma samples were obtained from 17 ccRCC patients undergoing ICIs (pembrolizumab/axitinib or ipilimumab/nivolumab). Paired samples were obtained before and at time points ranging from 1 month (n=3), 2 months (n=13) and 4 months (n=1) during the course of ICI. Approximately 250 μl of thawed plasma samples were diluted with 350 μl of D20 saline buffer. The Carr–Purcell–Meiboom–Gill (CPMG) pulse sequence with water suppression was used to acquire the 1D 1H MR spectra at 750 MHz. Experimental parameters were kept identical for all spectra with a spectral width of 20 ppm, 64 scans, receiver gain of 32, and a relaxation delay of 10s. Topspin 3.5 software was used spectral acquisition, processing, and quantification. Each metabolite was quantified from area under the peak normalized to a reference peak. Assignments of metabolites were based on chemical shift and splitting pattern of metabolites reported in the literature and Biological Magnetic Resonance Bank. Metaboanalyst software was used to analyze altered metabolic pathway based on significant changes in metabolites identified in the spectra1.
Result: Representative 1D 1H MR plasma spectra from a ccRCC patient obtained before and 2 months after ICI are presented in Figure 1. Metabolic heat maps displaying data from each patient presented in Figure 2 provide an overview of the metabolic changes identified post-treatment. Overall we detected a significant increase of acetate, formate, glutamine, glycine, myoinositol, and lactate. Based on the significantly altered metabolites, pathway analysis identified changes in glycine, serine and threonine metabolism, inositol phosphate metabolism and alanine, aspartate and glutamate metabolism. Changes in acetate and formate analyzed for individual patients are presented in Figure 3. Either acetate or formate increased following ICI with the exception of patient number 3, 5, and 16 that were identified to have poor outcome clinically.
Discussion: These preliminary data suggest that 1H MRS of plasma metabolites may assist in identifying response to ICI. In future studies we intend to integrate neural network analysis with 1H MRS to detect response to ICI. Changes in plasma metabolites may reflect response to ICI either from cancer cell metabolism2 being modified or changes in systemic metabolism.
Acknowledgements
Supported from NIH R35 CA209960 and the Emerson Collective is gratefully acknowledged.References
1. Pang, Z.; Chong, J.; Zhou, G.; de Lima Morais, D. A.; Chang, L.; Barrette, M.; Gauthier, C.; Jacques, P.; Li, S.; Xia, J., MetaboAnalyst 5.0: narrowing the gap between raw spectra and functional insights. Nucleic acids research 2021, 49 (W1), W388-w396.
2. Pacheco-Torres J, Penet MF, Mironchik Y, Krishnamachary B, Bhujwalla ZM. The PD-L1 metabolic interactome intersects with choline metabolism and inflammation. Cancer Metab. 2021 Feb 19;9(1):10.
Figures
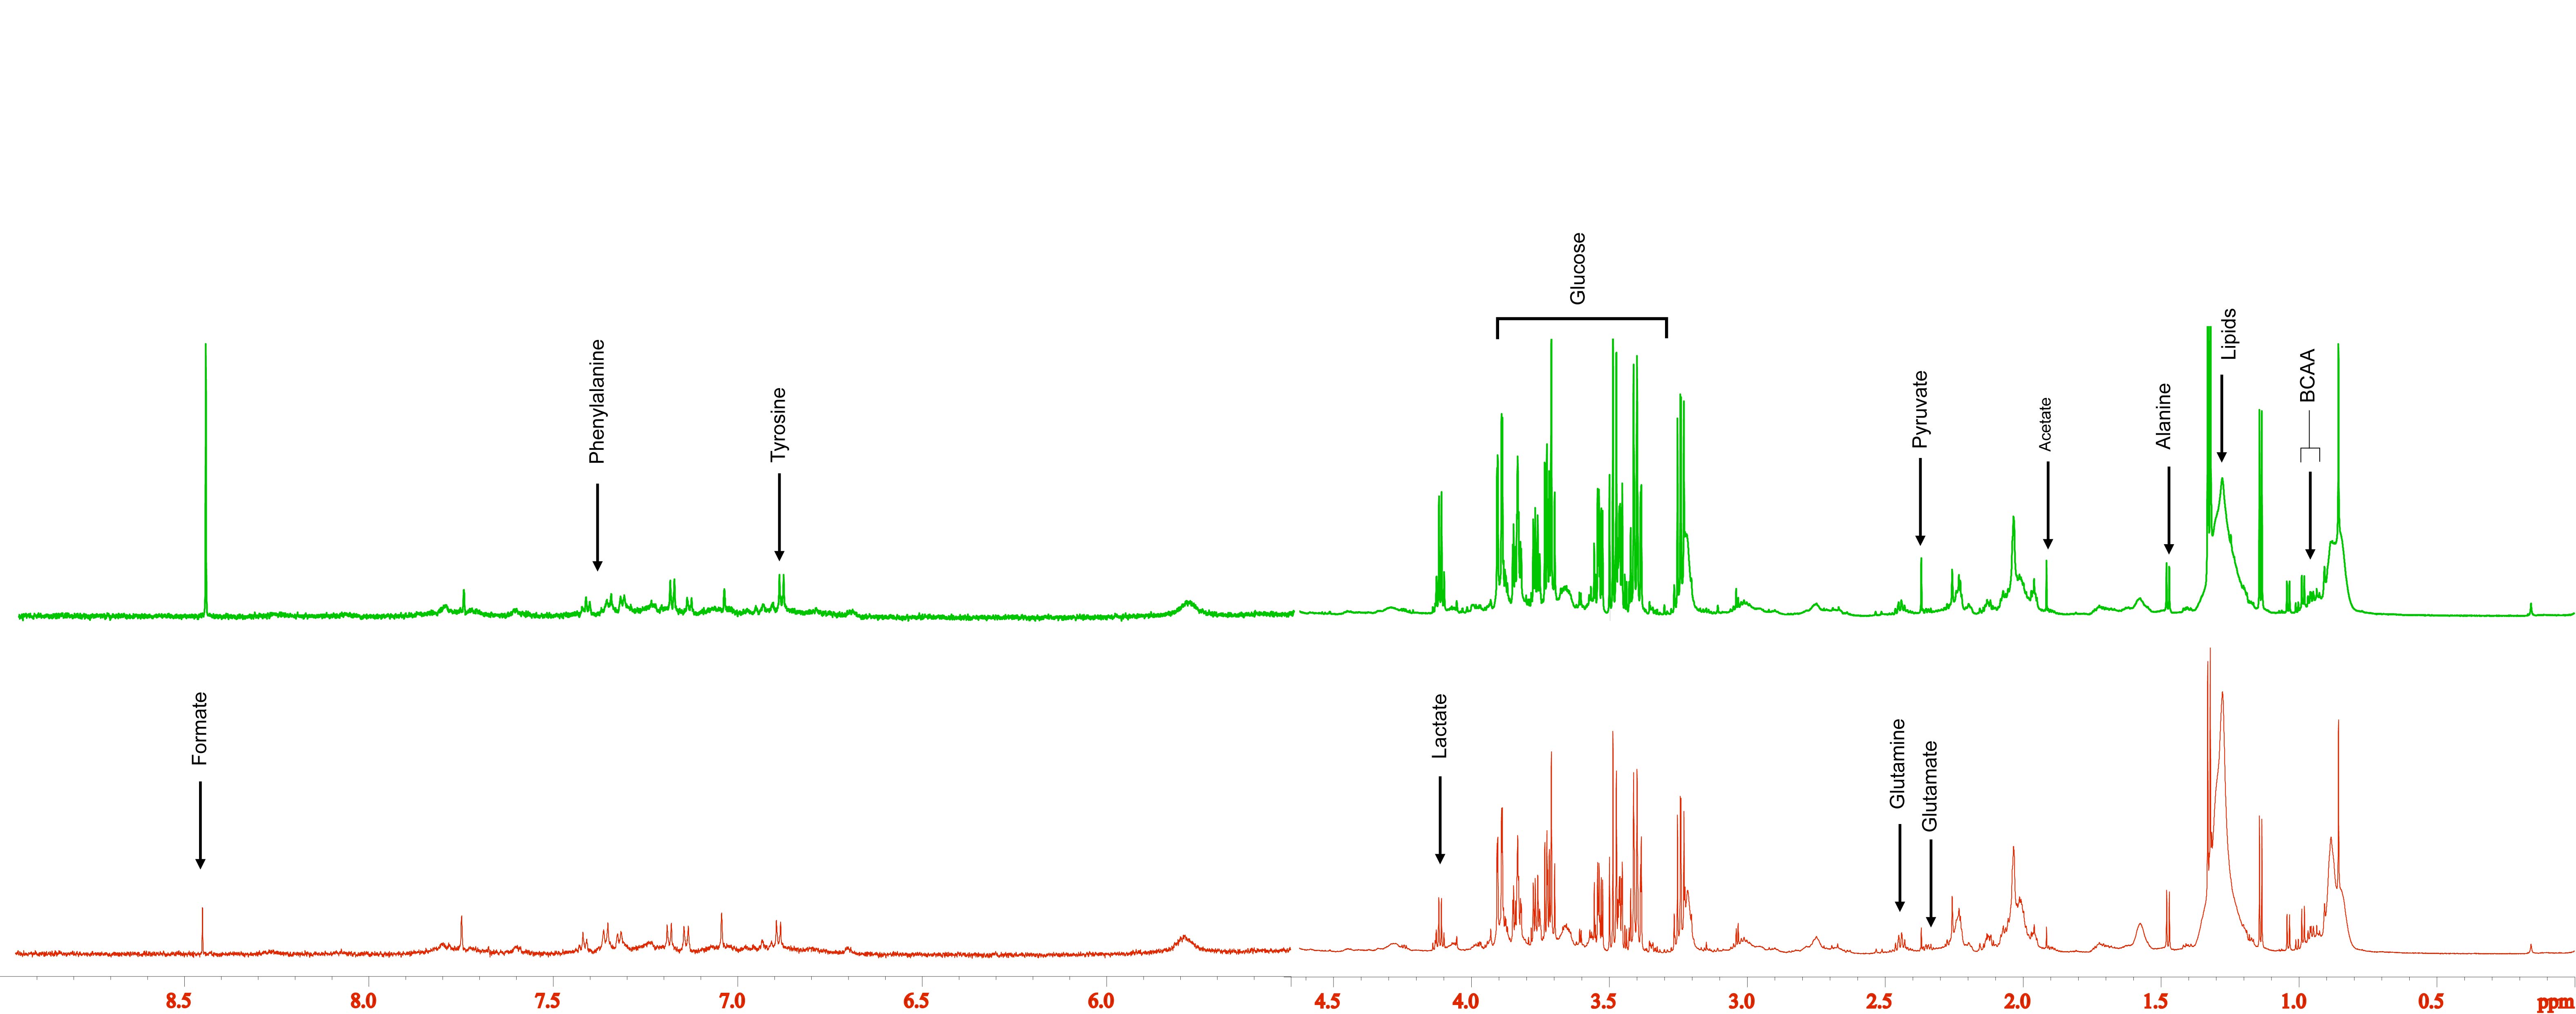
Figure 1. Representative 1H MR spectra of plasma samples obtained from Patient #14 before and at 2 months after CIT. An increase of formate and acetate is clearly evident in the spectra.

Figure 2. Quantitative analysis of metabolites from each patient are presented in the metabolic heat maps. * represents p < 0.05 between pre-and post-treatment plasma samples.
