1495
Texture Analysis of Diffusion Kurtosis Imaging for Predicting Early Recurrence of Hepatocellular Carcinoma After Hepatectomy
Yue Wang1, Ying Zhao1, and Ailian Liu1
1the First Affiliated Hospital of Dalian Medical University, Dalian, China
1the First Affiliated Hospital of Dalian Medical University, Dalian, China
Synopsis
Keywords: Cancer, fMRI
The global incidence and mortality of hepatocellular carcinoma (HCC) are high [1]. Although radical resection of HCC is the most effective treatment, the postoperative recurrence rate is high. Diffusion kurtosis imaging (DKI) is based on the non-Gaussian diffusion motion of water molecules, which can quantitatively reflect the characteristics of lesions from the perspective of diffusion and heterogeneity[2]. Texture analysis provides information about tissue complexity and heterogeneity based on mathematical methods. This study showed that DKI-based entire-tumor texture analysis could assist in prediction of the early recurrence of HCC patients after hepatectomy, which was beneficial to improve the prognosis.Purpose
To explore the value of texture analysis of DKI for predicting early recurrence of HCC after hepatectomy.Methods and Materials
We retrospectively collected 36 HCC patients who underwent liver MRI examination in our hospital. They were divided into the early recurrence (ER) group (22 cases) and non-early recurrence (NER) group (14 cases) according to two years postoperative follow-up. The DKI images were obtained and reconstructed to fractional anisotropy (FA)、mean diffusion coefficient (MD) and mean kurtosis coefficient (MK) maps using the Functool software (GE Healthcare) at Advantage Workstation (version AW 4.6, GE Medical System). The volume of interests (VOIs) covering the entire tumor were manually drawn slice by slice independently by two radiologists with 2 and 5 years of experience in abdominal imaging diagnosis using ITK-SNAP software (version 2.2.0, www.itksnap.org)(Figure 1). Texture parameters of FA, MD, MK maps were extracted using AK software, including mean, median, energy, entropy, kurtosis, maximum, minimue, skewness, uniformity, etc. The intraclass correlation coefficient (ICC) of histogram parameters was used for the inter-observer agreement. Continuous variables were analyzed using the independent-samples t-test or the Mann Whitney U test according to the normality of data distribution. Logistic regression and receiver operating characteristic (ROC) curve analyses were performed to evaluate the diagnostic efficiency of single and combined parameters.Results
The data consistency between the two observers was good (ICC value > 0.75). The energy, entropy and kurtosis of FA signal intensity and the energy and kurtosis of MK signal intensity of ER group were higher than those of NER group (P < 0.05). The minimum and uniformity of ER group was lower than that of NER group (P < 0.05). There was no statistical difference of the remaning parameters between the two groups (P > 0.05)(Table 1). The minimum, energy and entropy of FA signal intensity and energy and kurtosis of MK signal intensity performed the best diagnostic efficiency, with the area under curves (AUCs) of 0.766, 0.744, 0.737, 0.737 and 0.750, respectively(Table 2, Figure 2). The AUC of combined parameter was 0.873, which was higher than the single texture parameters.Discussion
DKI reflects tissue structure specifically in cellular complexity, the integrity of the cellular membrane, and the extracellular space changes. Entropy reflects textural irregularity related to tissue heterogeneity; kurtosis and skewness describe the distribution pattern of parameters; minimum, maximum, and variance represent the gray-level intensity within the VOI [3]. After texture features were combined with DKI functional maps, the texture parameters could specifically reflect heterogeneity in terms of cellular structure and extracellular microenvironment. Thus, our findings indicated that tumor heterogeneity of tumor cell and microenvironment was significantly different between ER and NER group, possibly because the tumors in ER group might contain tightly packed cells and restricted extracellular space with a more homogenous structure than those in NER goup. Therefore, the energy, entropy and kurtosis of FA signal intensity and the energy and kurtosis of MK signal intensity of ER group were higher than those of NER group (P < 0.05). The minimum and uniformity of ER group was lower than that of NER group (P < 0.05).Conclusions
DKI texture analysis could effectively predict the early recurrence of HCC patients after hepatectomy, which is beneficial to the early formulation of clinical decision and the selection of the best individualized treatment.Acknowledgements
None.References
1.Sung H, Ferlay J, Siegel RL, Laversanne M, Soerjomataram I, Jemal A, Bray F. Global Cancer Statistics 2020: GLOBOCAN Estimates of Incidence and Mortality Worldwide for 36 Cancers in 185 Countries. CA Cancer J Clin. 2021 May;71(3):209-249. doi: 10.3322/caac.21660. Epub 2021 Feb 4. PMID: 33538338.2.Zhu Q, Xu Q, Dou W, Zhu W, Wu J, Chen W, Ye J. Diffusion kurtosis imaging features of renal cell carcinoma: a preliminary study. Br J Radiol. 2021 Jun 1;94(1122):20201374. doi: 10.1259/bjr.20201374. Epub 2021 May 14. PMID: 33989037; PMCID: PMC8173694.3.Dai H, Zhao C, Xiong Y, He Q, Su W, Li J, Yang Y, Lin R, Xiang S, Shao J. Evaluation of contrast-induced acute kidney injury using IVIM and DKI MRI in a rat model of diabetic nephropathy. Insights Imaging. 2022 Jun 29;13(1):110. doi: 10.1186/s13244-022-01249-w. PMID: 35767196; PMCID: PMC9243200.Figures
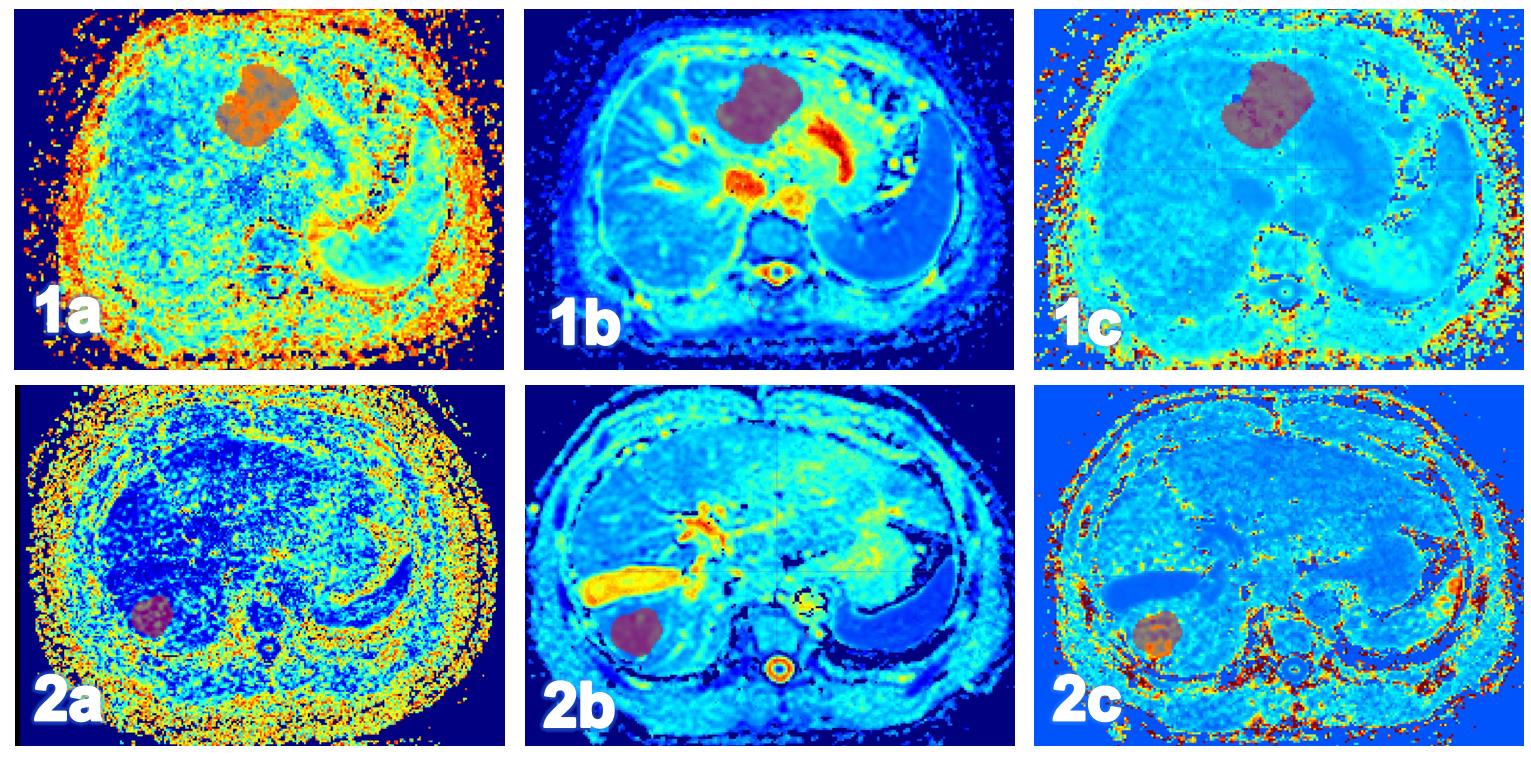
Figure 1.A 52-year-old male with HCC in the right lobe of the liver, early postoperative recurrence group. Figure 1a-1c showed the ROI of the tumor on FA, MD and MK maps, respectively.A 62-year-old female with HCC in the right lobe of the liver, non-postoperative early recurrence group. Figure 2a-2c showed the ROI of the tumor on FA, MD and MK maps, respectively.
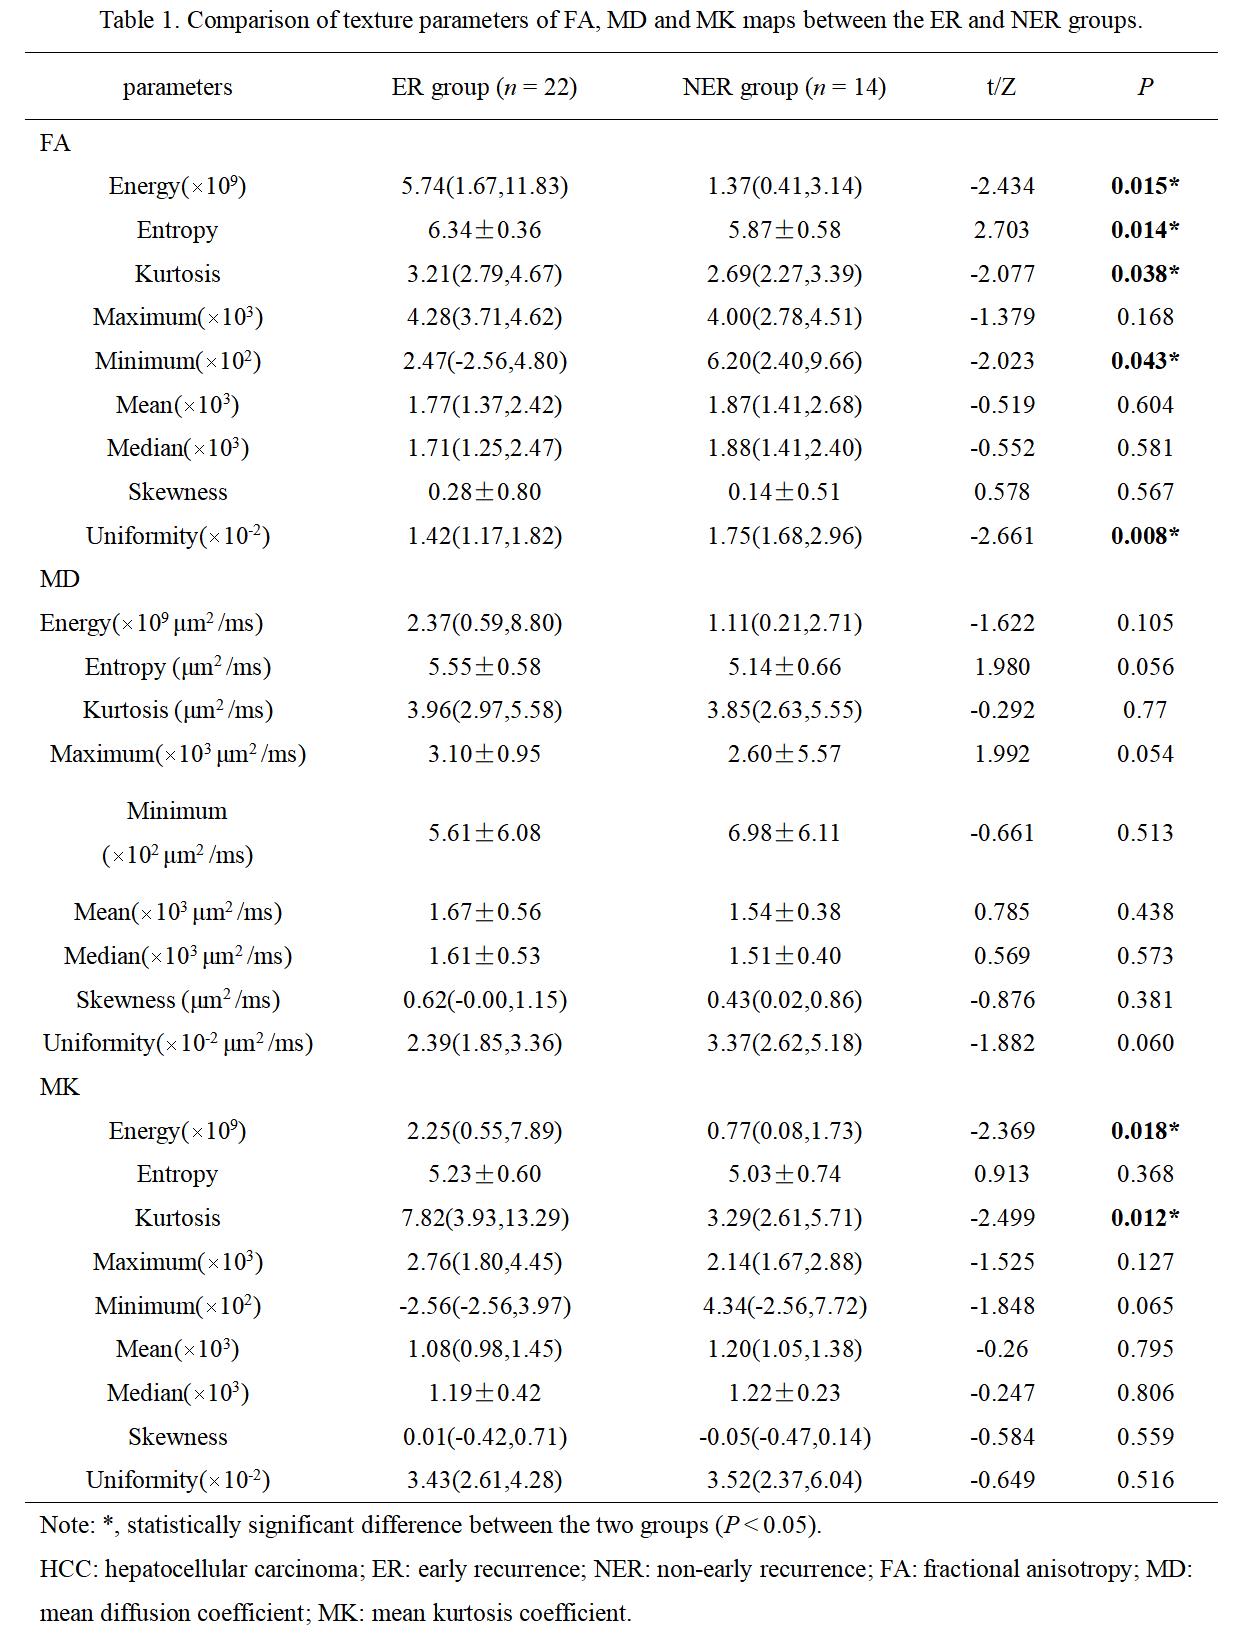
Table 1. Comparison of texture parameters of FA, MD and MK maps between the ER and NER groups.
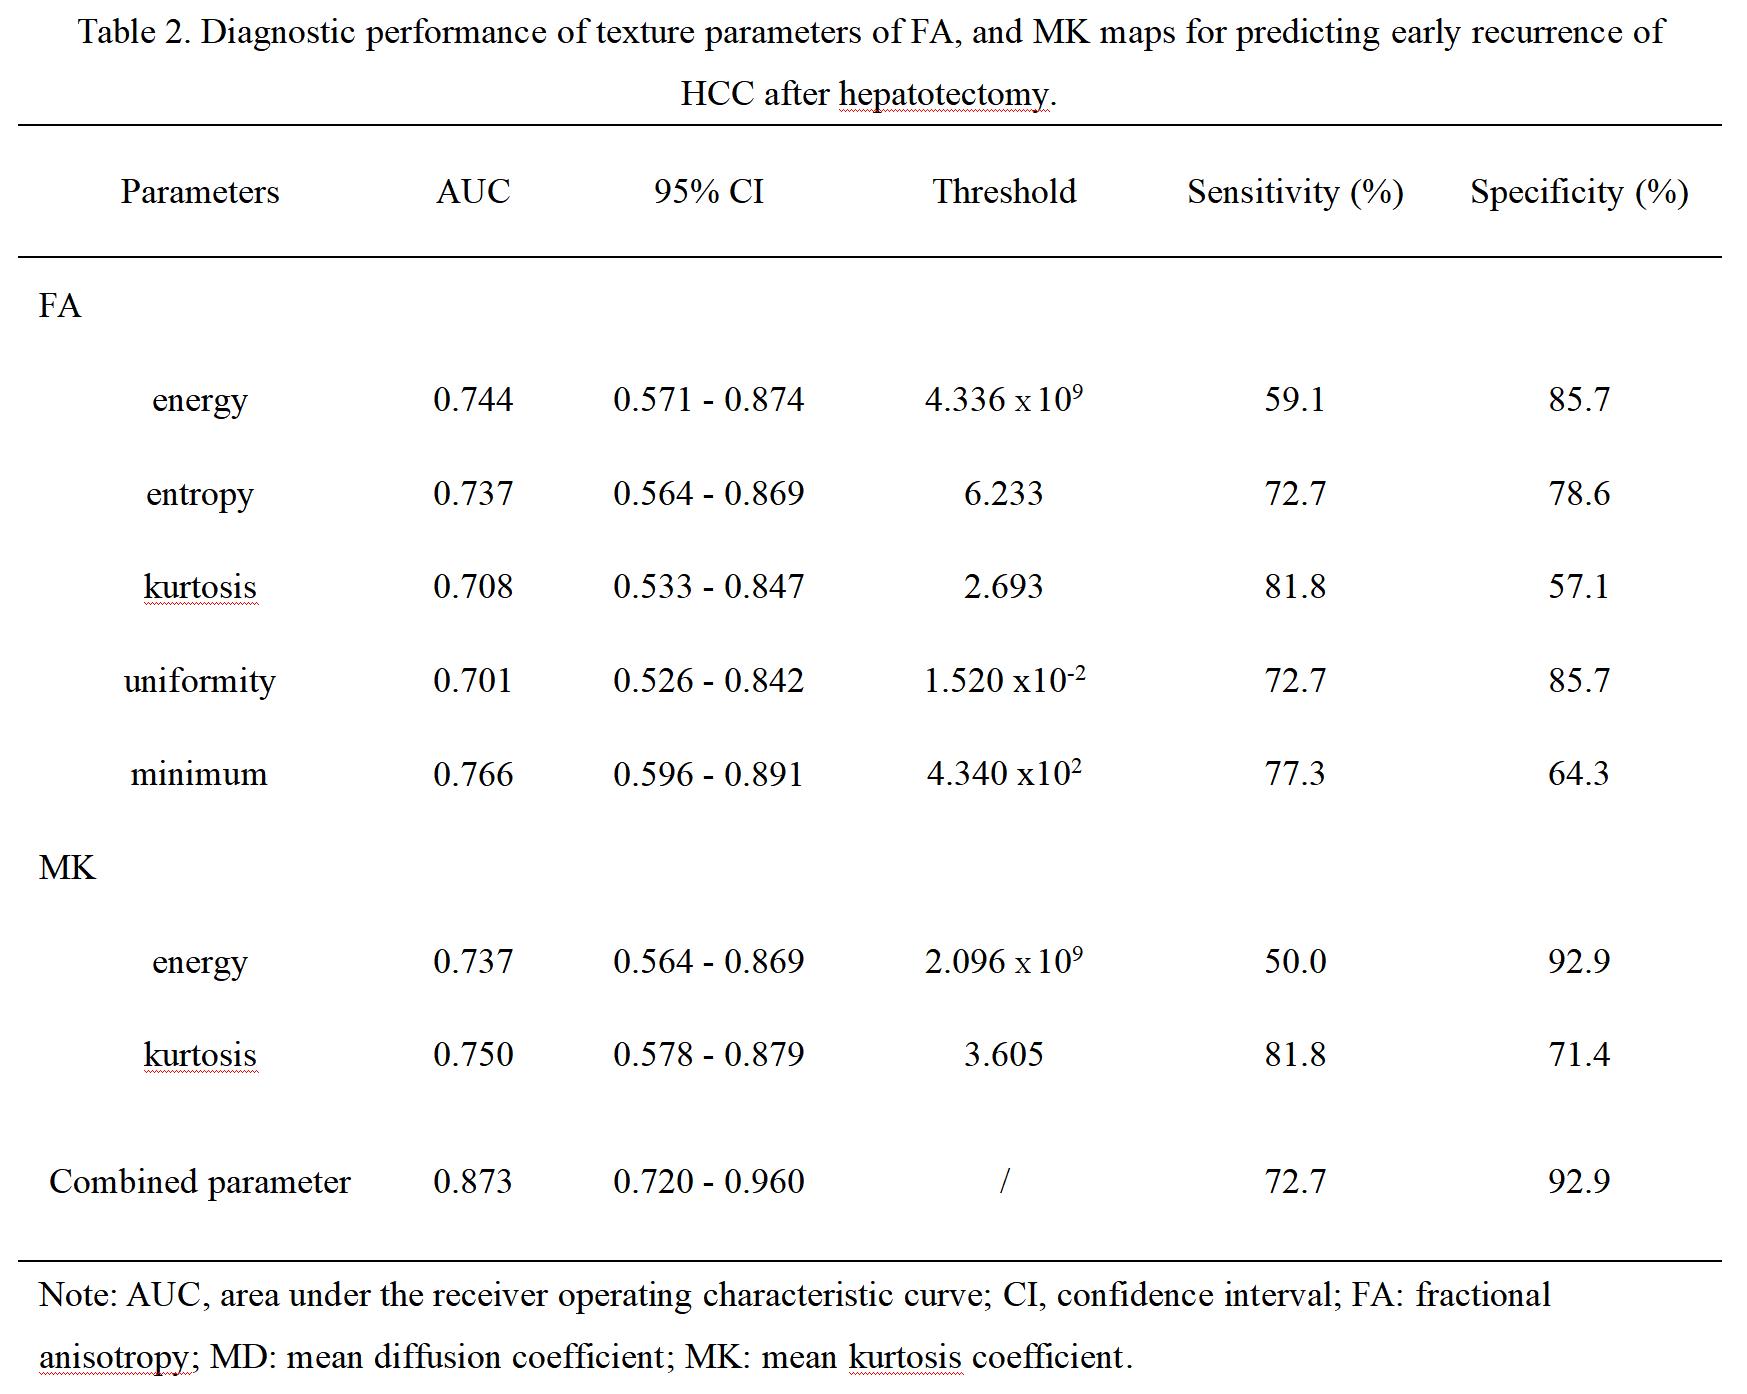
Table 2. Diagnostic performance of texture parameters of FA, and MK maps for predicting early recurrence of HCC after hepatotectomy.
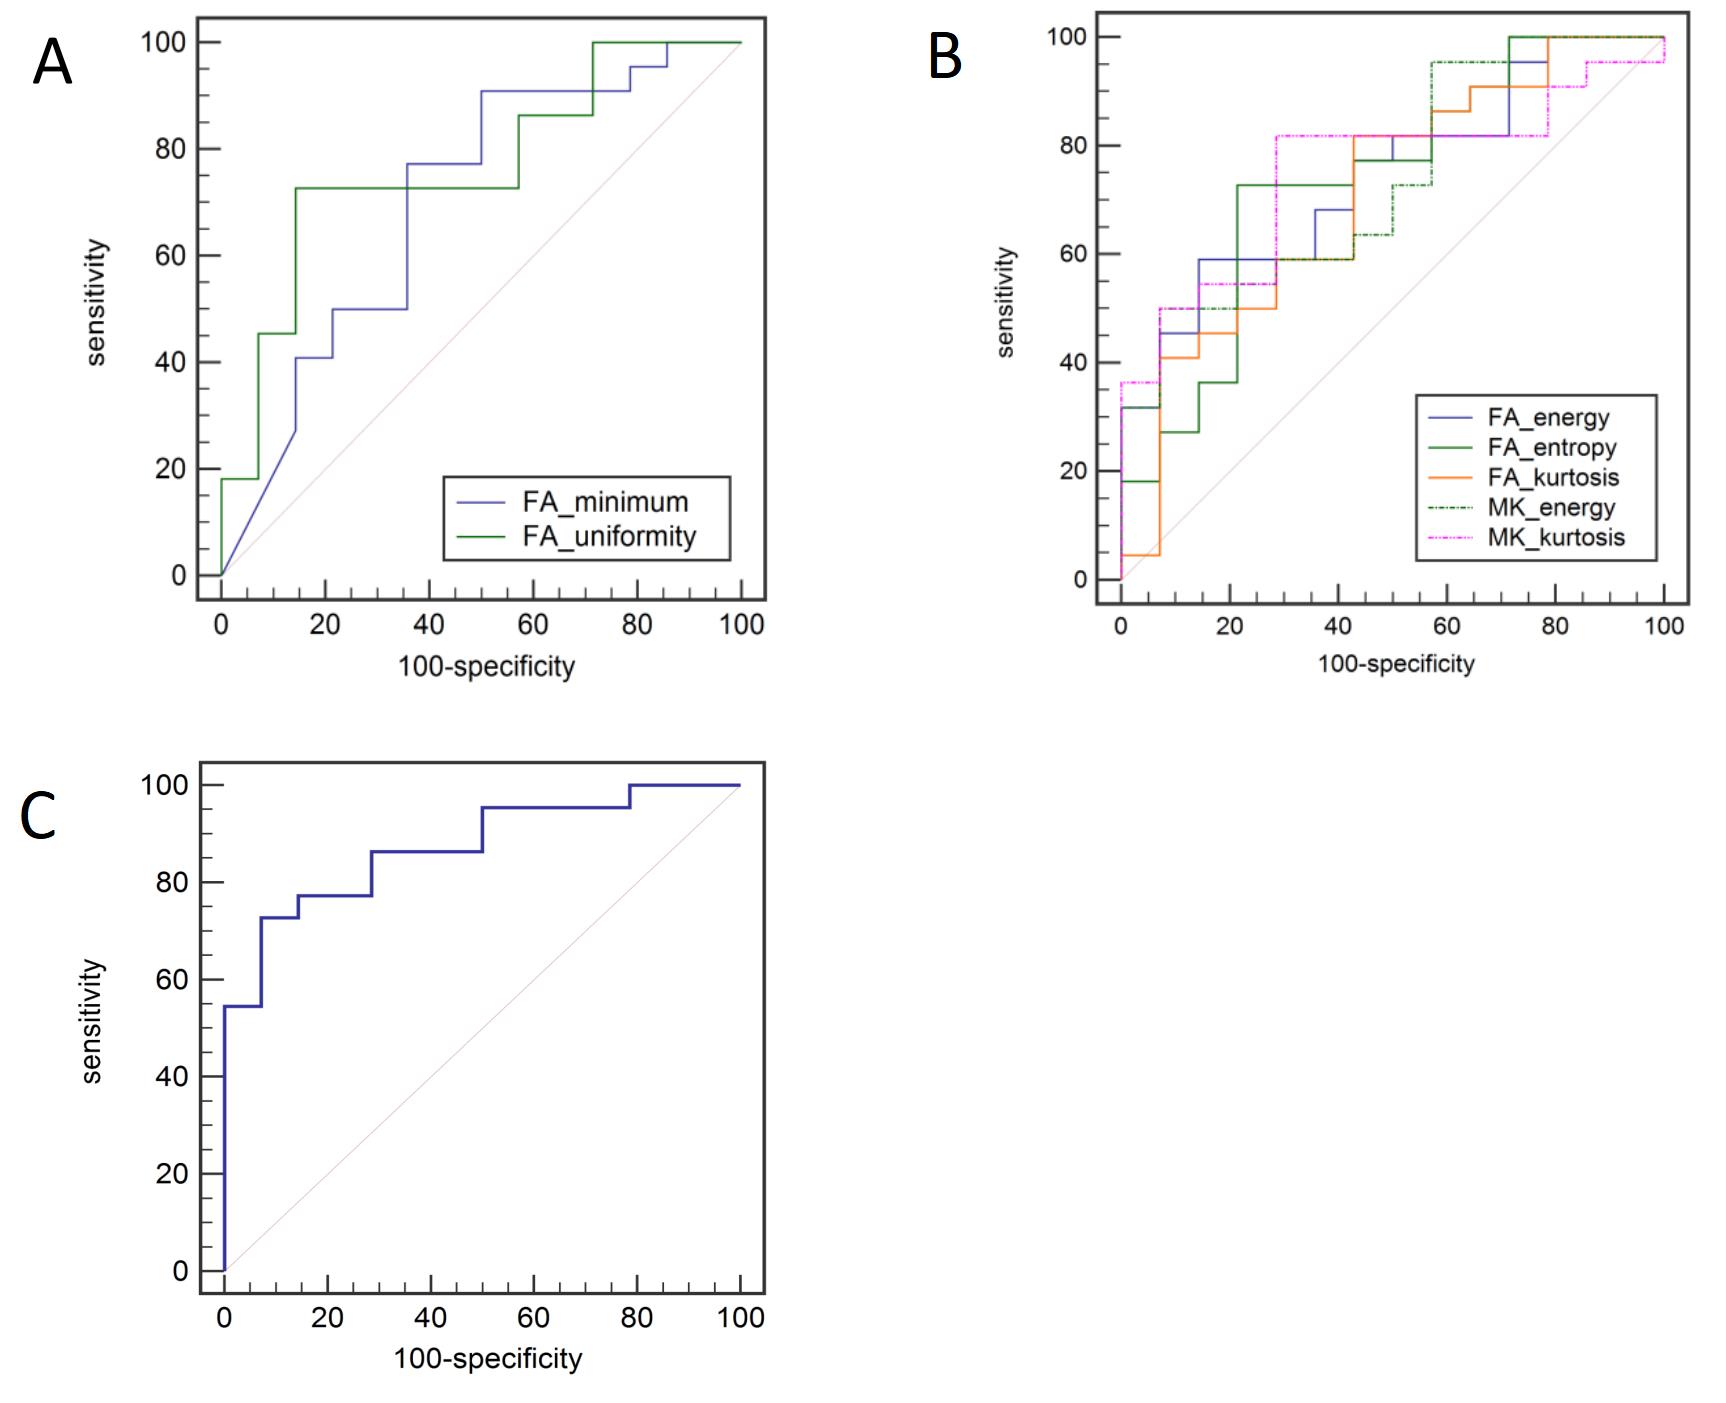
Figure 2. A. The receiver operating characteristics curves of FA_minimun and FA_uniformity for predicting early recurrence of HCC after hepatotectomy; B. The receiver operating characteristics curves of FA_energy, FA_entropy, FA_kurtosis, MK_energy and MK_kurtosis for predicting early recurrence of HCC after hepatotectomy.C. The receiver operating characteristics curves of combined parameter for predicting early recurrence of HCC after hepatotectomy.
DOI: https://doi.org/10.58530/2023/1495