1490
Quantification of Acute and Chronic Fibrosis in Gynecologic and Prostate Cancer over the course of Radiotherapy1Radiation Oncology and Molecular Sciences, Johns Hopkins University School of Medicine, Washington, DC, United States, 2Radiology, Brigham and Women’s Hospital, Boston, MA, United States, 3Siemens Medical Solutions, Boston, MA, United States, 4MR Applications Predevelopment, Siemens Healthcare GmbH, Erlangen, Germany, 5Siemens Healthineers, Boston, MA, United States, 6Radiology, Stanford University, Stanford, CA, United States, 7Medicine (Cardiology), Johns Hopkins University School of Medicine, Baltimore, MD, United States
Synopsis
Keywords: Pelvis, Radiotherapy, acute and chronic fibrosis
We developed means to quantify the volume and voxel-wise fraction of acute (FA) and chronic fibrosis (FC) present during and following radiation therapy (RT), using non-contrast and contrast enhanced stack-of-spirals IR-UTE scans. Imaging was performed in gynecologic and prostate cancer patients at multiple time points in relation to RT (pre-RT, on-RT, post-RT, and post-3 months RT). This study provides mm-resolution quantitative information on fibrosis changes during the course of RT based on MRI. Increases in FA, followed by subsequent-time FC increases were observed in both prostate and gynecologic cancer patients.Introduction
Fibrosis formation occurs during and after radiation-therapy (RT). Small animal imaging with atomic force microscopy has shown that accumulation of diffuse fibrosis (FA) is accelerated at a higher radiation dose.1 It has also been shown that after a critical level of accumulation, there is a remodeling of fibrosis layers into densely packed structures, which can later transform into scar tissue (chronic fibrosis, FC).1At low fibrosis concentrations, diffuse collagen fibrils are surrounded by tightly-bound water-molecules, leading to short T1 and ultrashort (TE<0.5ms) T2* relaxation times, so they must be imaged using UTE (Ultrashort Echo Time) MRI methods.2 Conventional (TE>1ms) imaging can be used as fibrosis deposition continues, forming dense fibrosis (collagen layers thicken and compact) and mean distances to surrounding water-molecules are larger (T1 and T2* increase). Alternatively, the most sensitive imaging method for dense fibrosis is late gadolinium enhancement (LGE) because contrast perfusion into dense fibrosis regions becomes highly inhibited and extended in time.3 Chelated-Gadolinium is an extracellular agent not able to enter intact cell membranes and clearing from the blood pool after minutes. In tissue with damaged or dead cells, these kinetic effects are delayed and there is a higher accumulation of contrast due to ruptured cell membranes allowing Gd to passively diffuse into the cellular compartment.4 The LGE technique is the gold standard for the detection of scar across a spectrum of cardiac diseases.4
The processes of acute and chronic fibrosis accumulation during the course of RT can also affect residual live tumor cells if they are within or close to the fibrotic regions. This is because surrounding fibrotic tissues can reduce blood supply, influencing the directions of tumor and blood-vessel growth, leading to both increased tumor necrosis and the survival of tumor cells that have accommodated to more hypoxic environments. However, there are competing biological processes that result in the gradual removal of fibrosis by macrophages. As a result, quantifying the volume and intensity of acute (diffuse) fibrosis (FA) and chronic (dense) fibrosis (FC) during RT can be potentially relevant to RT outcome (tumor eradication). The objective of this work was to quantify FA and FC within the tumor of patients treated with pelvic-RT, using non-contrast and LGE IR-UTE, respectively.
Methods
Subjects: Four gynecologic cancer patients (GynCa) undergoing chemoRT and three prostate cancer patients (PCa) undergoing RT were included. Imaging in the GynCa was performed prior to RT, after 33Gy and after 45Gy. In 3/4 GynCa imaging was additionally acquired 3-months after brachytherapy.5 Gyn1 had complete response and Gyn2 had recurrence post-RT. PCa were imaged pre-RT, after 33Gy, and 78Gy EBRT.Image Acquisition: Imaging was performed in 1.5T MRIs (MAGNETOM, Siemens Healthcare, Erlangen, Germany) using the abdominal and spine arrays. FA: Research application stack-of-spirals double-echo (TE=50,2690µs), IR-UTE with TI=60ms.6 The 2nd-echo was subtracted from the 1st-echo to obtain the short TE-only image. FC: identical sequence, TI=200ms (nulling contrast-infused living soft-tissues), acquired 13-15 minutes following Gd administration.5 PI-RR and ESUR sequences (2D-T2w, 3D-fatsatT1w pre- and post-contrast, DWI, DCE) were acquired to detect remnant tumor (GTV).7,8
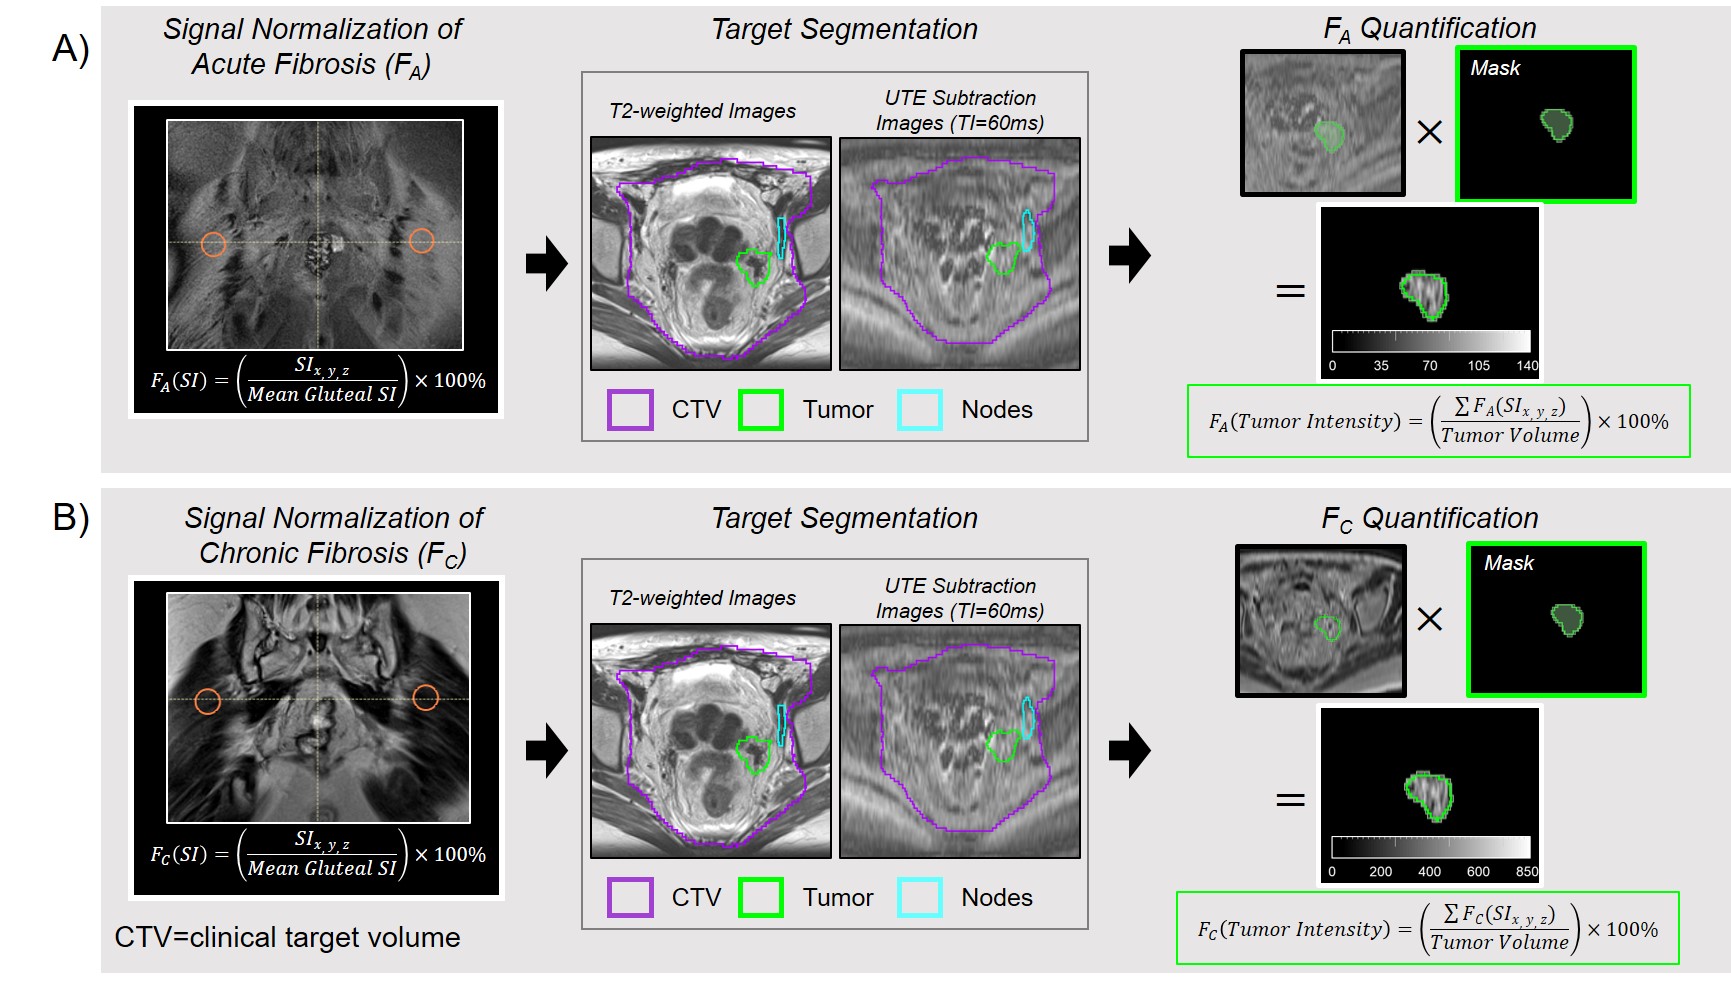
Image Analysis: For each time-point, remnant tumor was segmented by an experienced radiologist. The clinical-target-volume (CTV) (used for treatment planning) was contoured by an experienced radiation oncologist. FA and FC images were normalized to the gluteal-muscle mean signal-intensity (gluteal muscle has 7.5%±1.5% collagen9). The sum of all normalized intensities in the tumor volume was divided by the corresponding tumor volume for both FA (FA-tumor-intensity [%/cm3]) and FC (FC-tumor-intensity [%/cm3]) images (Figure 1).
Statistical Analysis: To determine reproducibility of the gluteal-muscle signal-intensity, eight ROIs were segmented and a coefficient-of-variation (COV) was calculated across all patients. The COV in FA-tumor-intensity and FC-tumor-intensity was calculated by expanding GTV-margins by 5mm, 6mm, and 10mm and re-computing FA-tumor-intensity and FC-tumor-intensity.
Results
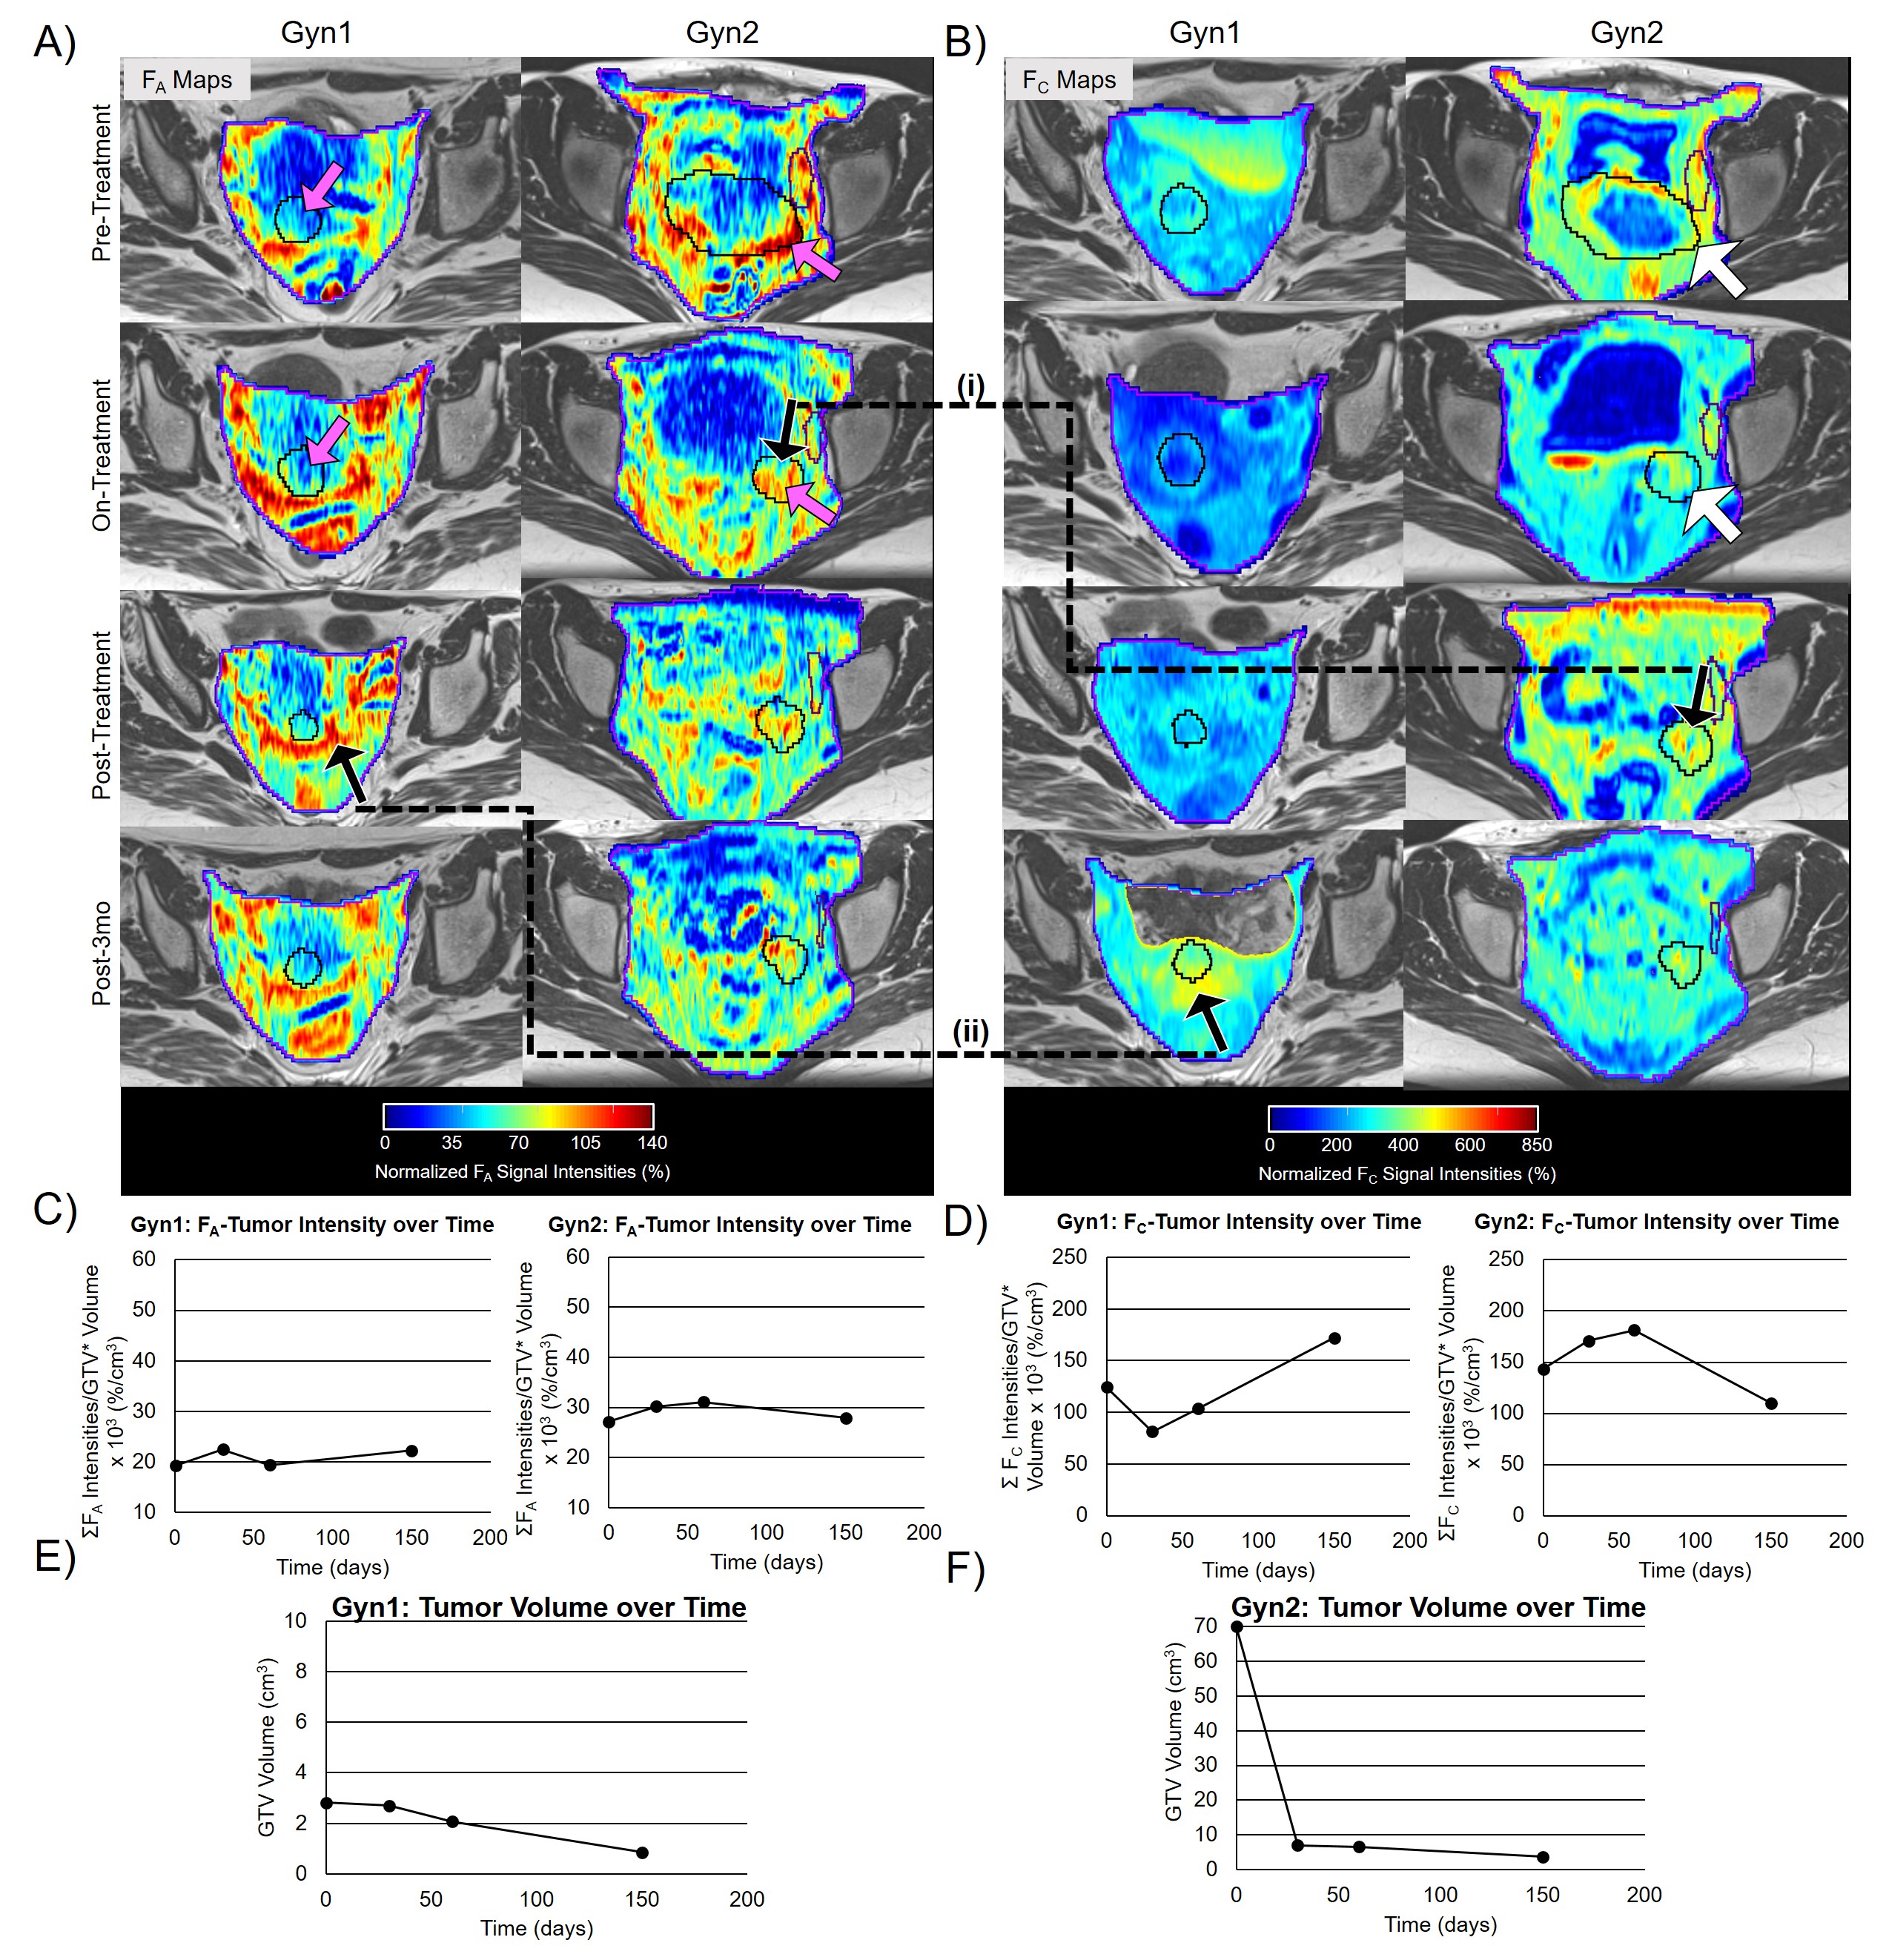
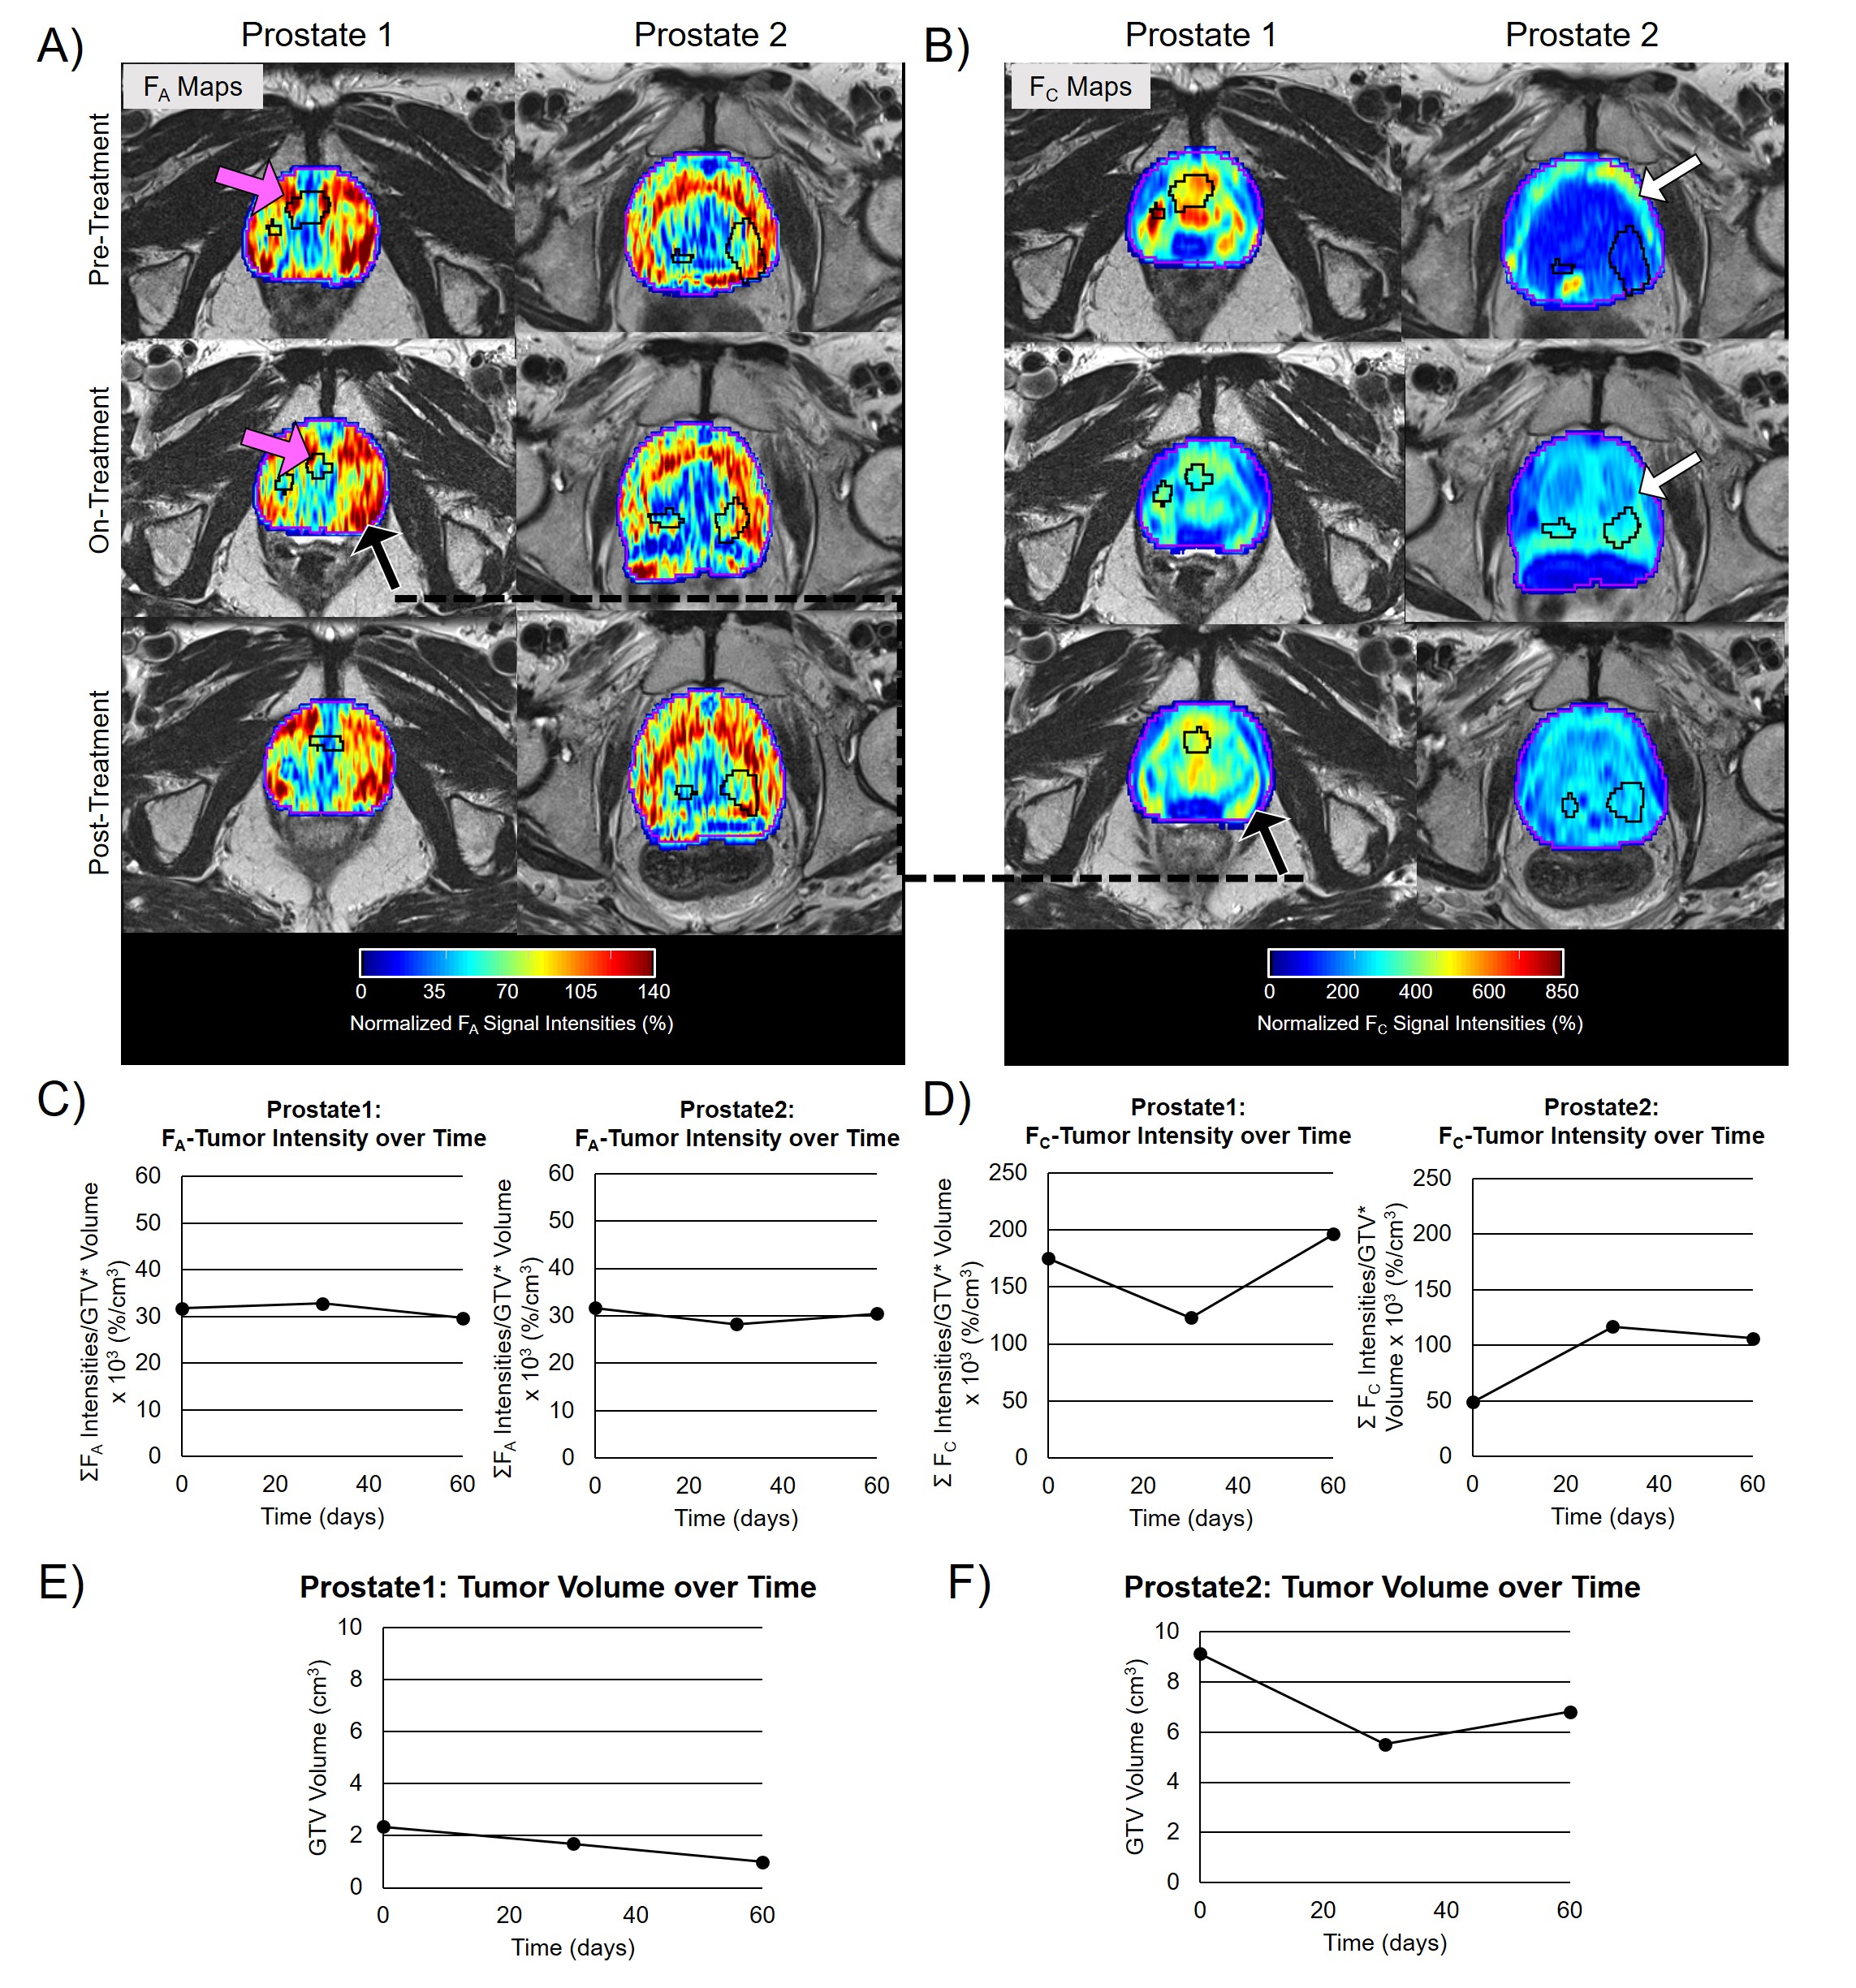
The COVs of the gluteal muscle signal-intensity were FA=4.6% and FC=9.6%. The COVs in the FA-tumor-intensity=9.4% and FC-tumor-intensity=8.6%. Figure 2 shows FA and FC maps over four time-points for two GynCa. Prior to RT, high intensity FA and FC were primarily located on the tumor periphery and during treatment were observed within the remnant tumor (2A and 2B). In both cases, conversion of FA to FC was observed during RT (2C, 2D). Gyn1 exhibited an increase in both FA-tumor-intensity and FC-tumor-intensity following RT (3-months), while Gyn2 showed a reduction in both FA and FC following RT which suggests that fibrosis growth assists in tumor death post-RT. Figure 3 shows FA and FC maps over three time-points for two PCa. As in the GynCa, conversion of FA to FC was observed. Prior to RT, the high intensity FA and FC were initially located on the prostate-gland periphery and during treatment were observed within the prostate (3A and 3B). Prostate1 had an increase of FC following RT, whereas Prostate2 had a stagnation of FC following RT. In both GynCa and PCa patients, the patients with higher initial tumor volume demonstrated a more gradual reduction in FC post-RT, which suggests that higher tumor burden may exhibit different kinetics.Conclusions
This is the first MRI-based human study that provides quantitative information on fibrosis changes during the course of radiation. FA and FC variations over the course of RT may influence subsequent treatment outcome.Acknowledgements
NIH R01EB020667, R01HL094610, R01CA237005References
1. Kotova SL, Timashev PS, Belkova G V., et al. Early Effects of Ionizing Radiation on the Collagen Hierarchical Structure of Bladder and Rectum Visualized by Atomic Force Microscopy. Microsc Microanal. 2018;24(1):38-48. doi:10.1017/S1431927618000065
2. Fullerton GD, Nes E, Amurao M, Rahal A, Krasnosselskaia L, Cameron I. An NMR method to characterize multiple water compartments on mammalian collagen. Cell Biol Int. 2006;30(1):66-73. doi:10.1016/j.cellbi.2005.09.009
3. Cristel G, Esposito A, Briganti A, et al. MpMRI of the prostate: is there a role for semi-quantitative analysis of DCE-MRI and late gadolinium enhancement in the characterisation of prostate cancer? Clin Radiol. 2019;74(4):259-267. doi:10.1016/j.crad.2018.08.017
4. Maestrini V, Treibel TA, White SK, Fontana M, Moon JC. T1 Mapping for Characterization of Intracellular and Extracellular Myocardial Diseases in Heart Failure. Curr Cardiovasc Imaging Rep. 2014;7(9):1-7. doi:10.1007/s12410-014-9287-8
5. Sheikh K, Lee J, Morcos M, et al. Tracking acute & chronic RT-induced fibrosis in cervical cancer using native & Late-Gadolinium-Enhancement Short-Inversion-Time (STIR) UTE. In: International Society of Magnetic Resonance in Medicine. ; 2022:3409.
6. Schmidt EJ, Muradyan I, Benkert T, et al. Imaging wound-healing related fibrosis using short inversion time ultra-short TE (STIR-UTE). In: International Society of Magnetic Resonance in Medicine. ; 2019.
7. Manganaro L, Lakhman Y, Bharwani N, et al. Correction to: Staging, recurrence and follow-up of uterine cervical cancer using MRI: Updated Guidelines of the European Society of Urogenital Radiology after revised FIGO staging 2018 (European Radiology, (2021), 31, 10, (7802-7816), 10.1007/s00330-020-07632-9). Eur Radiol. 2022;32(1):738. doi:10.1007/s00330-021-08066-7
8. Panebianco V, Villeirs G, Weinreb JC, et al. Prostate Magnetic Resonance Imaging for Local Recurrence Reporting (PI-RR): International Consensus -based Guidelines on Multiparametric Magnetic Resonance Imaging for Prostate Cancer Recurrence after Radiation Therapy and Radical Prostatectomy. Eur Urol Oncol. 2021;4(6):868-876. doi:10.1016/j.euo.2021.01.003
9. McKee TJ, Perlman G, Morris M, Komarova S V. Extracellular matrix composition of connective tissues: a systematic review and meta-analysis. Sci Rep. 2019;9(1):1-15. doi:10.1038/s41598-019-46896-0
Figures