1488
31P and 1H MRS for in vivo metabolic profiling of diffuse large B-cell lymphoma1Institute of Neuroradiology, University Hospital Frankfurt, Frankfurt am Main, Germany, 2University Cancer Center Frankfurt (UCT), Frankfurt am Main, Germany, 3Frankfurt Cancer Institute (FCI), Frankfurt am Main, Germany, 4German Cancer Research Center (DKFZ) Heidelberg, Germany and German Cancer Consortium (DKTK), Partner Site Frankfurt/Mainz, Frankfurt am Main, Germany, 5Department of Oto-Rhino-Laryngology, University Hospital Frankfurt, Frankfurt am Main, Germany, 6Department of Hematology/Oncology, University Hospital Frankfurt, Frankfurt am Main, Germany
Synopsis
Keywords: Cancer, Tumor, lymphoma, multiomics, MR-Spectroscopy
With the presented protocol, key metabolites related to different metabolic profiles of aggressive lymphomas (such as lactate, alanine, as a surrogate for pyruvate, as well as choline components) can be detected in vivo in a clinical setting.Introduction
Due to their extreme genetic, phenotypic, and clinical heterogeneity, aggressive lymphomas can be divided into molecularly distinct subtypes that require different therapeutic strategies.1 Currently, multi-omic data of genetic alterations, gene expression signatures, and signaling/regulatory pathways is used in an attempt for molecular ‘Diffuse Large B-Cell Lymphoma’ (DLBCL) subtyping. 2345 Moreover, aberrations in genes, abundance of transcripts, or levels of protein can substantially change the quantity and dynamics of metabolites. These metabolic signatures have a prognostic impact and implications for therapeutic approaches.67 However, past attempts aiming at metabolic subtyping in patient tumor tissue were met with caution, as ex vivo metabolomic studies of tissue can suffer from bias due to the collection procedure and artificial ex vivo microenvironment.8 We therefore propose in vivo MRS to non-invasively identify and collect metabolic fingerprints of tumor manifestations in patients. We demonstrate the developed protocol on healthy subjects and first patients and report the results here.Methods
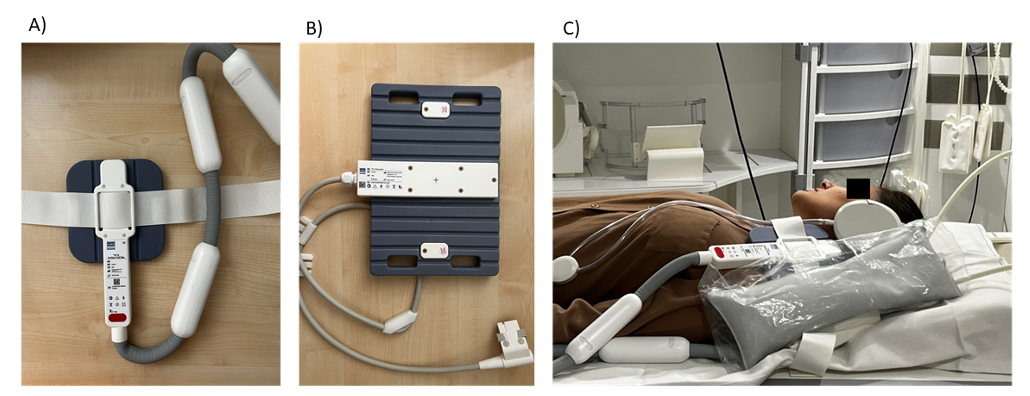
The initiated 31P and 1H MRS study aims to examine patients with superficial lymph node manifestations of diffuse large B-cell lymphoma (DLBCL) on a 3T MRI Scanner (Siemens MAGNETOM Prisma, Siemens Healthineers Erlangen), using two dual tuned Flex Surface Coils for 1H/31P (sizes S and M from RAPID Biomedical GmbH).The MRS protocol includes the following sequences:
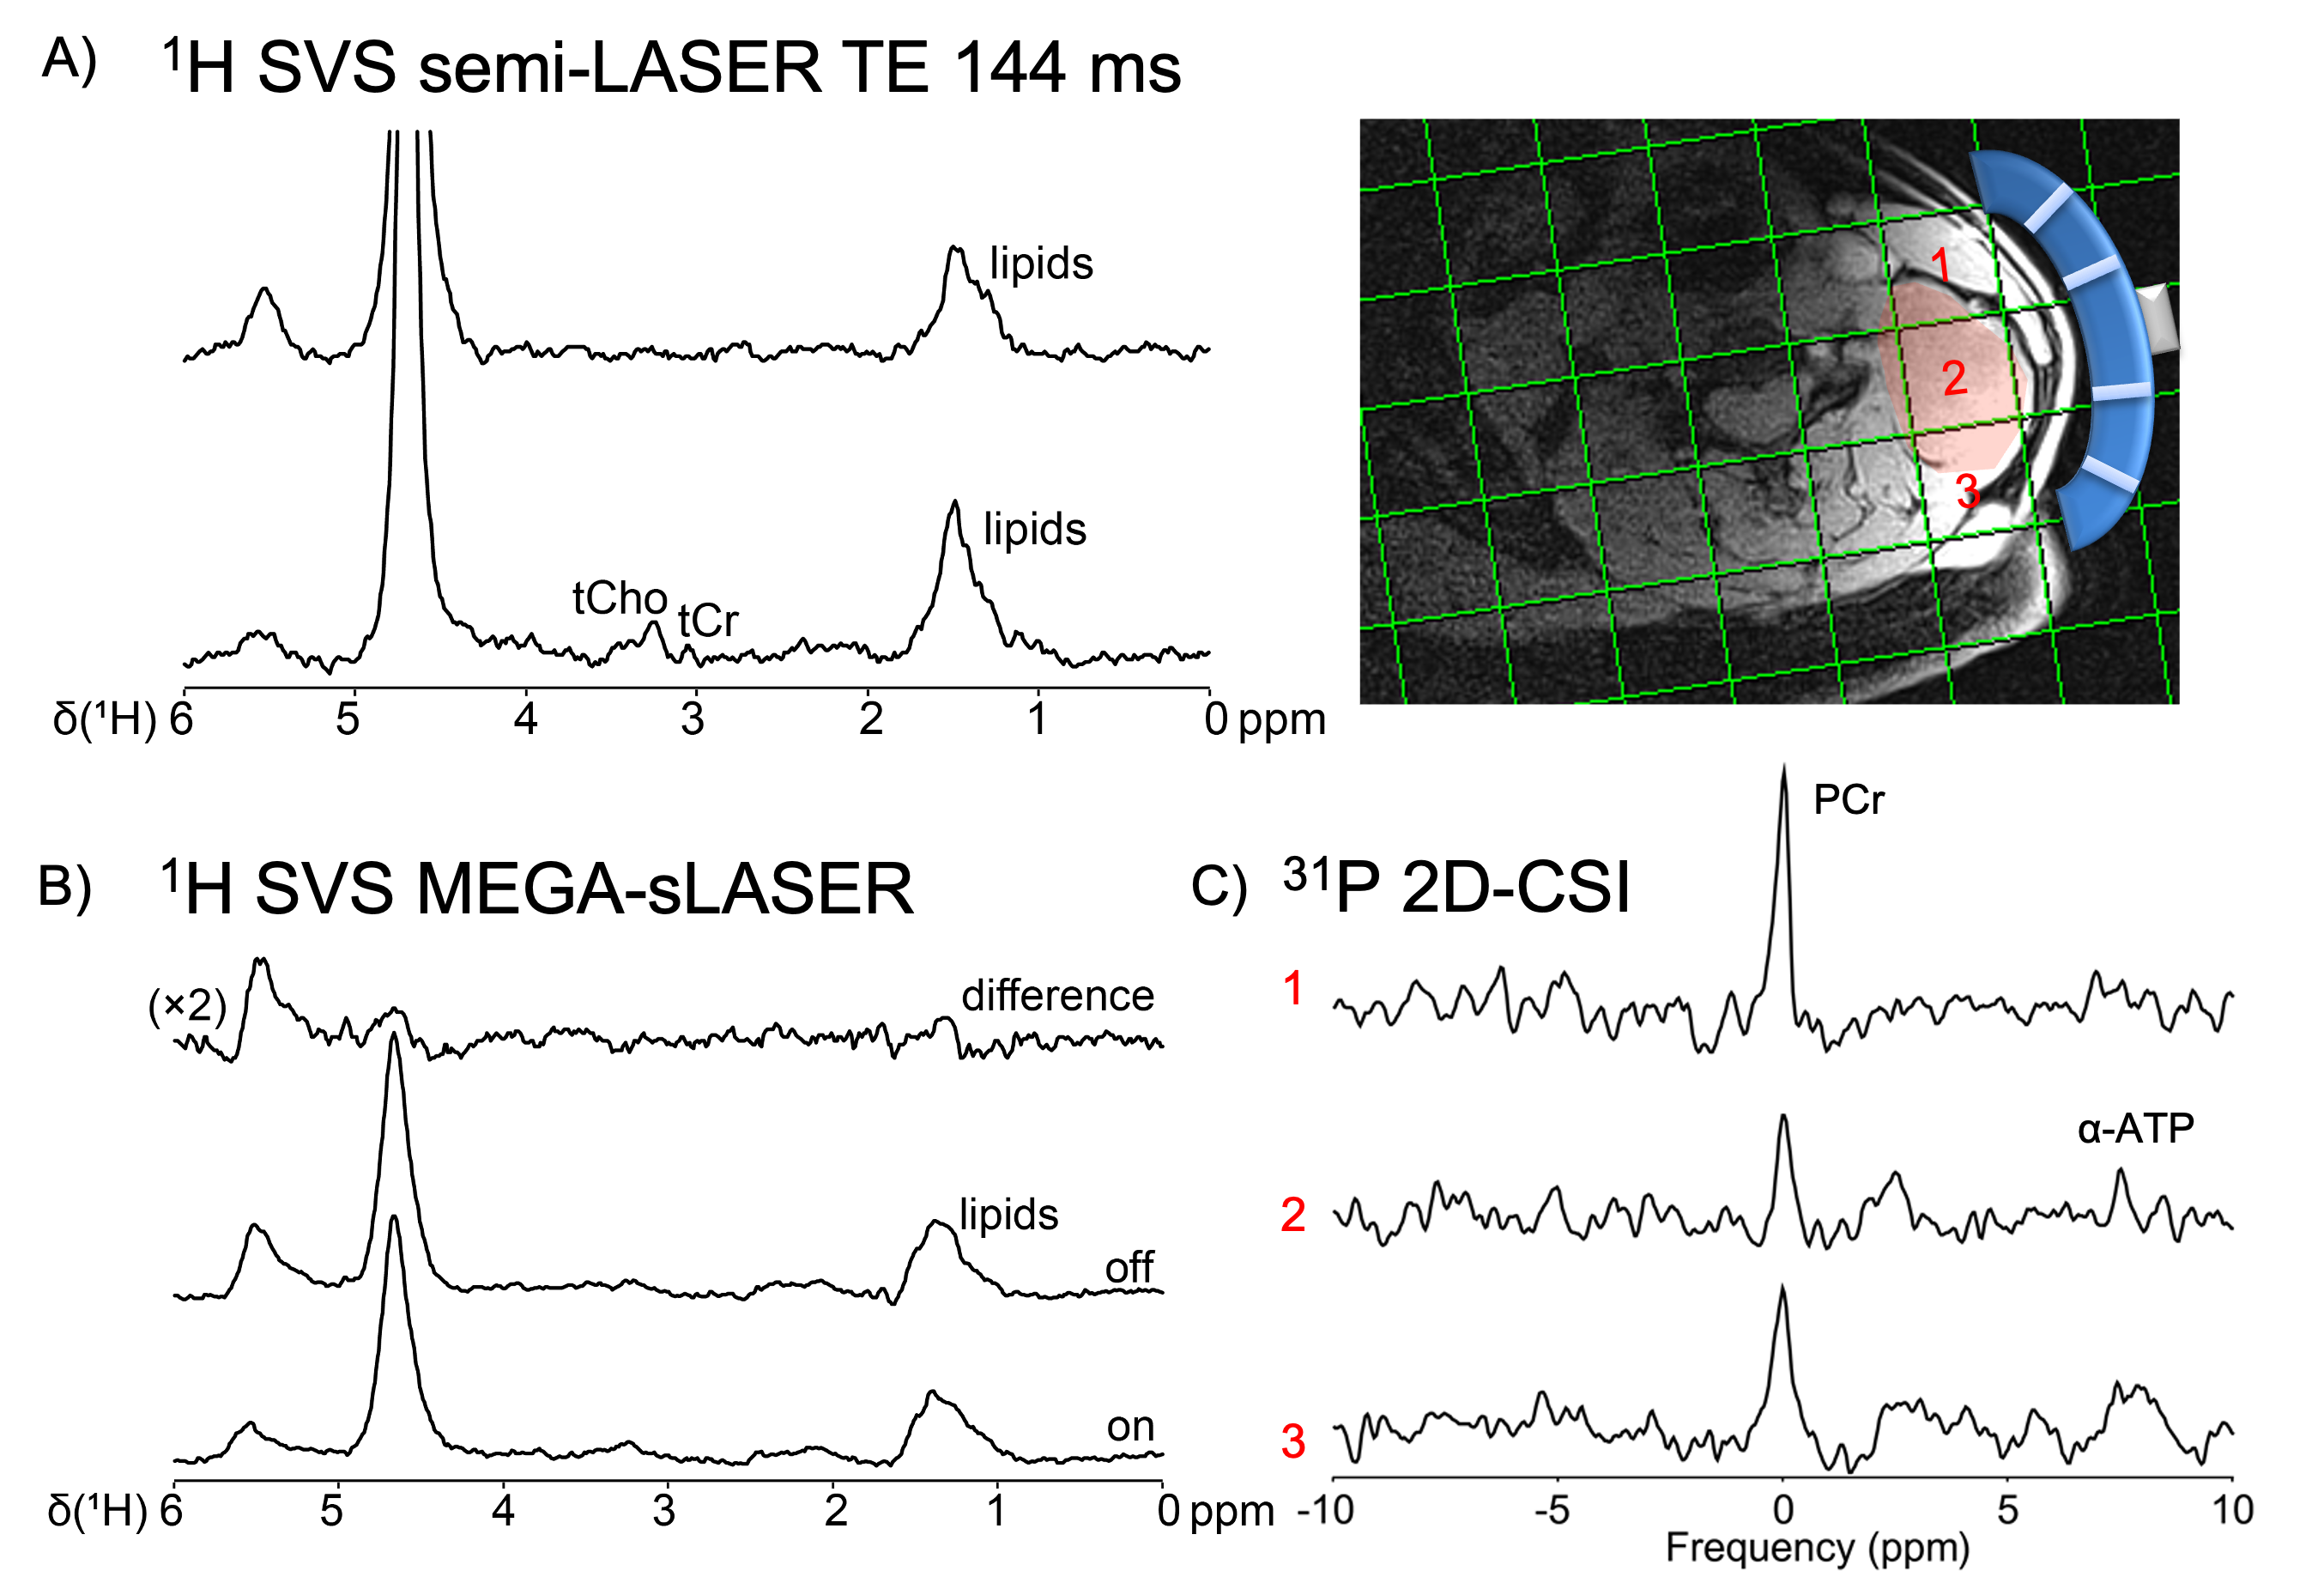
- 1H decoupled 31P MR spectroscopic imaging (MRSI) with chemical shift imaging (2D-CSI-FID). 25 mm slice, FOV 320 mm2, 16x16 matrix yielding 20x20x25 mm3 voxel size. NA 4, TR 2 s, FA = 60°. TA = 15 min.
- Single-voxel semi-LASER sequence (TE 144 ms, TR 3 s) for detection of lactate, alanine as well as total choline and creatinine. This was repeated with TI=800 ms for metabolite nulling. TA = 10min.
- Single-voxel MEGA-sLASER (TE 144 ms, TR 5 s; 32 avg MEGA-off and 32 avg MEGA-on) for detection of lactate in the presence of lipids. TA=10min.
Results
Up to now, reliable data from five healthy subjects and three patients were obtained. Both surface coils gave good signal/noise, the coil SNR test in shown in Figure 1. The partly flexible designs allow the coils to fit snugly to the patients in various lymph node regions (Figure 2). An adiabatic pulse protocol (designed to give uniform signal excitation in tissues at various depths) was established to optimize signal acquisition.9 Overlapping macromolecular resonances (MM) arising mainly from cytosolic proteins and lipids, hamper the metabolite quantification but those signals may also serve as valuable biomarkers for pathologies.10 Almost pure MM spectra can be obtained with an adiabatic inversion pulse for metabolite nulling (Figure 3). In addition, we implemented a MEGA-sLASER sequence for lactate detection exploiting the large bandwidths of adiabatic refocusing pulses (Figures 3 and 4).11 31P 2D Chemical Shift Imaging (CSI) using a slice-selective pulse to excite inside the sensitive volume of the coil allows us to obtain multiple spectra simultaneously and the option to include multiple affected lymph nodes. However, there is always contribution of signal from tissue outside the targeted voxel (Figure 2), which is exacerbated by patient movement (e.g., respiratory motion).Discussion
The ultimate goal of the project is to identify in vivo metabolic signatures, some of which have been described in preclinical cohorts e.g., OxPhos-DLBCL compared to „non-OxPhos“-DLBCL with differences in the pyruvate dehydrogenase (PDH) enzyme activity.6 Other subsets worth investigating are those with MYC overexpression which show a dysregulation of the choline metabolism.7 With the presented protocol, key metabolites related to these differences such as lactate, alanine as a surrogate for pyruvate, as well as total Cho (1H) and potentially Phosphocholine and Glycerophosphocholine (31P) can be detected in vivo in a clinical setting.Acknowledgements
KJW and SA were funded by the Mildred Scheel Career Center Frankfurt (Deutsche Krebshilfe). In addition, KJW and DCT were funded by the Else Kröner-Fresenius-Stiftung.References
1. Lenz, G. & Staudt, L. M. Aggressive Lymphomas. N Engl J Med 362, 1417–1429 (2010).
2. Alizadeh, A. A. et al. Distinct types of diffuse large B-cell lymphoma identified by gene expression profiling. Nature403, 503–511 (2000).
3. Lenz, G. et al. Molecular subtypes of diffuse large B-cell lymphoma arise by distinct genetic pathways. Proceedings of the National Academy of Sciences 105, 13520–13525 (2008).
4. Rosenwald, A. et al. The Use of Molecular Profiling to Predict Survival after Chemotherapy for Diffuse Large-B-Cell Lymphoma. N Engl J Med 346, 1937–1947 (2002).
5. Wright, G. et al. A gene expression-based method to diagnose clinically distinct subgroups of diffuse large B cell lymphoma. Proceedings of the National Academy of Sciences 100, 9991–9996 (2003).
6. Caro, P. et al. Metabolic signatures uncover distinct targets in molecular subsets of diffuse large B cell lymphoma.Cancer Cell 22, 547–560 (2012).
7. Xiong, J. et al. MYC is a positive regulator of choline metabolism and impedes mitophagy-dependent necroptosis in diffuse large B-cell lymphoma. Blood Cancer J 7, e0 (2017).
8. Smith, L. et al. Important Considerations for Sample Collection in Metabolomics Studies with a Special Focus on Applications to Liver Functions. Metabolites 10, 104 (2020).
9. Griffiths, J. R., Tate, A. R., Howe, F. A. & Stubbs, M. Magnetic Resonance Spectroscopy of cancer—practicalities of multi-centre trials and early results in non-Hodgkin’s lymphoma. European Journal of Cancer 38, 2085–2093 (2002).
10. Giapitzakis, I.-A., Avdievich, N. & Henning, A. Characterization of macromolecular baseline of human brain using metabolite cycled semi-LASER at 9.4T. Magn Reson Med 80, 462–473 (2018).
11. Arteaga de Castro, C. S. et al. Improved efficiency on editing MRS of lactate and γ-aminobutyric acid by inclusion of frequency offset corrected inversion pulses at high fields: MRS EDITING WITH FOCI PULSES AT 7 T. NMR Biomed. 26, 1213–1219 (2013).
Figures