1482
Additional value of T2 mapping and texture analysis for the improvement to MR elastography based liver fibrosis Machine Learing classification1Department of Biomedical Imaging and Image-Guided Therapy, Medical University Vienna, Vienna, Austria, 2Division of Endocrinology and Metabolism, Department of Medicine III, Medical University Vienna, Vienna, Austria, 3Christian Doppler Laboratory for Clinical Molecular Imaging, Vienna, Austria
Synopsis
Keywords: Liver, Machine Learning/Artificial Intelligence, Elastography, MR Value, Radiomics, Relaxometry
MR elastography is currently the most accurate non-invasive diagnostic method for liver fibrosis. However, other pathologic processes co-existing with liver fibrosis influence the stiffness measurement and including other MR-based measures might improve fibrosis assessment. In this work we suggest to add texture analysis features calculated on liver T2 maps together with T2 values from fast radial turbo-spin-echo sequence into a machine-learning classification model and to compare the performance of the model after adding selected parameters. Our results show that including both, texture analysis and T2 values significantly improves the classification performance of the model.Introduction
Currently, the most accurate non-invasive diagnostic tool for diagnosis and staging of liver fibrosis is magnetic resonance elastography (MRE) via stiffness measurement. Although liver fibrosis is the predominant factor causing increased liver stiffness, other pathologic processes (such as inflammation, biliary obstruction and cholestasis, passive congestion, or increased portal venous pressure) also contribute to increased liver stiffness. These processes often co-exist with liver fibrosis, and it is challenging to differentiate them from liver fibrosis. Including other MR-based parameters might improve liver fibrosis assessment [1].Liver T2 mapping has been proposed to be a marker of hepatic inflammation and fibrosis, but has not been feasible in clinical settings because of long scan times. It has been shown recently that with radial techniques accurate T2 maps with excellent resolution can be obtained within one breath-hold period [2].
Texture analysis (TA) allows to quantify image texture and it has been applied for liver fibrosis classification on T2-weighted images with promising results [3, 4]. However, TA highly depends on the measurement parameters of the sequences. T2 map contains information that reflect the tissue composition, and is more stable across scanners, which makes comparison between centers more feasible. Also, the influence of image inhomogeneity caused by imperfections of the B0 and B1 homogeneity, which is especially problematic for large organs, is eliminated.
Therefore, the goal of this study was to investigate the effect of adding liver parenchymal T2 values, together with TA of liver T2 maps, to liver fibrosis classification model based on MRE with machine learning (ML).
Materials and methods
Patients that underwent liver biopsy and abdominal MRI examination were enrolled (n = 87). The exclusion criteria were no fibrosis grade from histology (29), degraded quality of T2 maps (7), and non-evaluable MRE (3). Additionally, 7 healthy volunteers were scanned, yielding 55 subjects for analysis.All measurements were performed on a 3T PrismaFit Siemens system (Siemens Healthcare, Erlangen, Germany) equipped with an 18-channel body coil and a 30-channel body coil and 32-channel spine coil. The parameters of radial turbo-spin-echo (rTSE) sequence were TR = 1500ms, ETL = 29, TE range = 9.2 – 266ms, echo-spacing = 9.2ms, FOV 400x400 mm2, matrix size = 256x256, radial views = 290, FA = 180°, slice thickness = 6mm, number of slices = 5, time of acquisition = 17sec, with fat-suppression applied and parameters of 2D SE-EPI MRE sequence were parameters: TR/TE = 1000/47msec, FOV = 380 x 380, matrix = 256 x 256 (acquired 100 x 100), slice thickness = 8mm, number of slices = 4, breath-hold time = 11sec. The T2 map as well as MRE elastogram were calculated inline.
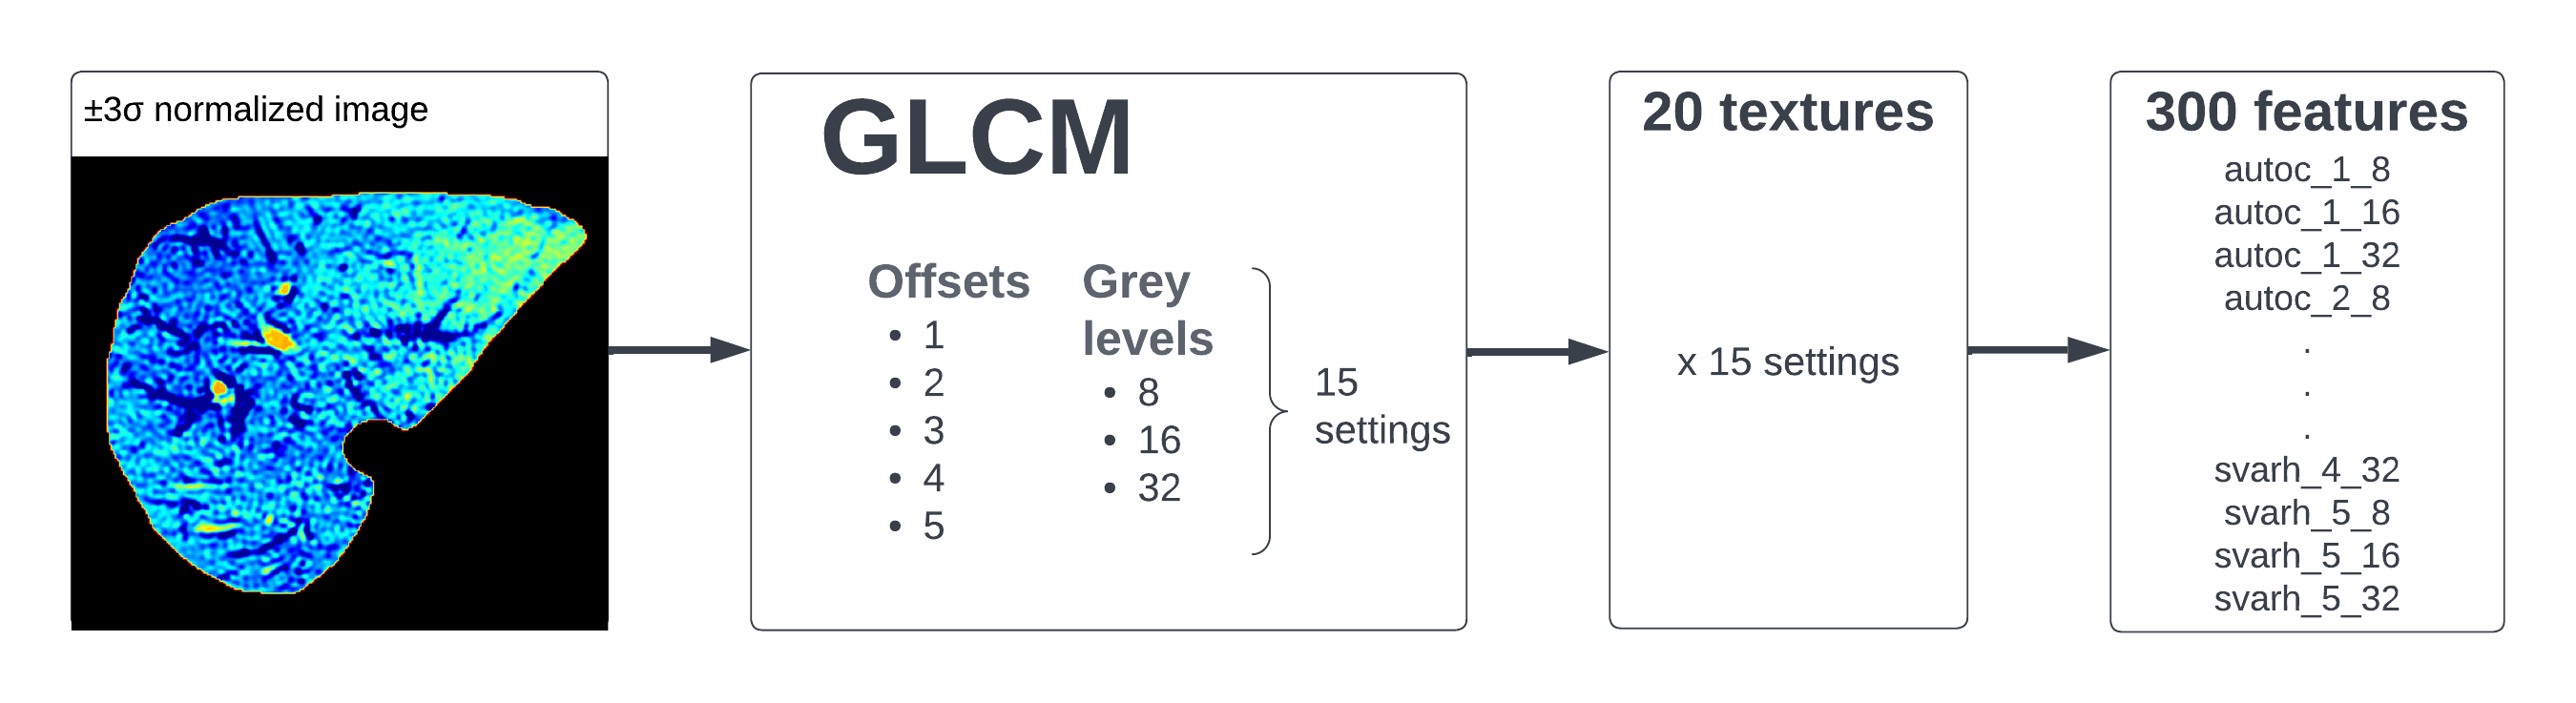
ROIs encompassing whole liver and excluding large vessels were manually selected on a slice with biggest liver coverage and with no streaking artifacts in 3DSlicer [5]. The ROIs were then transferred to Matlab. The images were ±3σ normalized and the GLCM and textures computation was performed. 20 available textures from [6] were calculated with 3 different grey-quantization-levels (8, 16, 32) and with 5 between-pixel-distances (1 to 5). This yielded 300 textural features in total. The diagram in Figure 1 depicts this process. In addition, mean T2 values were calculated for each ROI.
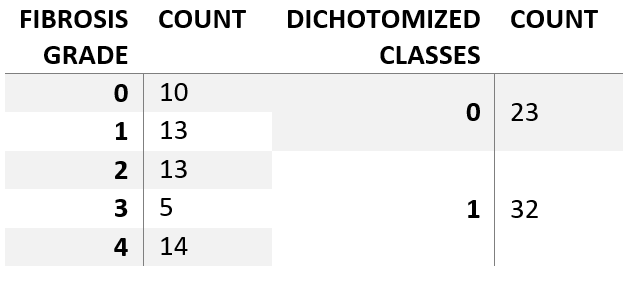
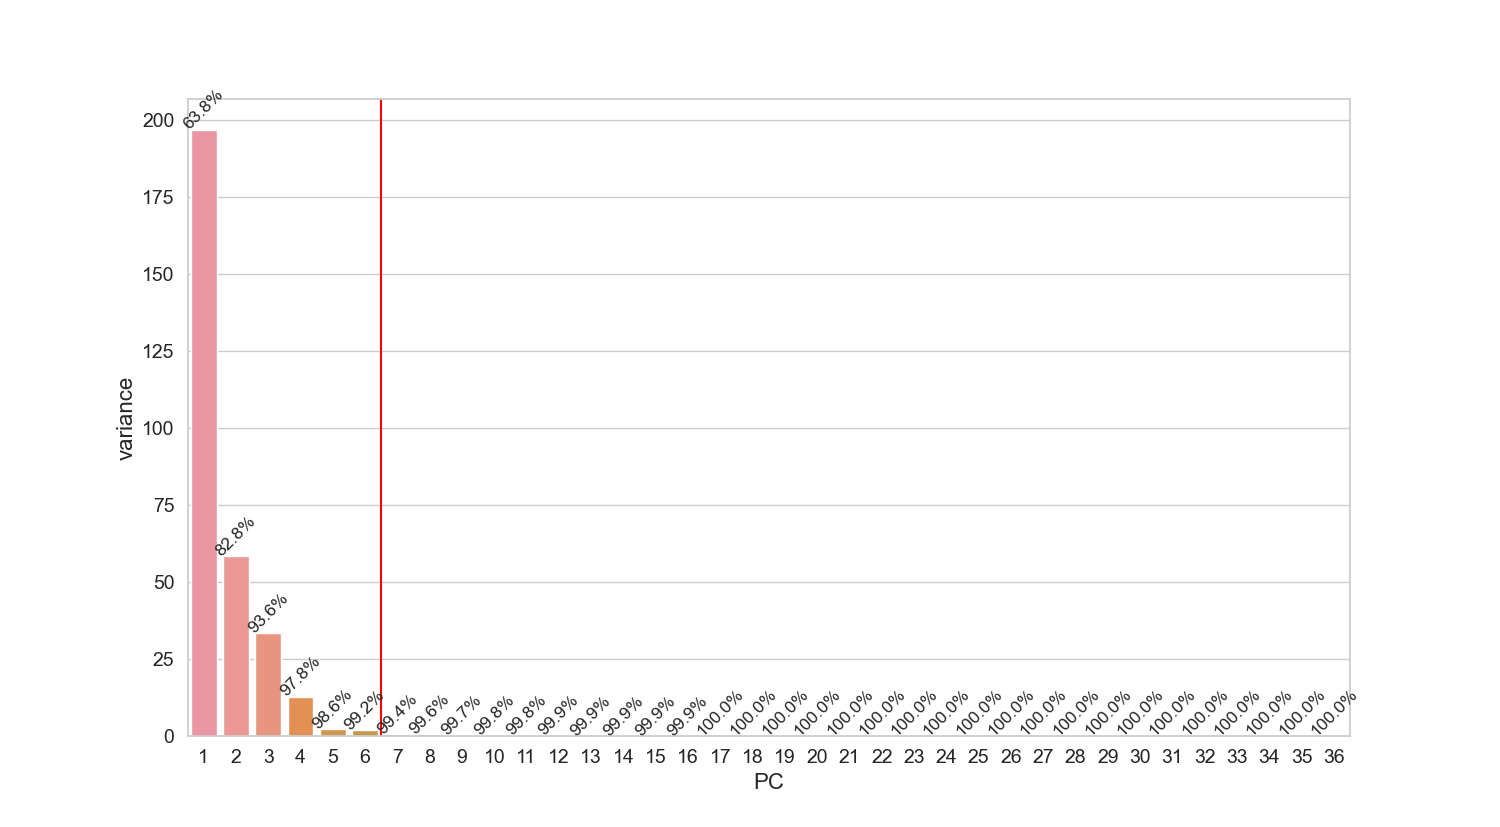
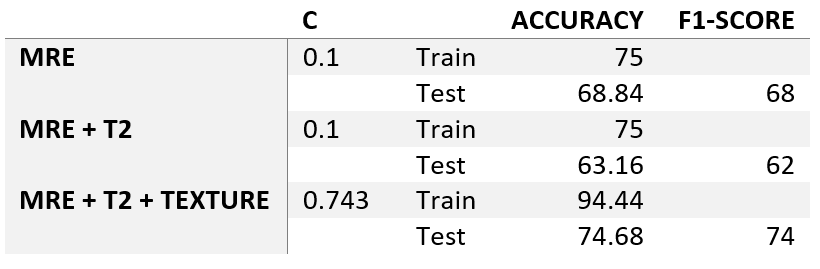
Classification was performed with scikit-learn in python [7]. The fibrosis grades were dichotomized into 0 (F0-F1) and 1 (F2-F4). The data were then split into 2/3 train and 1/3 test with y stratified. Train data were fitted and transformed with StandardScaler to have unit variance and zero mean. The same transform was then applied to the test data. The 300 textural features in the train dataset were decomposed with Principal Component Analysis (PCA) and only N components that explained 99% of overall variability were selected for further analysis. The test data were then transformed with the same PCA. For classification, LogisticRegression was chosen. Three types of datasets were fed to the model: 1. pure MRE data, 2. MRE and T2 data, 3. MRE, T2 and reduced textural features. The optimal value for l2 regularization (C parameter) was selected via GridSearchCV with 5-fold cross-validation for each of the model runs. Train and test accuracies, as well as the f1 scores of the test data were assessed to compare the results.
Results
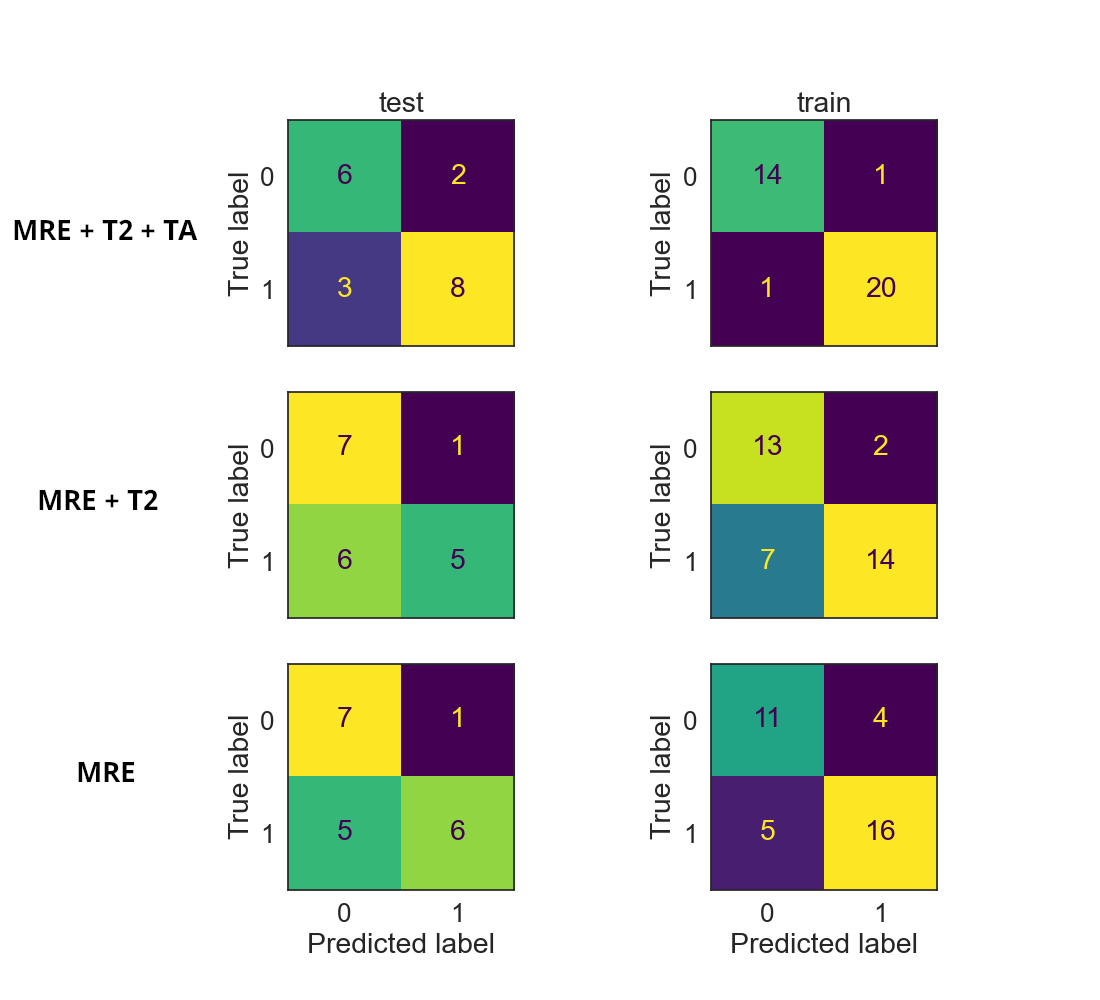
There were 31 men (mean age 50.46 ± 15.71y) and 24 females (mean age 49.9 ± 16.79y). The fibrosis grades are summarized in Table 1. The PCA revealed that 6 principal components were needed to explain 99% of textural data (Figure 2). The C hyperparameter for l2 normalization, train and test accuracies and the f1-scores are listed in Table 2. The confusion matrices of the classification results are depicted in Figure 3. It can be observed that the addition of T2 values together with textural features significantly increased the model performance.Discussion
We showed that adding T2 values together with textural features improve fibrosis classification. Adding more MR parameters, such as T1 values, which has also been shown to be a marker of hepatic fibrosis, might further improve the performance. Larger cohorts as well as different models should be analyzed.Conclusion
The inclusion of T2 maps together with texture analysis improves the classification with ML of liver fibrosis based on MRE.Acknowledgements
No acknowledgement found.References
1. Idilman, I.S., et al., MR elastography of liver: current status and future perspectives. Abdom Radiol (NY), 2020. 45(11): p. 3444-3462.
2. Bencikova, D., et al., Evaluation of a single-breath-hold radial turbo-spin-echo sequence for T2 mapping of the liver at 3T. Eur Radiol, 2022. 32(5): p. 3388-3397.
3. House, M.J., et al., Texture-based classification of liver fibrosis using MRI. J Magn Reson Imaging, 2015. 41(2): p. 322-8.
4. Jirak, D., et al., Texture analysis of human liver. J Magn Reson Imaging, 2002. 15(1): p. 68-74.
5. Fedorov A, B.R., Kalpathy-Cramer J et al, 3D Slicer as an image computing platform for the Quantitative Imaging Network. Magnetic resonance imaging 30:1323-1341. 2012.
6. A, U., GLCM texture features (https://www.mathworks.com/matlabcentral/fileexchange/22187-glcm-texture-features), MATLAB Central File Exchange. Retrieved November 10, 2021. [online]. 2022.
7. al., P.e., Scikit-learn: Machine Learning in Python. JMLR, 2011. 12: p. 2825-2830.
Figures