1480
Non-invasively and Pre-Operatively Evaluate the Micro-Vascular Invasion with Susceptibility-Weighted Imaging based Radiomics Strategy1Sun Yat-sen University Cancer Center, Guangzhou, China, 2MR Collaboration, Central Research Institute, United Imaging Healthcare, Shanghai, China
Synopsis
Keywords: Liver, Radiomics, Micro-Vascular Invasion
MVI has widely been considered as an important prognostic biomarker of hepatocellular carcinoma (HCC). This study aims to non-invasively identify MVI in HCC with susceptibility-weighted-imaging (SWI)-derived radiomics. The results indicated that SWI-derived radiomics are valuable for noninvasively and accurately identifying the MVI status of HCC. Furthermore, the integration of radiomics and clinical factors yielded a predictive nomogram with satisfying diagnostic performance and potential clinical benefits.
Introduction
During the past few years, growing importance has been attached to predict micro-vascular invasion (MVI) of hepatocellular carcinoma (HCC) because the MVI has widely been considered as an important prognostic biomarker. The presence of HCC always suggested a high mortality as well as high probability of early recurrence.(1-3) Serving as an emerging and promising functional MRI technique, susceptibility-weighted-imaging (SWI) is able to visualize abnormal vascularity, hemorrhage, calcification with unique image contrast and added phase information by sensing the endogenous “susceptibility contrast agents” such as deposited iron, hemoglobin and hemosiderin.(4)Since innumerable studies have demonstrated that SWI is powerful for specifically visualize the micro-hemorrhage, small vessel and abnormal vascularity. In essence, MVI can also be regarded as the manifestation of vascular system in HCC. Radiomics technology have shown tremendous clinical value by means of providing thousands of quantitative image features able to be integrated for constructing powerful clinical prediction models.(5)Therefore, it was hypothesized by us that the integration of radiomics technique and SWI holds potential for accurately identifying the MVI in HCC. To the best of our knowledge, hardly have the radiomics features been extracted from SWI for clinical investigation. Therefore, this study aims to non-invasively identify MVI in HCC with SWI-derived radiomics.
Methods
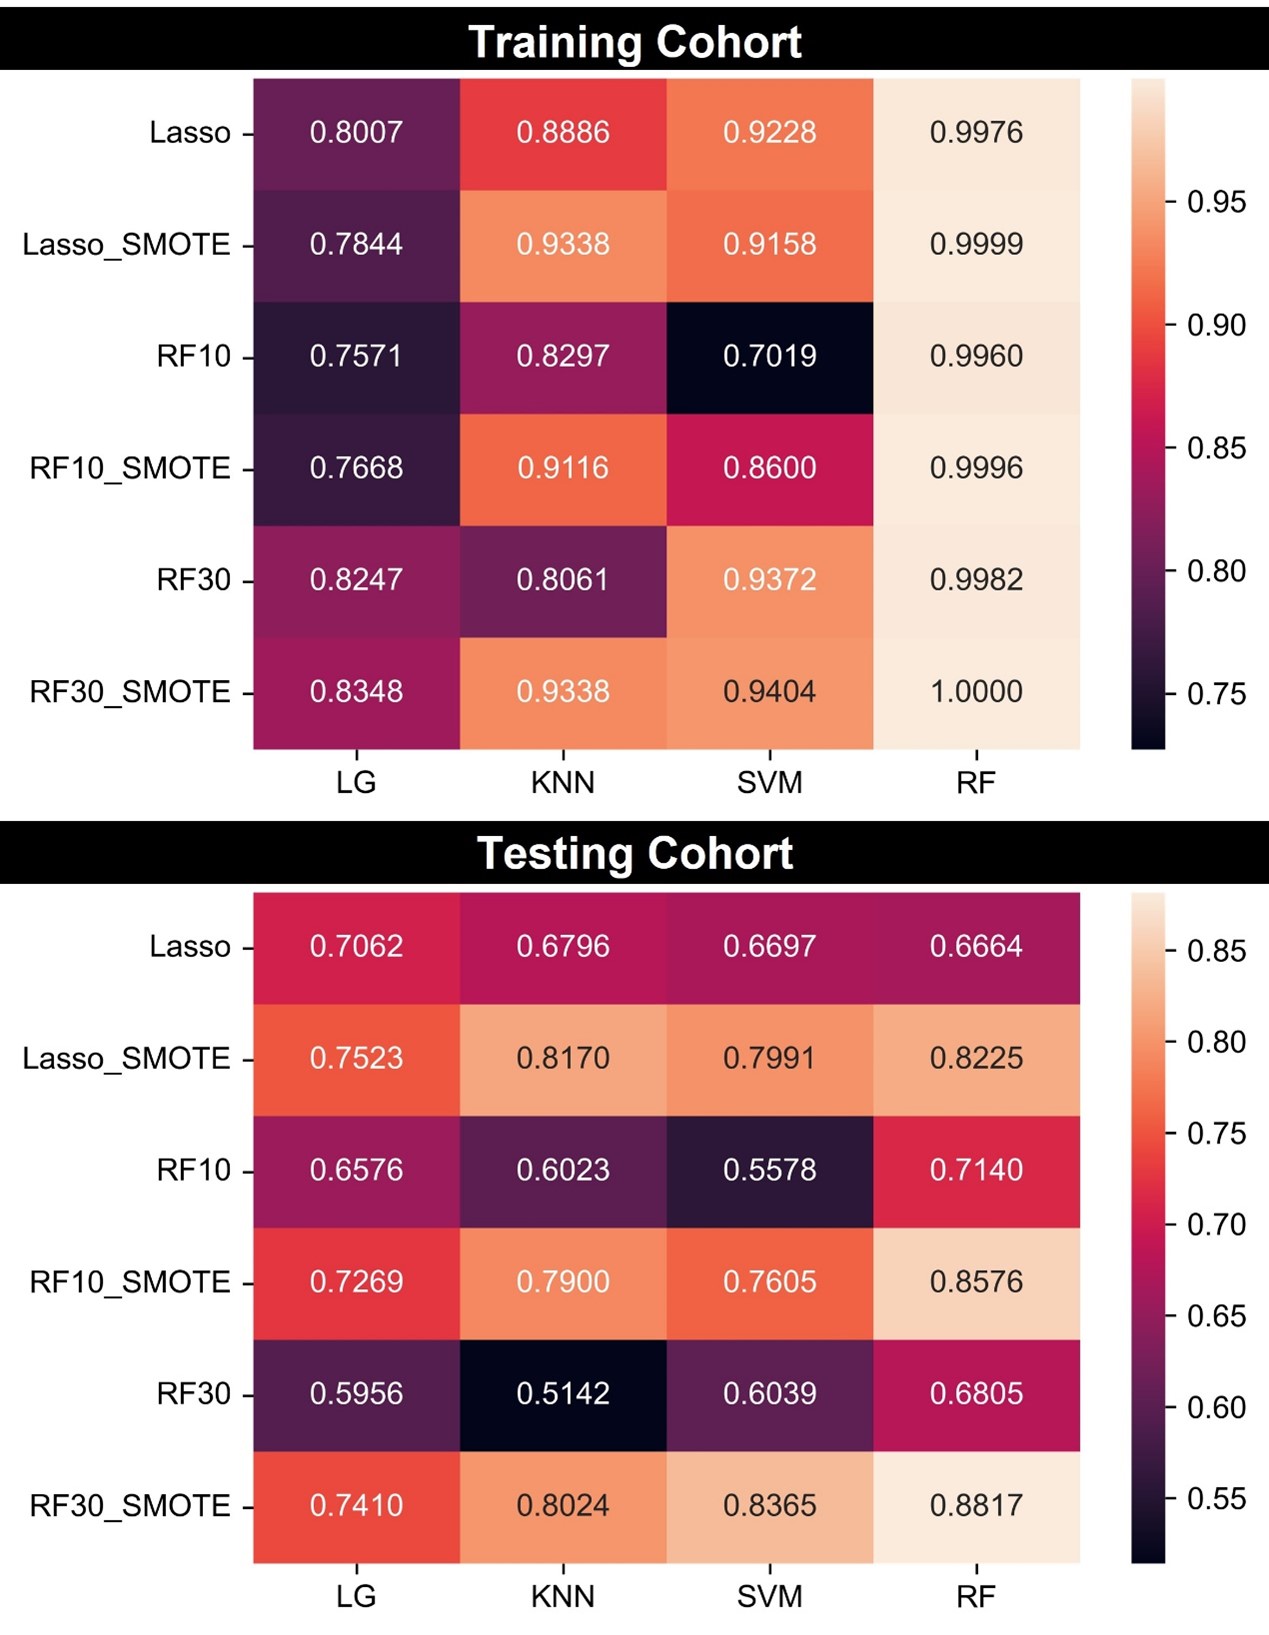
A total of 189 patients were finally included in training-testing cohort and 32 patients were included into external validation group. Radiomics features were extracted with a widely-used open-sourced software: Pyradiomics (https://pyradiomics.readthedocs.io/en/latest/). MRI examinations were performed with a 3.0 T scanner (United-Imaging Healthcare, Shanghai, China). Ultimately, a total of 1688 features were extracted from either SWI images and T2WI images, which resulted 3376 features for each included patient. As for features selection, variance filtering was firstly carried out to eliminate the features with low variance. Secondly, student t test was applied. Third, least absolute shrinkage and selection operator (Lasso) regression or random forest (RF) was performed to select the radiomics features. Specifically, according to the features importance given by random forest, the top 10 and top 30 features of importance are retained. Besides, Lasso regression approach also resulted in a subset of selected features. Therefore, three subsets of selected features included RF10, RF30, Lasso were included. Furthermore, with reference of some previous reports, Synthetic Minority Oversampling Technique (SMOTE) algorithm was included into this research with aim of compromising the negative effects of imbalanced data. Ultimately, six data subsets including RF10, RF30, Lasso, RF10_SMOTE, RF30_SMOTE and Lasso_SMOTE were obtained for constructing the diagnostic models. Based on aforementioned six data subsets, four machine learning classifiers containing support vector machine (SVM), logistic regression (LG), K nearest neighbors (KNN) as well as random forest (RF) were utilized for constructing the diagnostic models. The random combination of four classifying algorithms and six data subsets resulted in a total of twenty-four radiomics models. Receiver operating characteristic (ROC) analysis with 5-fold cross validation was carried out to evaluate the diagnostic performance of clinical and radiomics model.Results
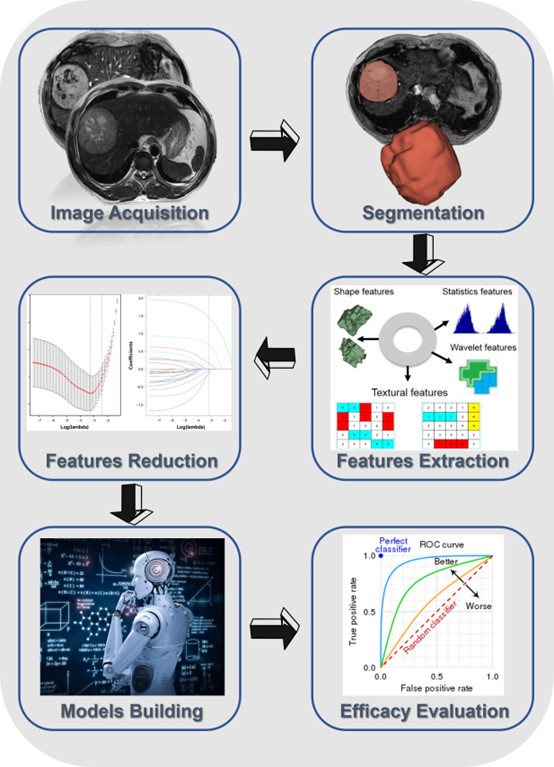
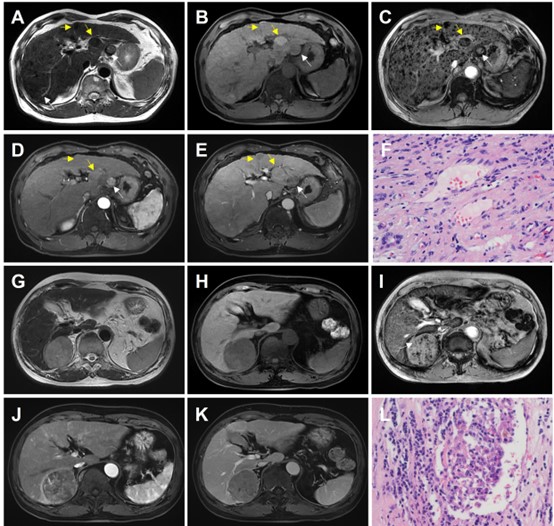
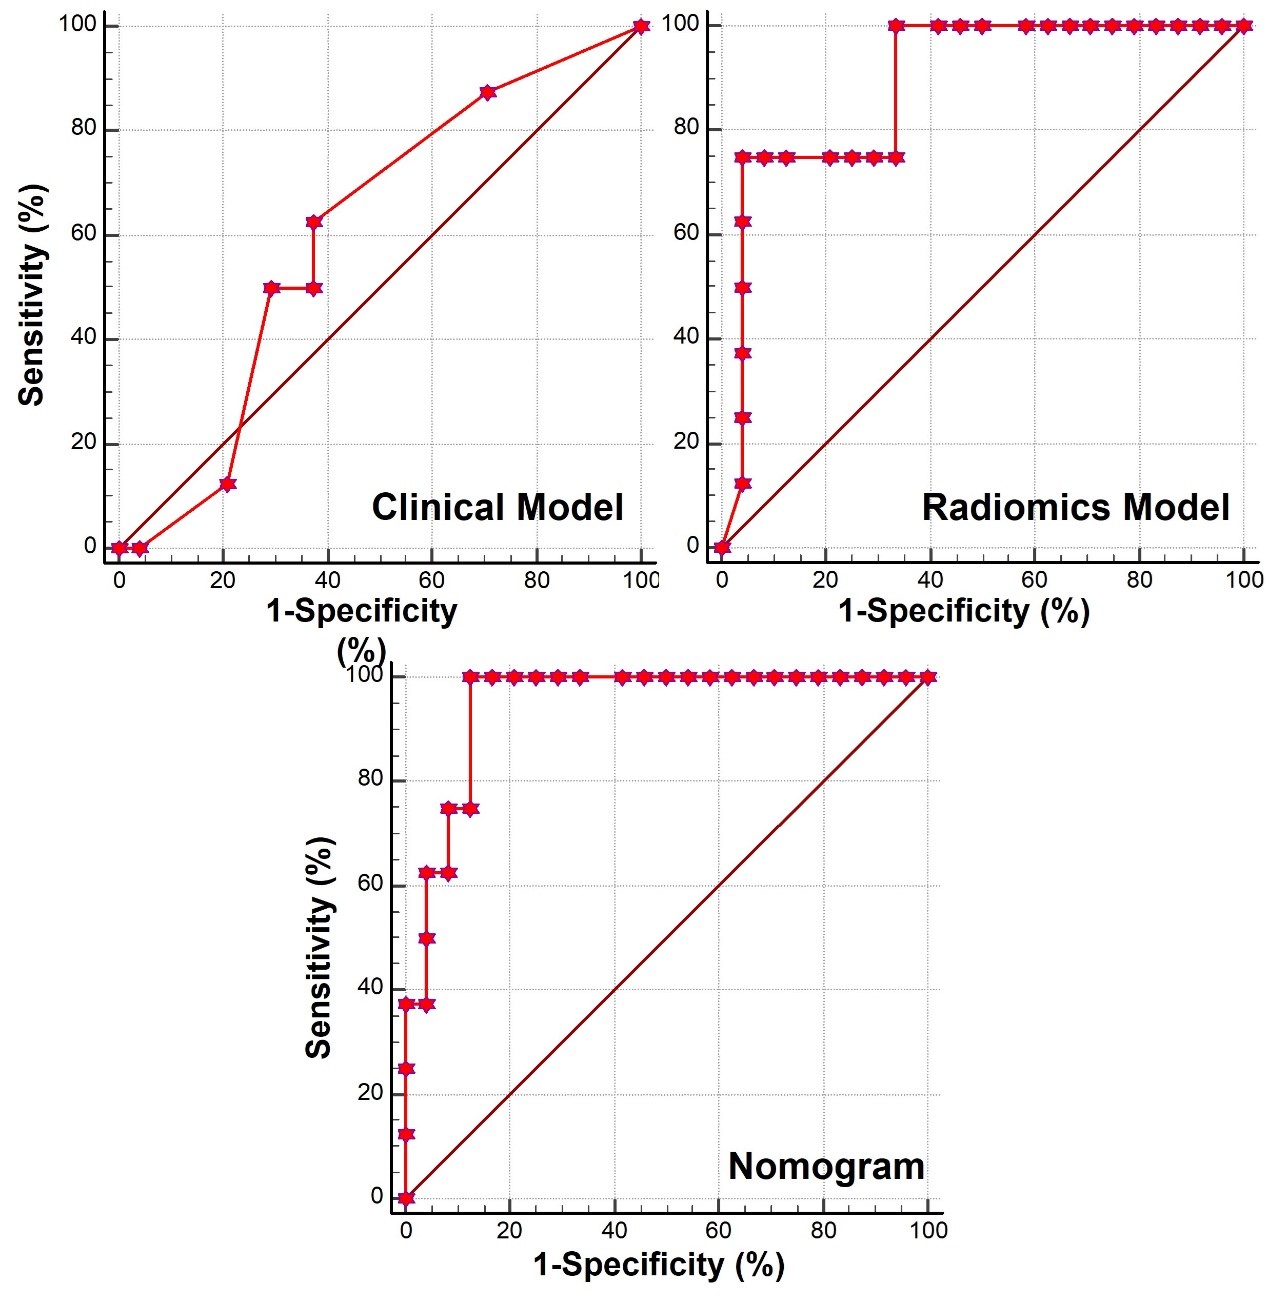
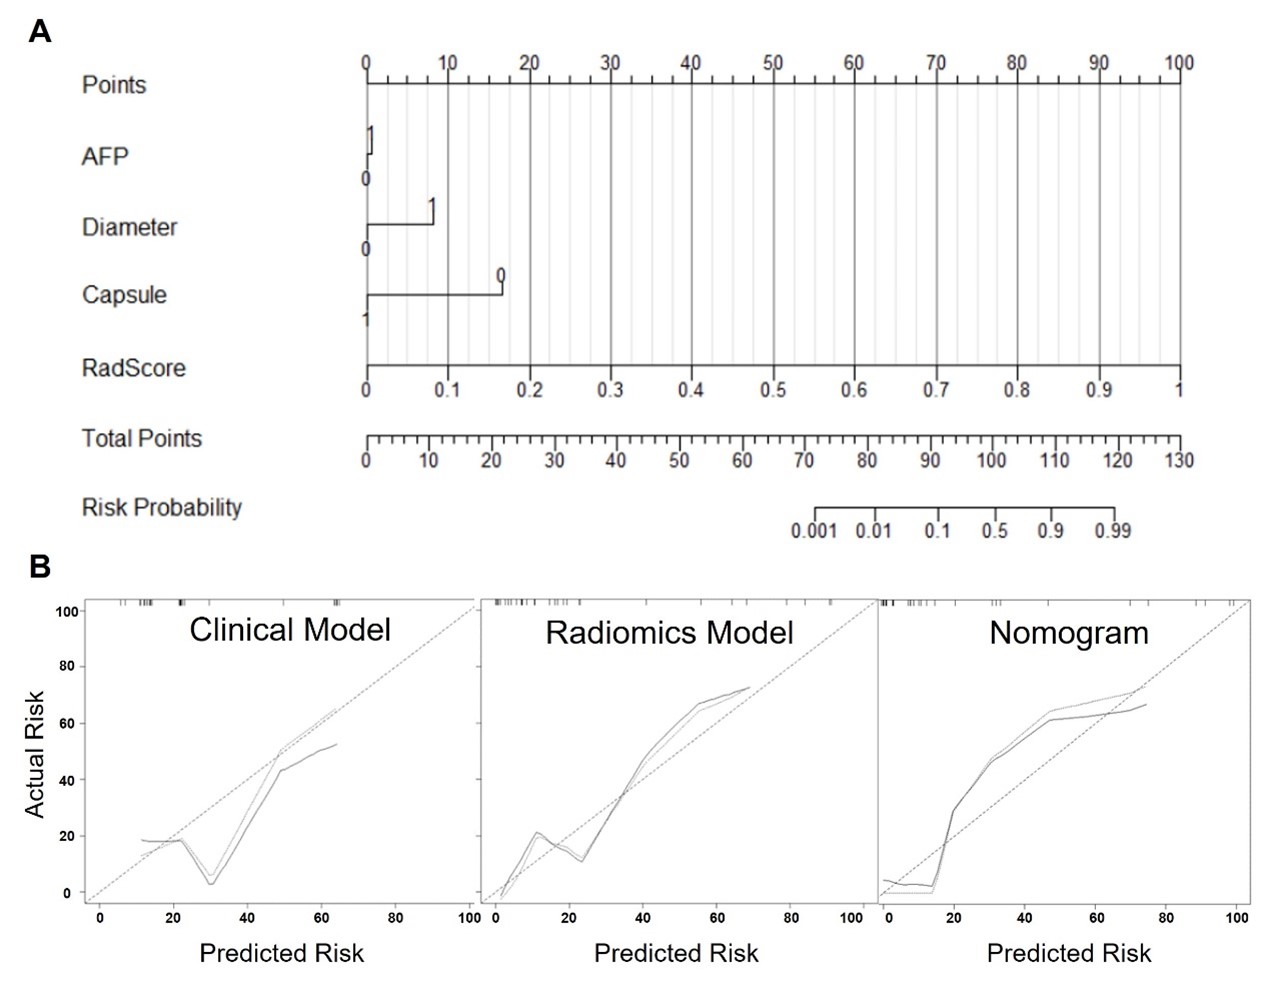
The technical flowchart of this study was shown in Figure 1. Representative MR and histopathological images were displayed in Figure 2. As shown in Figure 3, the AUC values of 24 radiomics models for training cohort were ranging from 0.7571 to 1.0000. The AUC values of 24 radiomics models for testing cohort were ranging from 0.5142 to 0.8817. The RF model (RF_RF30_SMOTE) established with the features’ subset of RF30_SMOTE yielded the best diagnostic performance for both training cohort (AUC = 1.000) and testing cohort (AUC = 0.8817). As for external validation, radiomics model — RF_RF30_SMOTE have great diagnostic performance (AUC = 0.888, specificity: 95.8%, sensitivity: 75.0%) with regard to clinical model (AUC = 0.602, sensitivity = 62.5%, specificity = 62.5%). Furthermore, a nomogram was established with Radiomics score and the independent clinical risk factors. The results showed that the nomogram showed satisfying performance for predicting the MVI status (AUC = 0.948, sensitivity = 100%, specificity = 87.5%). The calibration curve and decision curve were displayed in Figure 5.Discussion
This study showed that radiomics model showed great diagnostic performance for predicting the MVI status. Potential causes were as follows: 1) According to the aforementioned discussions, SWI is effective for capturing the intra-tumor structural variations especially in terms of abnormal vascularity. 2) High-throughput radiomics features which cannot be observed by naked eyes served as enough quantitative image biomarkers for constructing the powerful diagnostic models. Our results showed that nearly all selected features for three feature subsets belonged to the high-order features rather than the first-order features (mean, median, min, max value and so forth) widely used in daily practice. 3) Machine learning algorithms are powerful for differentiating different subtypes especially for non-linear problem.(6)Conclusion
In conclusion, this study showed that SWI-derived radiomics are valuable for noninvasively identifying the MVI status of HCC. Furthermore, the integration of radiomics and clinical factors yielded a predictive nomogram with satisfying diagnostic performance and potential clinical benefits.Acknowledgements
NoneReferences
1. Chan AW, Zhong J, Berhane S, Toyoda H, Cucchetti A, Shi K, et al. Development of pre and post-operative models to predict early recurrence of hepatocellular carcinoma after surgical resection. J Hepatol. 2018;69(6):1284-93.
2. Lauwers GY, Terris B, Balis UJ, Batts KP, Regimbeau J-M, Chang Y, et al. Prognostic histologic indicators of curatively resected hepatocellular carcinomas: a multi-institutional analysis of 425 patients with definition of a histologic prognostic index. The American journal of surgical pathology. 2002;26(1):25-34.
3. Lee S, Kim SH, Lee JE, Sinn DH, Park CK. Preoperative gadoxetic acid–enhanced MRI for predicting microvascular invasion in patients with single hepatocellular carcinoma. J Hepatol. 2017;67(3):526-34.
4. Haacke EM, Xu Y, Cheng YCN, Reichenbach JR. Susceptibility weighted imaging (SWI). Magnetic Resonance in Medicine: An Official Journal of the International Society for Magnetic Resonance in Medicine. 2004;52(3):612-8.
5. Gillies RJ, Kinahan PE, Hricak H. Radiomics: images are more than pictures, they are data. Radiology. 2016;278(2):563-77.
6. Zhang Z, Sejdić E. Radiological images and machine learning: trends, perspectives, and prospects. Comput Biol Med. 2019;108:354-70.
Figures