1476
Improved differentiation of BI-RADS 4 breast lesions based on ultrafast dynamic contrast-enhanced MRI radiomics and artificial neural network1The Third Affiliated Hospital of Zhengzhou University, Zhengzhou, China, 2General Electric (GE) Healthcare, MR Research China, Beijing, Beijing, China
Synopsis
Keywords: Breast, Radiomics
Improving the assessment of Breast Imaging Reporting and Data System (BI-RADS) 4 lesions can avoid unnecessary biopsies. As an emerging field, radiomics has been successfully explored as a means to aid decision-making for the diagnosis and risk stratification of several kinds of cancers1-4. In this study, we combined radiomics features extracted from ultrafast dynamic contrast-enhanced magnetic resonance imaging (DCE-MRI) (using the Differential sub-sampling with cartesian ordering (DISCO) technique) with an artificial neural network (ANN) to improve diagnostic performance in assessing BI-RADS 4 lesions and evaluate the potential to avoid unnecessary biopsies.Purpose
BI-RADS category 4 lesions with a varying range of probability of malignancy (2%-95%)5-6, are regarded as suspicious lesions and usually recommended for biopsy7, which may lead to a large number of negative biopsies8 as well as the psychological and financial burden for patients. As an emerging field, radiomics has been successfully explored as a means to aid decision-making for the diagnosis and risk stratification of several kinds of cancers. Ultrafast DCE-MRI is a newly proposed imaging protocol that can provide improved temporal resolution while maintaining reasonable spatial resolution9-10. The purpose of this study was (a) to investigate if combining radiomics features extracted from ultrafast imaging (using the DISCO technique) with an artificial neural network (ANN) can differentially diagnose the MR BI-RADS 4 breast lesions, (b) to determine whether and how many false-positive biopsies could be potentially avoided by comparing the results with prospectively prescribed biopsy indications by experienced breast radiologists.Methods
This retrospective study consecutively included 173 patients with 182 MR BI-RADS 4 lesions (95 benign, 87 malignant). The ultrafast imaging was performed using the DISCO technique and the tenth and fifteenth postcontrast DISCO images (hereafter DISCO-10 and DISCO-15) were selected for further analysis. An experienced radiologist used freely available software (FAE 5.0)11 to perform radiomics extraction. After principal component analysis (PCA), a multilayer perceptron artificial neural network (ANN) to distinguish between malignant and benign lesions was developed and tested using a random allocation approach. ROC analysis was performed to evaluate the diagnostic performance. All statistical analyses were performed using the statistical software SPSS version 26.0 (IBM) and MedCalc version 19.8 (MedCalc). P < 0.05 was considered statistically significant.Results
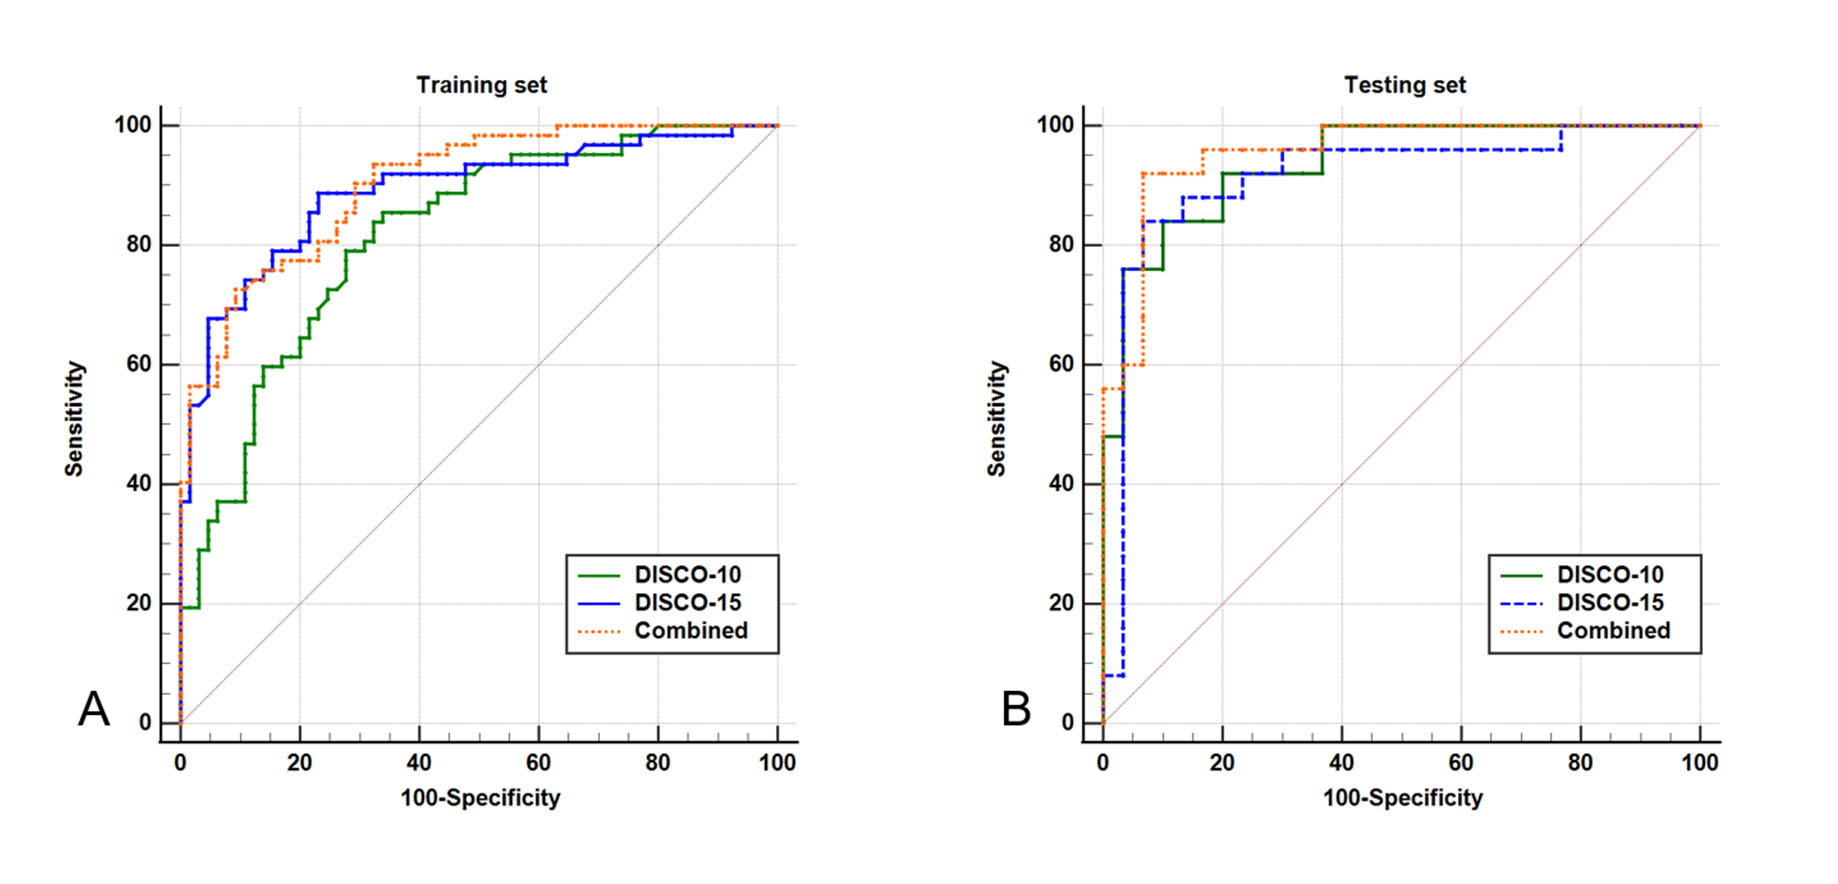
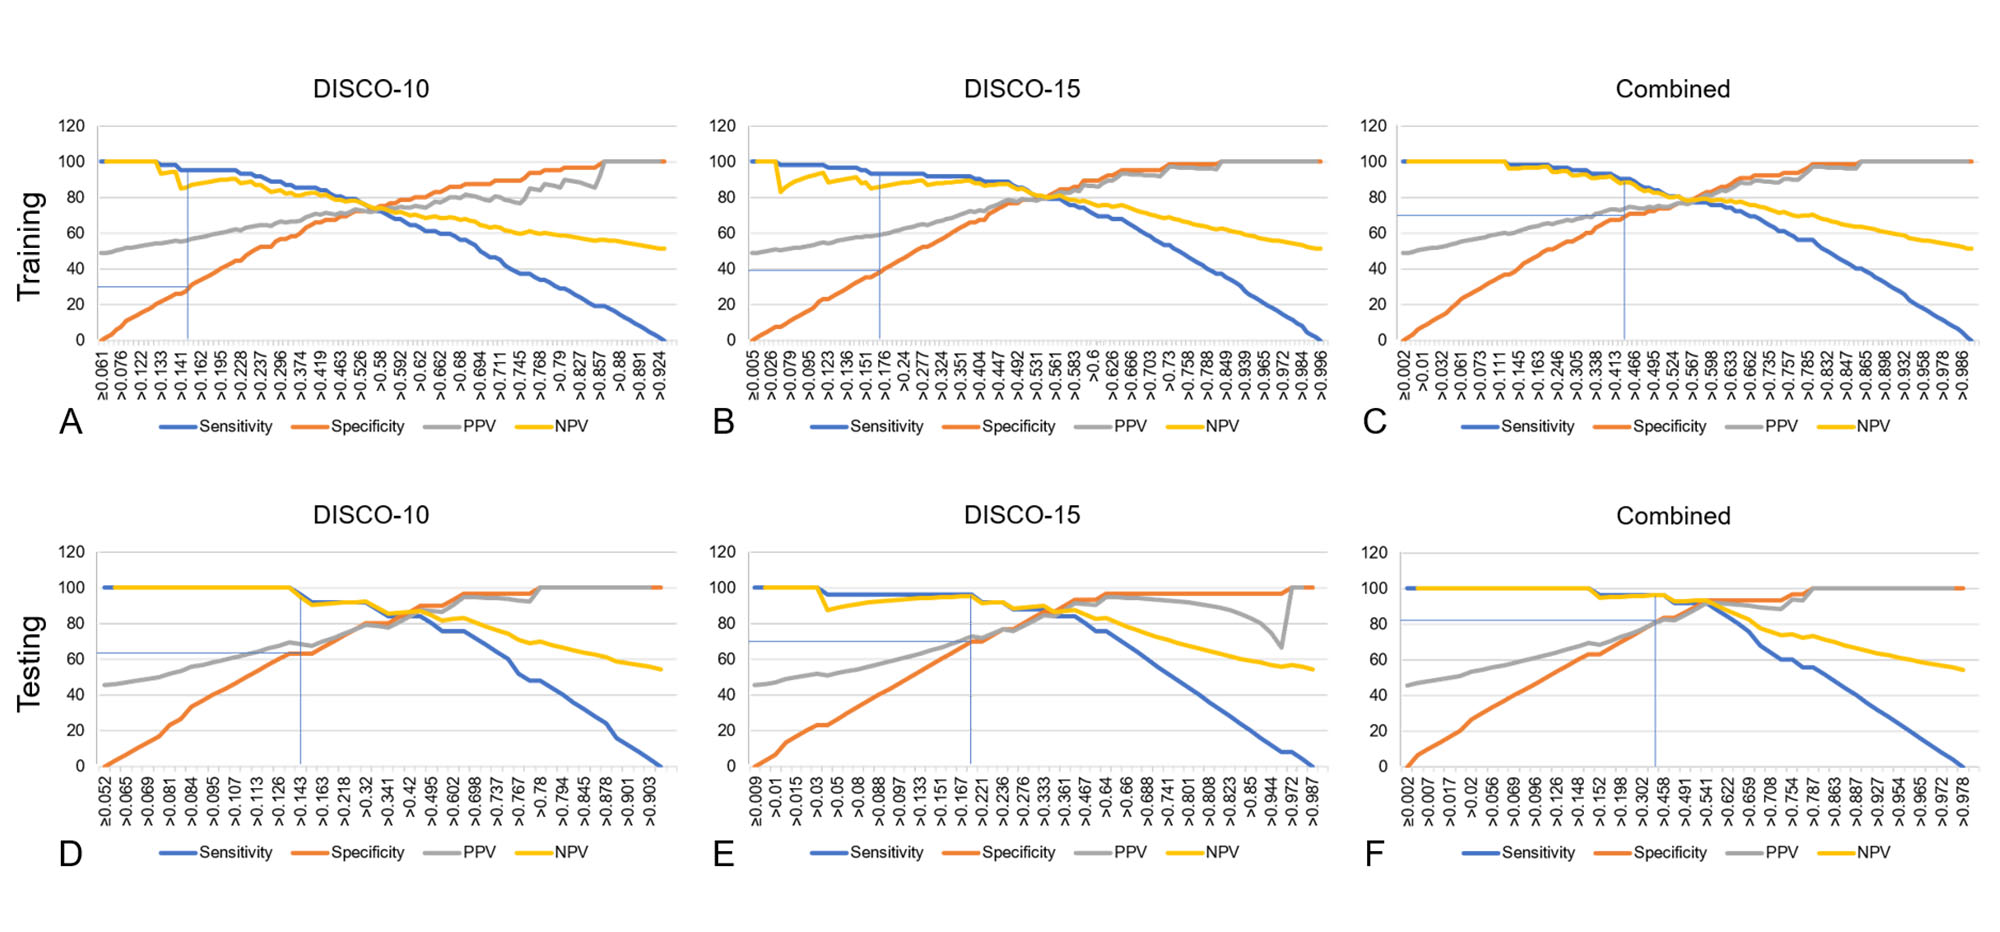
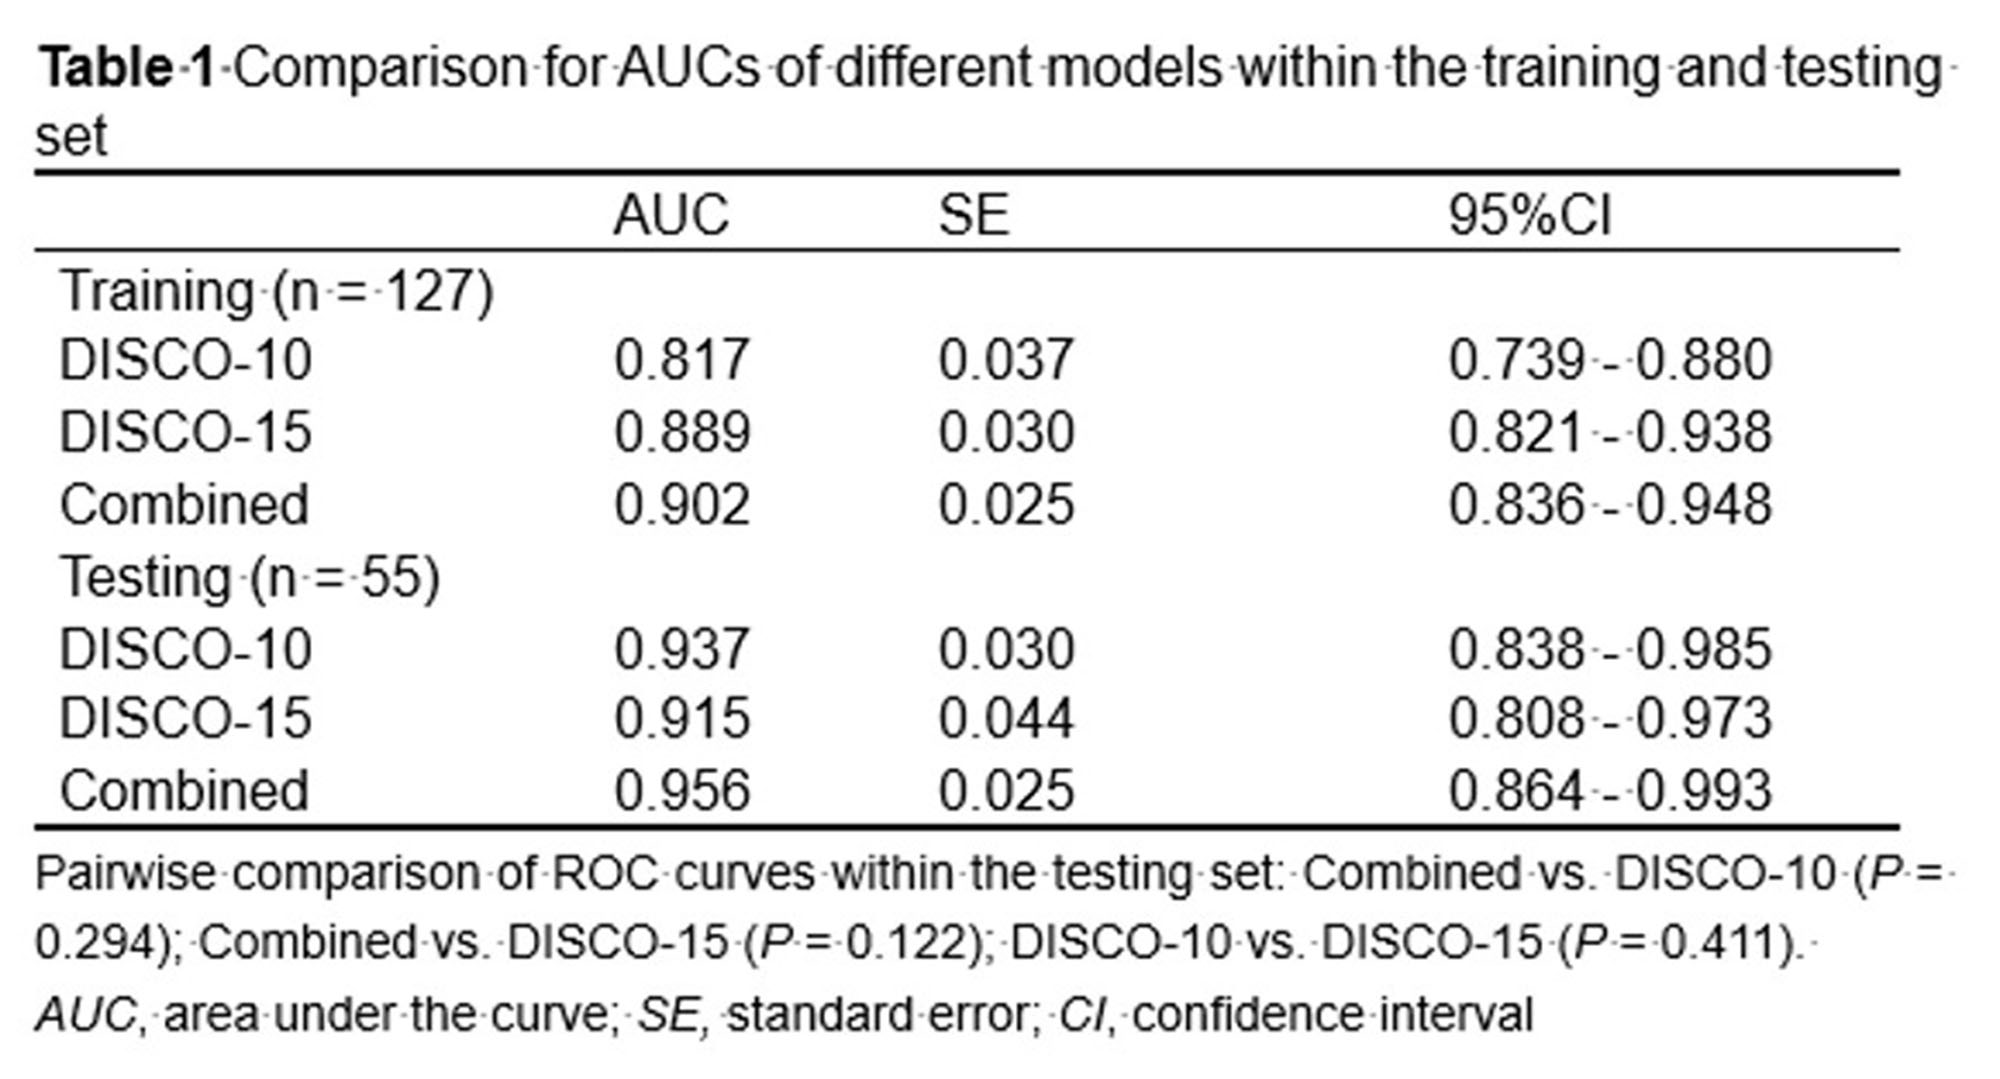
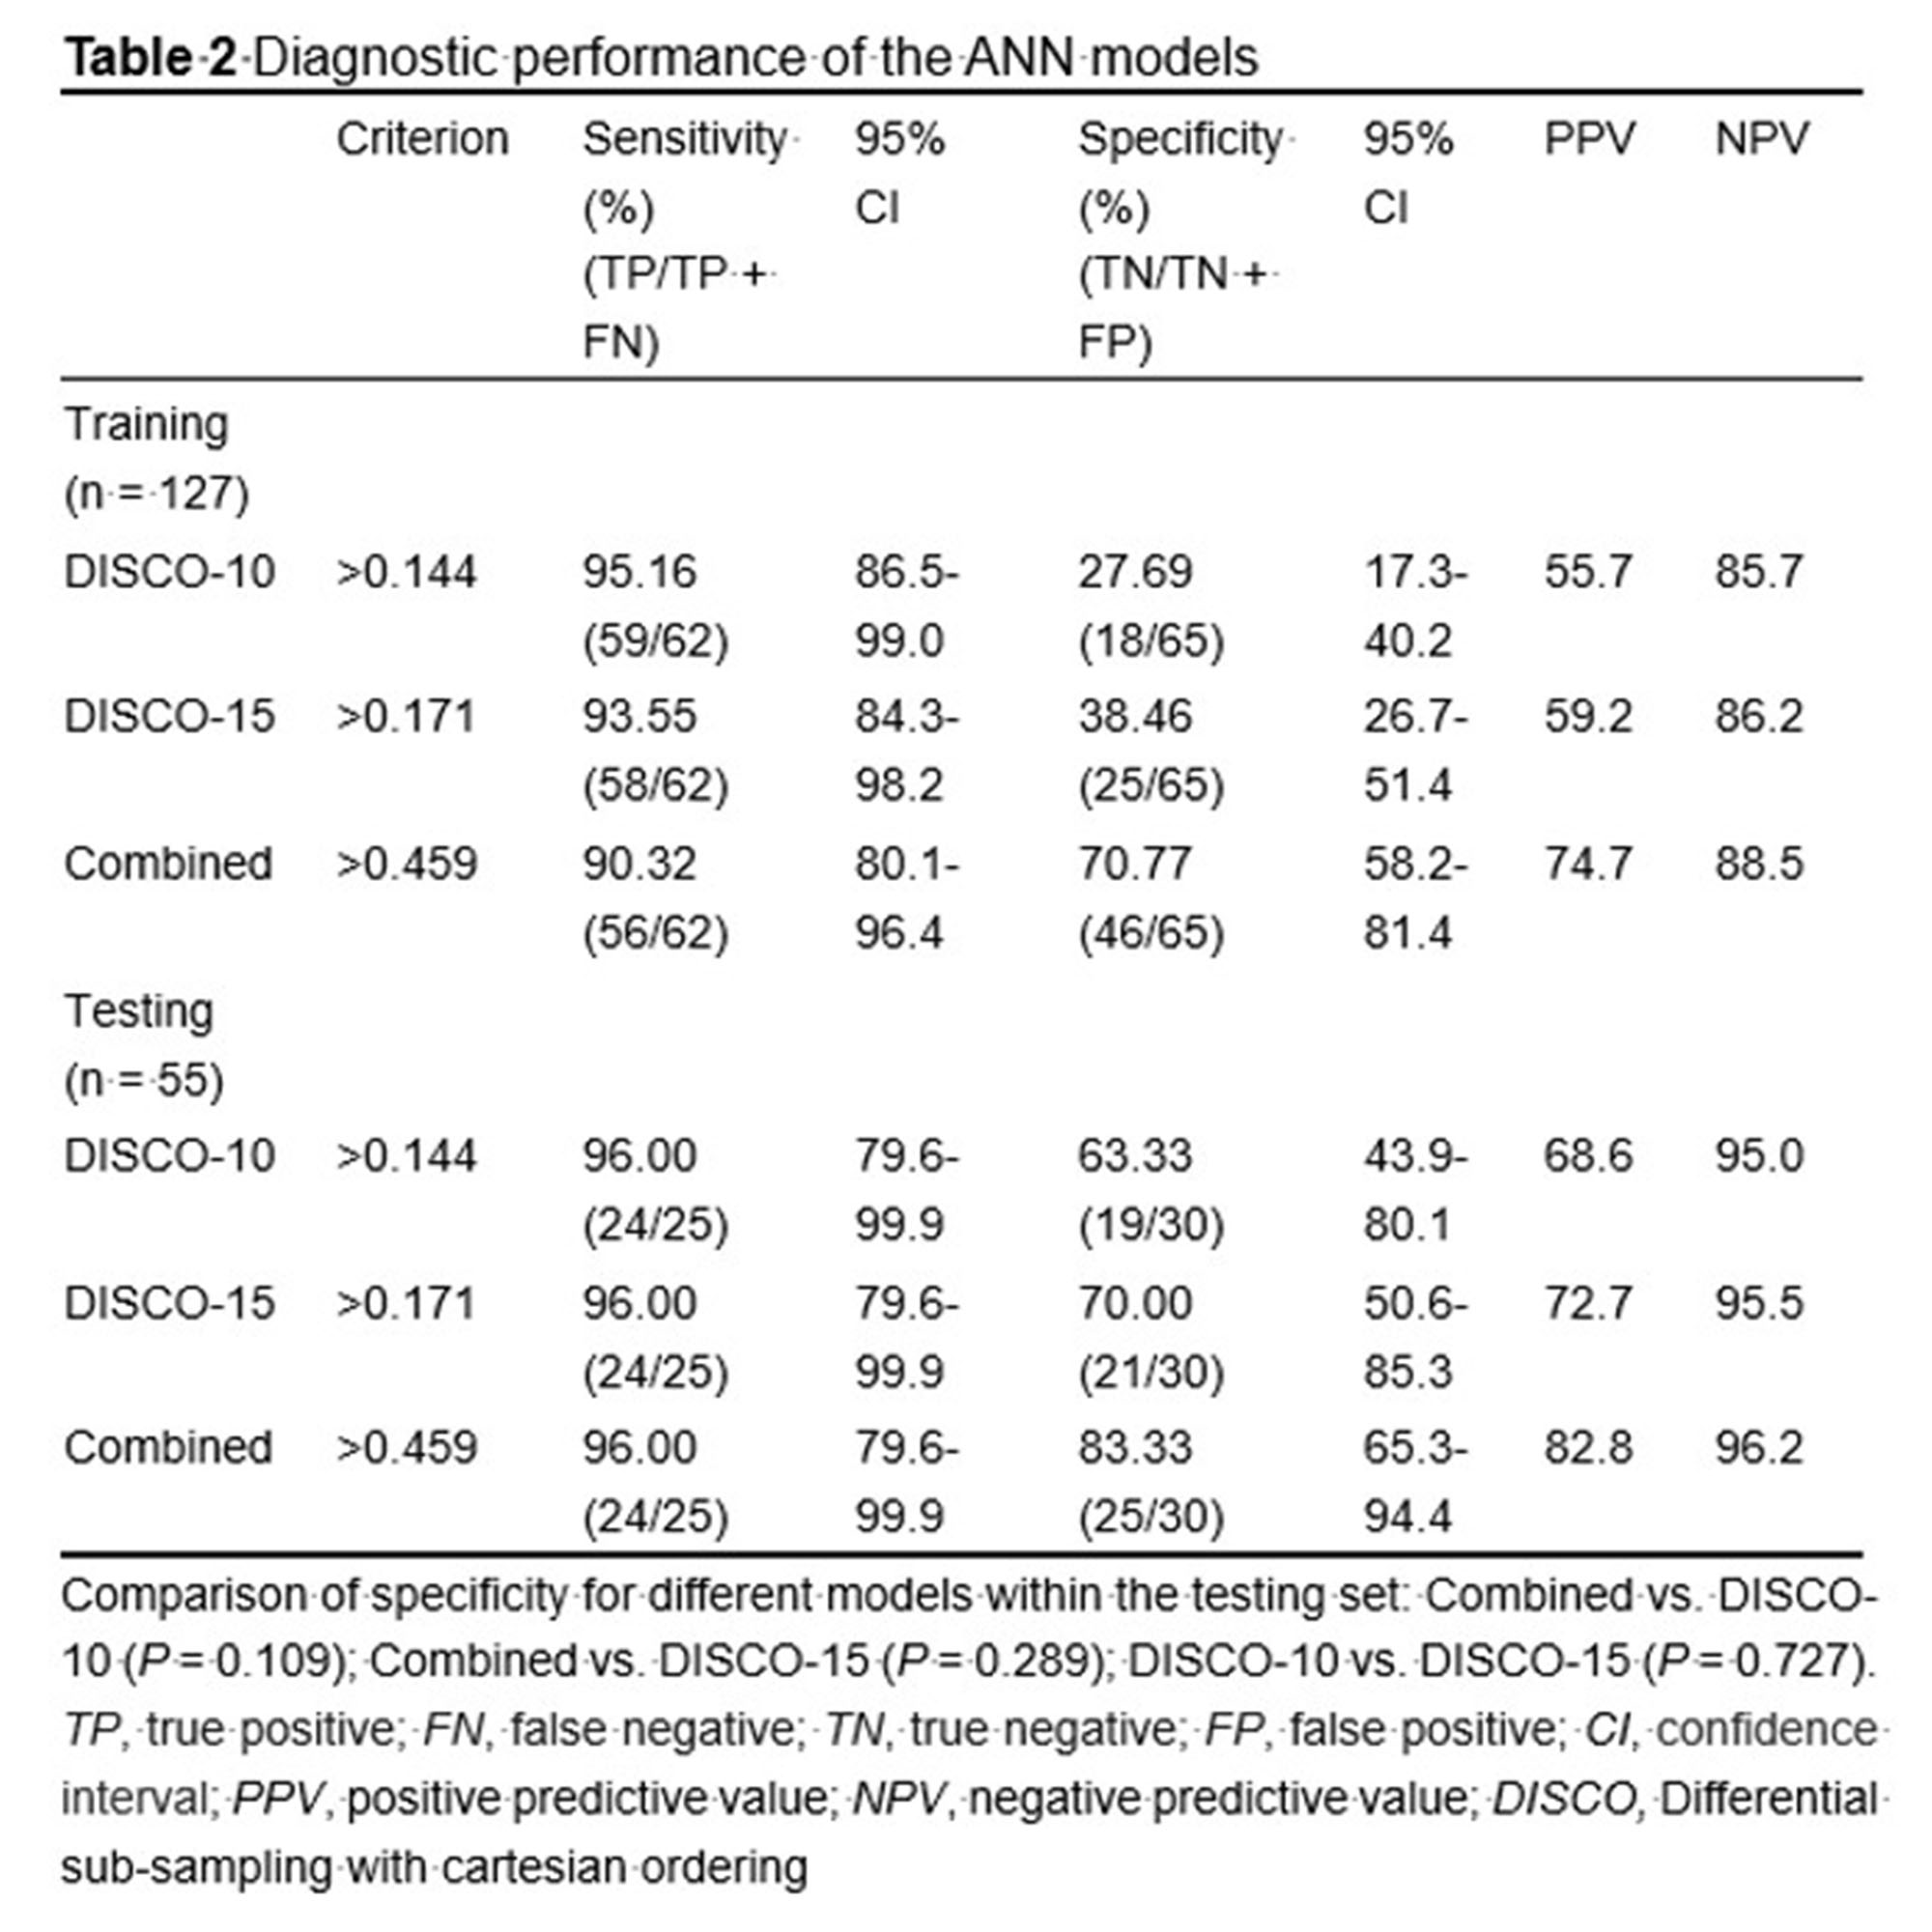
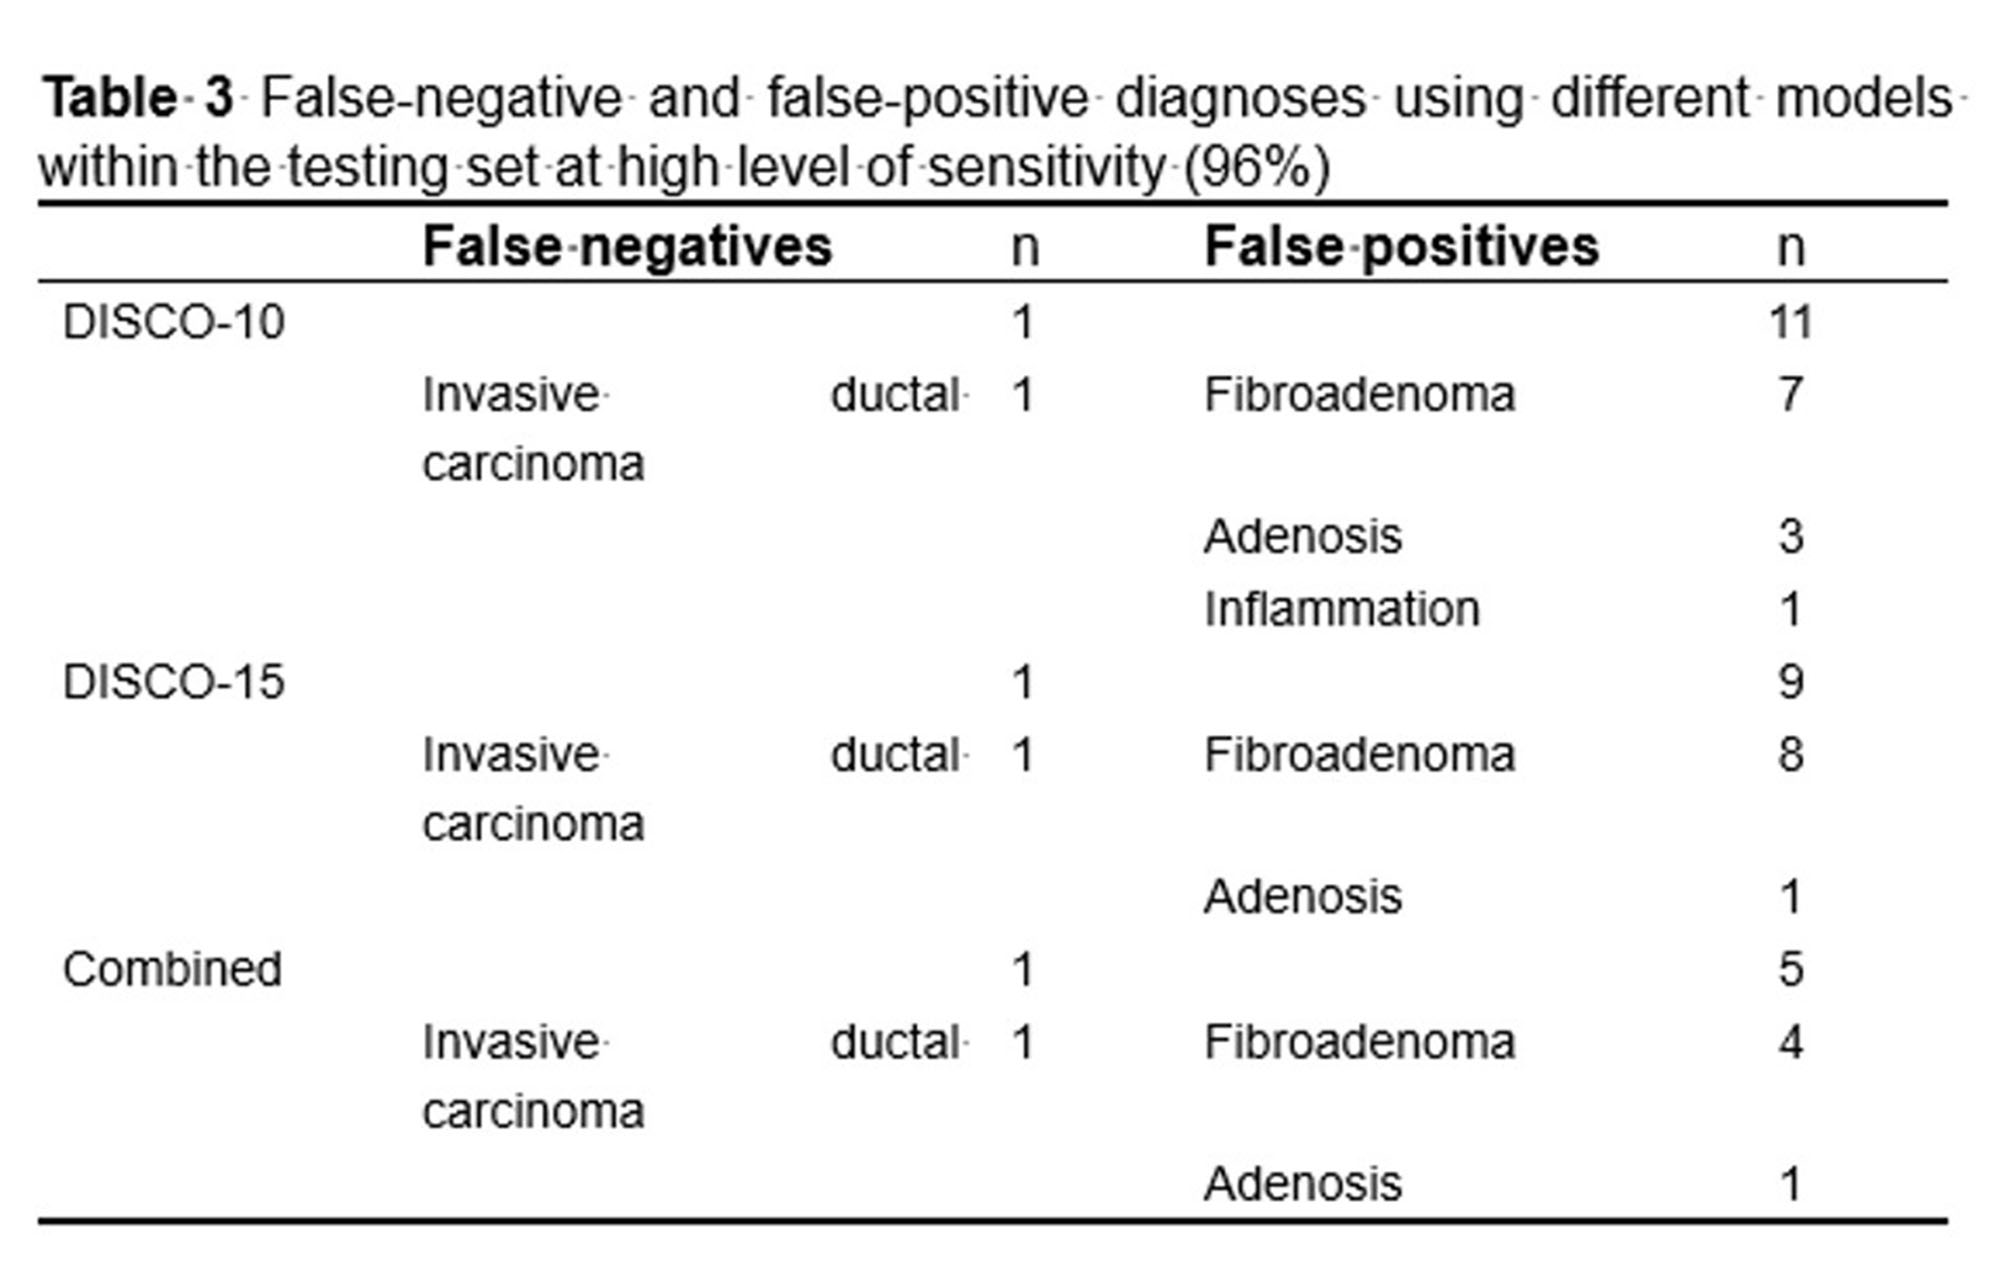
PCA was performed and yielded three categories of principal components (PC), consisting of eleven PC for DISCO-10, eleven PC for DISCO-15, and sixteen PC for their combination, respectively. The AUC of DISCO-10, DISCO-15, and their combination was 0.817 (95%CI, 0.739-0.880), 0.889 (95%CI, 0.821-0.938), and 0.902 (95%CI, 0.836-0.948) in the training dataset and 0.937 (95%CI, 0.838-0.985), 0.915 (95%CI, 0.808-0.973), and 0.956 (95%CI, 0.864-0.993) in the testing dataset, respectively (Figure 1, Table 1). Compared with the training dataset, the AUC values in the testing dataset were higher for DISCO-10 (P = 0.012), DISCO-15 (P = 0.625), and the combined method (P = 0.127), which indicated that classification models were not overfitted. On the testing dataset, the combined scheme yielded the highest AUC value compared with the single sequence radiomics model based on DISCO-10 (P = 0.294), and DISCO-15 (P = 0.122). DISCO-10 achieved a slightly higher AUC in comparison with DISCO-15 (P = 0.411).In this study, three exploratory cut-off values (> 0.144, > 0.171, > 0.459) predicted probability of malignancy were identified in the training dataset, yielding the sensitivity of 95.16%, 93.55%, 90.32%, respectively (Table 2). In the testing dataset, evaluating the diagnostic performance of the DISCO-10 using the predefined cut-off value (> 0.144) showed a sensitivity of 96% and a specificity of 63.33%. For the diagnostic performance of DISCO-15, applying the cut-off value (> 0.171) resulted in a sensitivity of 96% and a specificity of 70%. When using the exploratory cut-off value of 0.459 of the combined method, the sensitivity and specificity were 96% and 83.33%, respectively (Figure 2, Table 2). By means of three ANN models, nineteen of 30, twenty-one of 30, and twenty-five of 30 benign breast lesions were correctly diagnosed, while leading to one false-negative diagnosis respectively (Table 2).
Discussion
Radiomics is increasingly considered an important diagnostic tool, providing quantitative multi-dimensional features extracted from imaging data that may reflect the potential phenotype of tumor disease12. Many studies have shown that radiomics is useful in evaluating MR BI-RADS 4 lesions. Hu et al13 developed a radiomics nomogram based on an apparent diffusion coefficient map to differentially diagnose BI-RADS 4 findings and found a moderate diagnostic performance with an AUC of 0.79, which was lower compared to our results. The possible reason may be that the ultrafast DCE series could provide more information in differentiating breast lesions compared with ADC14. Zhang et al15 and Cui et al16 applied MRI-based radiomics models to predict the benignity and malignancy of BI-RADS 4 lesions and yielded a good diagnostic efficiency with the AUC of 0.939 and 0.94, respectively, which were comparable to our results. While in this study, the radiomics were extracted from ultrafast DCE-MRI, which appeared to reduce greatly magnet time. The exploratory cutoff at high sensitivity may be used to evaluate the number of avoidable false-positive biopsies17-19. Utilizing the radiomics derived from ultrafast DCE-MRI combined with the MLP ANN classifier, we identified that about 63.33%-83.33% of unnecessary biopsies might have been avoided in the testing dataset while maintaining a high sensitivity (96%, 24/25). Our results had the potential to provide more valuable information to support clinical decision-making.Conclusion
Our preliminary results indicated that radiomics extracted from ultrafast DCE-MRI imaging combined with the multilayer perceptron artificial neural network could differentially diagnose MR BI-RADS category 4 breast lesions with excellent diagnostic performance, and have the potential to avoid more than 63.33% of unnecessary biopsies. Further investigation with larger patient cohorts is warranted to validate our results in the future.Acknowledgements
The authors thank the support from the staff in the radiology department of The Third Affiliated Hospital of Zhengzhou University.References
1 Park JE, Ham S, Kim HS et al (2020) Diffusion and perfusion MRI radiomics obtained from deep learning segmentation provides reproducible and comparable diagnostic model to human in post-treatment glioblastoma. Eur Radiol. 10.1007/s00330-020-07414-3
2 Wu G, Jochems A, Refaee T et al (2021) Structural and functional radiomics for lung cancer. Eur J Nucl Med Mol Imaging 48:3961-3974
3 Xiao M, Ma F, Li Y et al (2020) Multiparametric MRI-Based Radiomics Nomogram for Predicting Lymph Node Metastasis in Early-Stage Cervical Cancer. J Magn Reson Imaging 52:885-896
4 Wu H, Han X, Wang Z et al (2020) Prediction of the Ki-67 marker index in hepatocellular carcinoma based on CT radiomics features. Phys Med Biol 65:235048
5 Leithner D, Wengert G, Helbich T, Morris E, Pinker K (2017) MRI in the Assessment of BI-RADS(R) 4 lesions. Top Magn Reson Imaging 26:191-199
Figures