1471
Deep Learning Strategy to Quantify Whole Prostate and Zonal Volumes, Trends in Aging and Detection of Benign Prostatic Hyperplasia1Voxelwise Imaging Technology Inc., Vancouver, BC, Canada, 2Voxelwise Imaging Technology Inc., San Francisco, CA, United States, 3Prenuvo, Vancouver, BC, Canada
Synopsis
Keywords: Prostate, Data Analysis, Artificial Intelligence/ Machine Learning
AI-assisted prostate whole-gland and zonal volume quantification enable quantitative reproducibility and enhance read-time efficiency. Our whole-gland AI-segmentation solution enhanced measurement accuracy by 23.59%, compared with traditional volume estimates. Zonal solution enabled us to generate population normative aging-curves and we used a shallow classifier to identify patients with BPH. Our findings show the transitional zone grows 2.05 ml and 3.58 ml per decade for the entire population and patients with BPH, respectively, while peripheral zone grows 0.70 ml per decade. Further, the transitional and peripheral zones grow 2.43 and 1.4 times their size over lifetime.Purpose
The traditional ruler-based technique for prostate volume assessment is a volume quantification technique dependent on geometric assumptions about prostate gland shape acquired from simple 3-axis measurements plugged into a geometric volume formula1. This indirect volume quantification method has inherent accuracy and precision limitations, which motivates the community to measure the actual volume, requiring segmenting the gland and target zones as an essential step. Moreover, this segmentation is required for localizing lesions and providing targeting for image-guided prostate biopsies2. However, manually doing the segmentation is expertise-dependent and tedious. Recently, artificial intelligence has been incorporated into prostate MRI to fix these problems2,3. Following this direction, we developed two deep learning-based models for automatically segmenting the whole prostate gland and its four zones, i.e., peripheral zone, transitional zone, central zone, and anterior fibromuscular stroma (Figure 1). Additionally, due to the limitations in the availability of medical data, there is limited research that performs analysis over a large, generally representative population. Very recently, the medical community started to collect large-scale prostate MRI data from multiple centers3. However, all in all, there are a total of 3,369 public prostate MRI scans (with overlapped cases) gathered from 17 public datasets3 that are inherently biased towards certain age-groups or conditions. Herein, in order to extract the corresponding volumes, we applied our prostate segmentation solutions to a large dataset of axial T2-weighted prostate MRI series with 4,025 subjects, obtained as part of a general preventive health whole body MRI (WB-MRI) screening program. We further sought to exploit this development to study normal aging-related changes in individual zones, which can be extracted from our population screening cohort representing all adult age-groups. A solution for classifying patients with benign prostatic hyperplasia (BPH) is also proposed.Material and Method
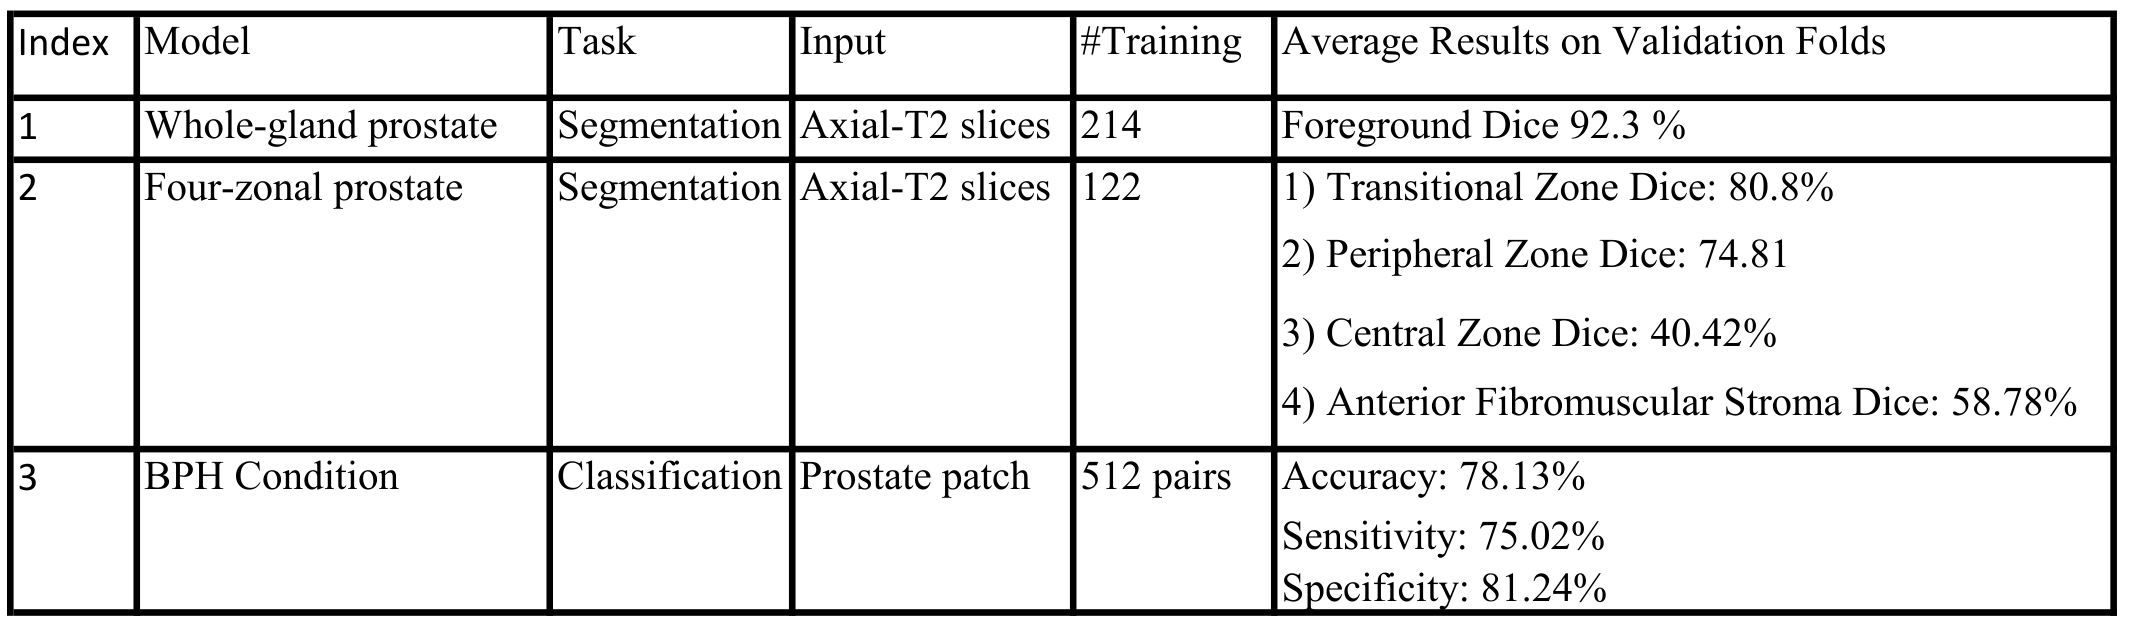
For the whole-gland and four zonal segmentations, nnU-Net4 semantic segmentation framework is trained on 214 and 122 axial T2-weighted scans from our in-house data in a supervised manner. Given the relevance of zonal anatomy for studying prostatic conditions, the training samples are chosen from a balanced dataset of healthy and unhealthy cases with a uniform distribution of common prostatic conditions from 17 to 90 years old. For testing over a large representative population, a total of 4025 prostate axial T2-weighted scans are used. These series were obtained as part of WB-MRI protocols in a preventative health screening program. Also, the BPH shallow network consists of four convolutional blocks and a linear block, implemented in PyTorch Lightning5 framework, and trained on 512 pairs of prostate patches for patients delineated with and without BPH in our radiology reports. The prostate patches are obtained by computing the 3D-bounding box around the predicted prostate mask for axial T2-weighted images.Experiment and Discussion
Traditionally, radiologists measure the dimensions of the prostate and estimate the volume of the whole-gland using the following formula:$$V_{Estimated} = \mu * L * W * H $$
where $$$V_{Estimated}$$$ , $$$\mu$$$ , $$$L$$$, $$$W$$$, $$$H$$$ are estimated prostate volume, shape coefficient [1], manually measured length, width, and height of the prostate, respectively. However, the shape coefficient is based on geometric assumptions about the shape of the prostate gland, resulting in a significant error in the estimated volume. Herein, for the subset of cases (N=2842) where accompanying radiologist reports specified manual measurement for the 3-axes of the prostate, we calculated traditional estimated prostate volumes using ellipsoid and bullet-shaped volume formulas [1] with the radiologist's provided inputs and compared them to volumes extracted from our whole-gland segmentation technique. As shown in Table 1, we obtained up to a 23.59% improvement in volume quantification accuracy by computing the actual volume using the proposed AI-driven approach. Further, using the actual volumes measured by AI and the manual 3-axis measurements in the reports, the optimal shape coefficient for our large-scale data was calculated to be 0.6479, which is almost equivalent to the bullet-shape coefficient.
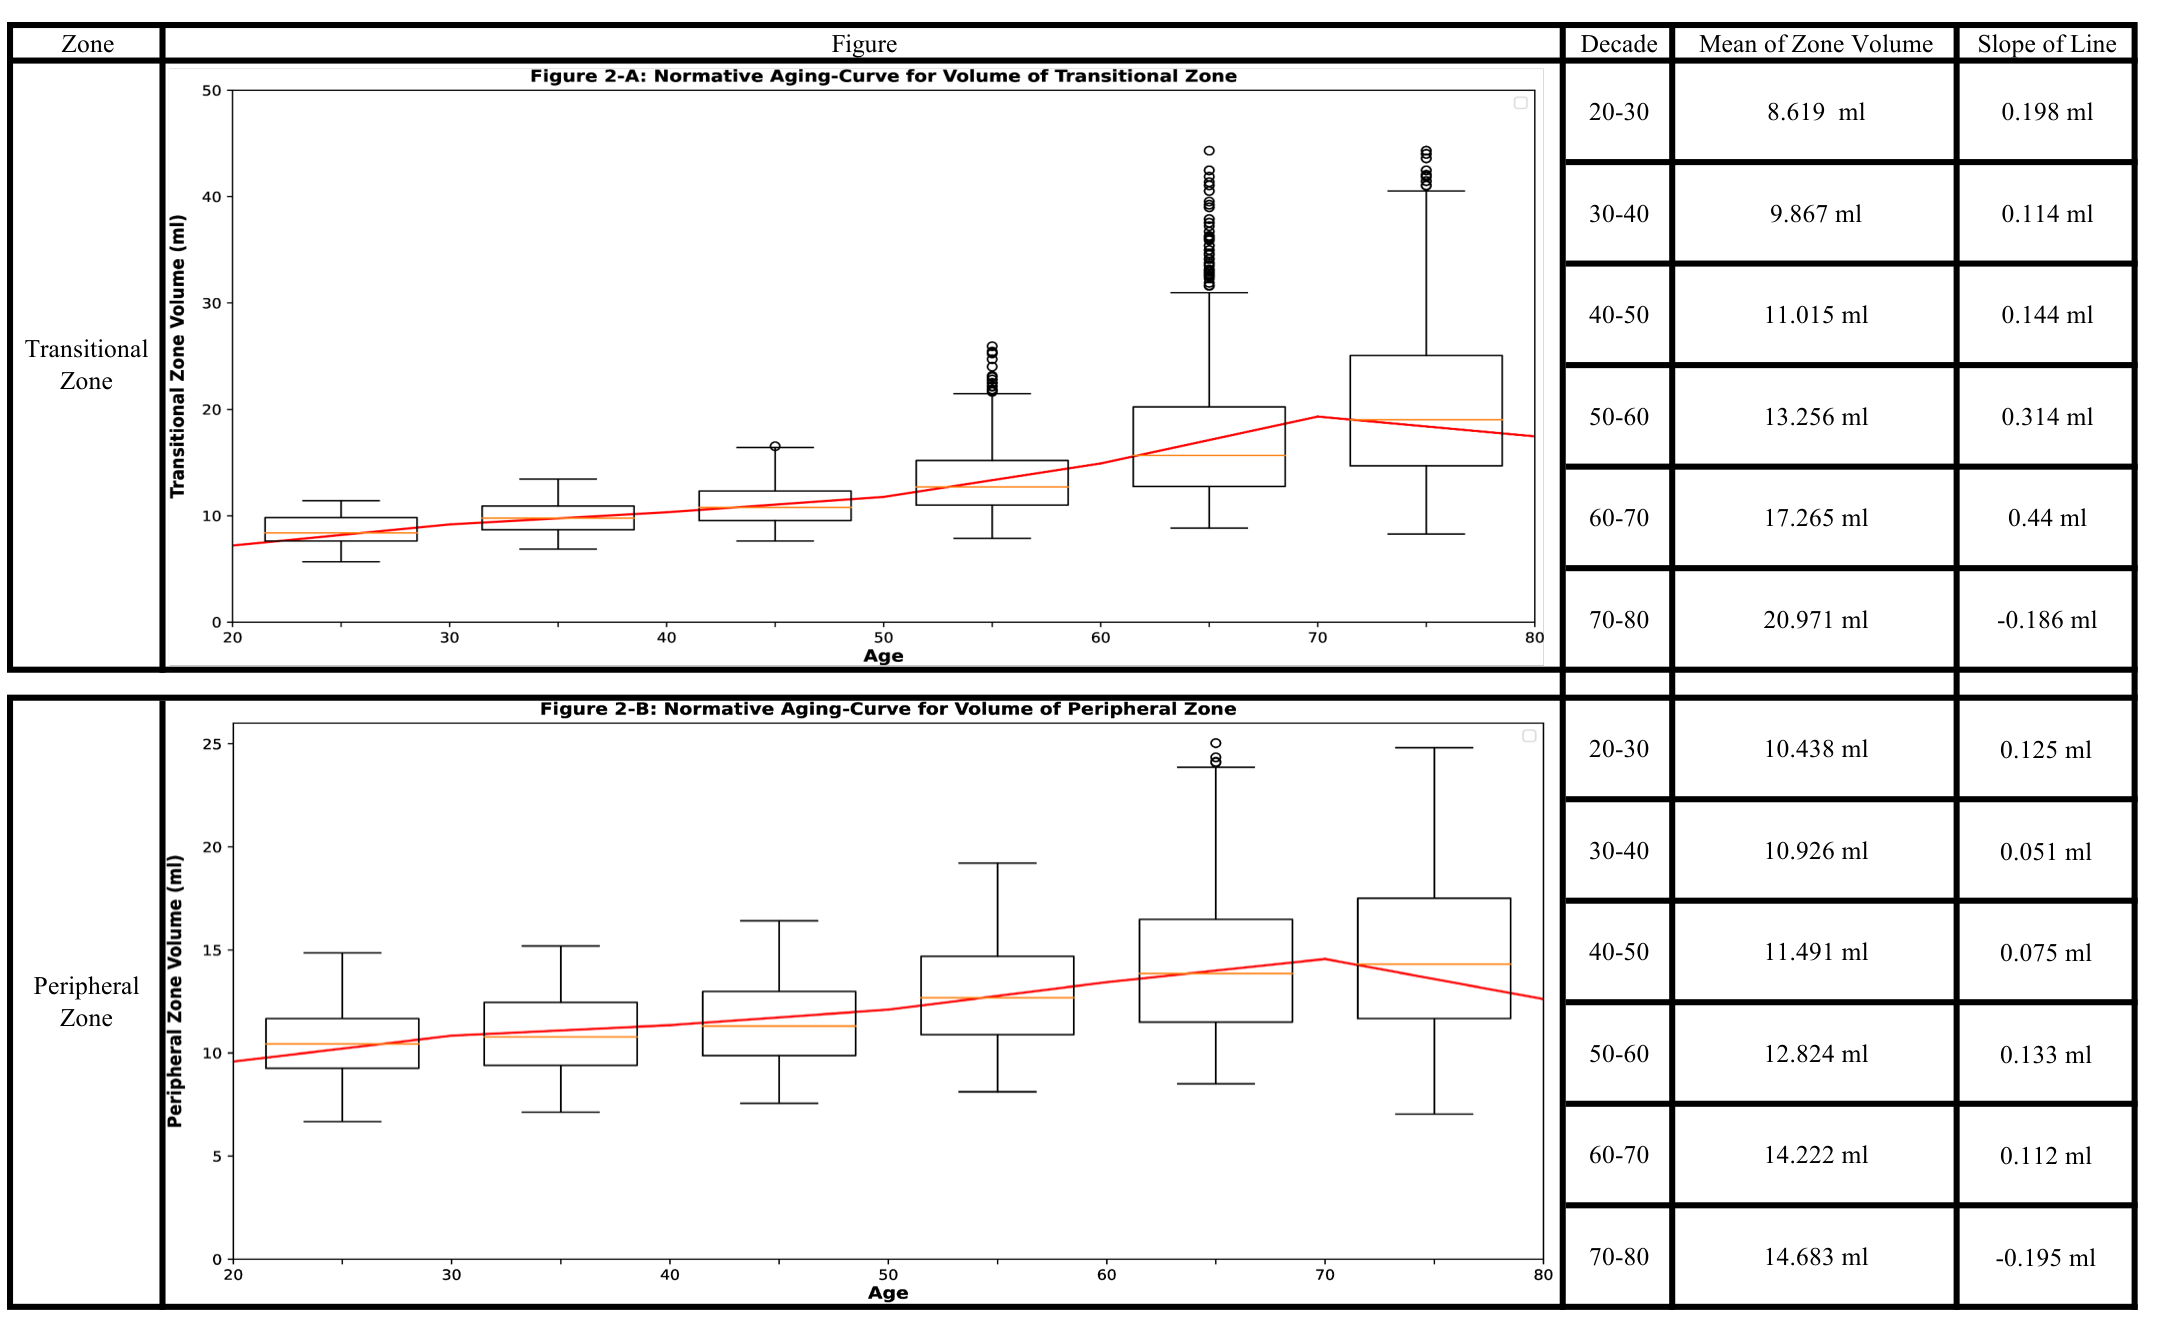
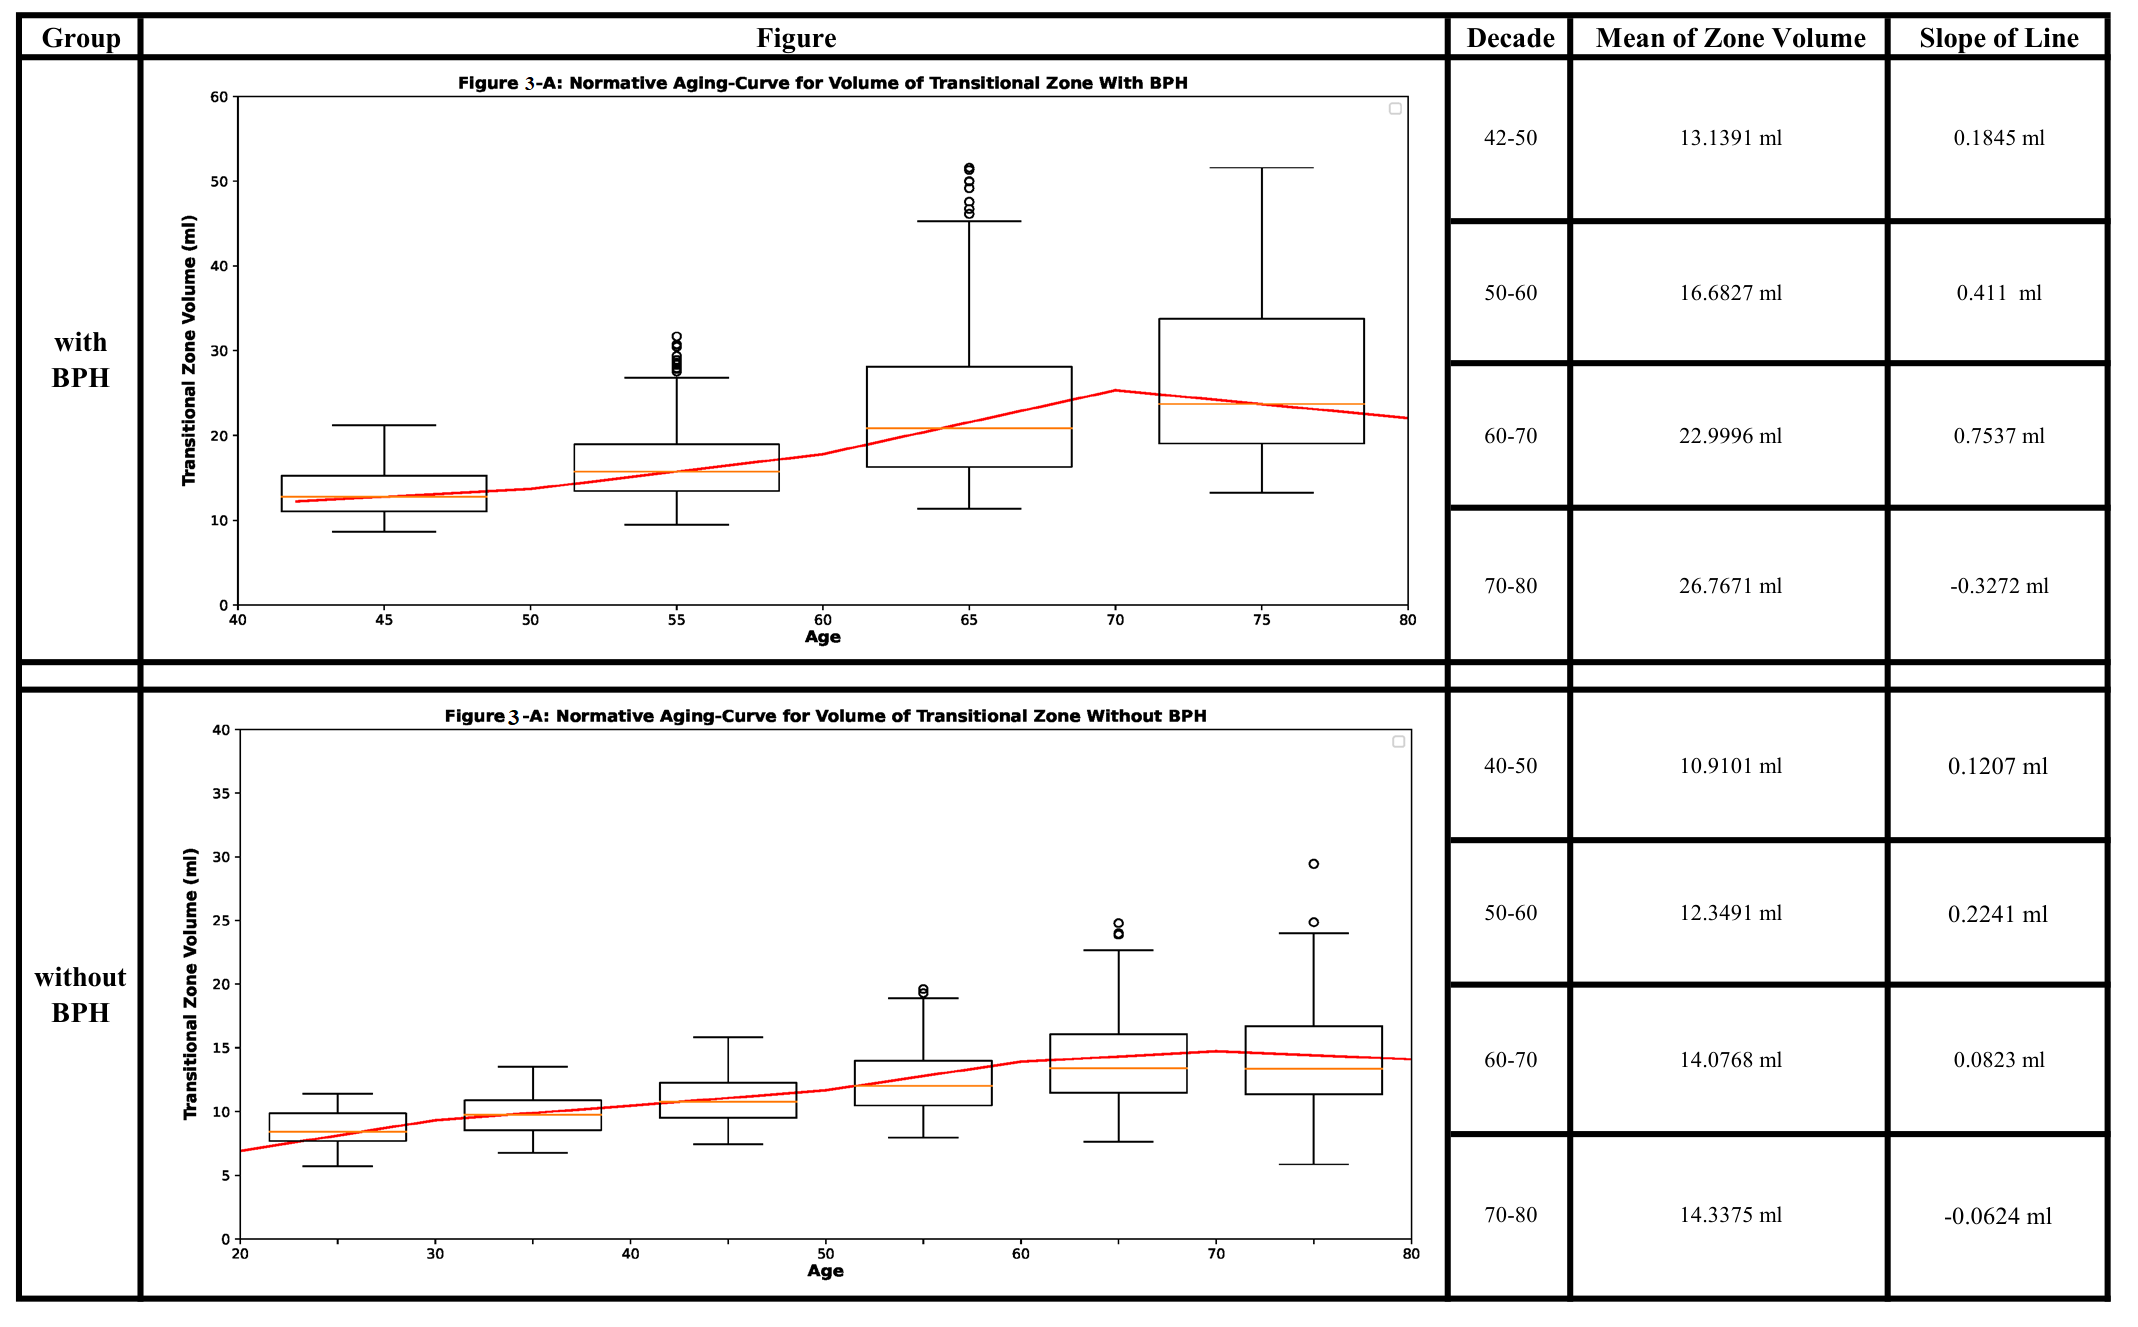
Additionally, based on the obtained zonal masks, we extracted the normative aging-curves using our large, generally representative population ranging from 20 to 80 years (Figure 2). The abnormal increase in the volume of the transitional zone could be the result of developing BPH. To study it further, we divided the subset of our data (N=2842) into two groups depending on the existence of BPH as described in the radiology reports. The aging curves for the two groups were then extracted (Figure 3). Our analysis shows that the transitional zone grows by 2.05 ml for the entire population. When divided by occurrence of BPH, the rate of increase is 3.58 ml per decade for those with BPH and 0.85 ml per decade for those without BPH. The peripheral zone grows by 0.70 ml per decade for the entire population. Overall, the transitional and peripheral zones grows by 2.43 and 1.4 times their size over the patients lifespan.
Note that all the three proposed networks are trained in 5-fold cross-validation manner, and the average results on validation folds are shown in Table 2.
Conclusion
By improving the accuracy and efficiency of measurements, artificial intelligence can play a significant role in standardizing the volume quantification for the prostate and its zones.Acknowledgements
We would like to thank the MRI Technologists, Patient Care, and Backend teams at Prenuvo for their contributions in data acquisition.References
1. MacMahon, Peter J., et al. "Modified prostate volume algorithm improves transrectal US volume estimation in men presenting for prostate brachytherapy." Radiology 250.1 (2009): 273-280.
2. Khan, Zia, et al. "Recent automatic segmentation algorithms of MRI prostate regions: a review." IEEE Access (2021).
3. Sunoqrot, Mohammed RS, et al. "Artificial intelligence for prostate MRI: open datasets, available applications, and grand challenges." European Radiology Experimental 6.1 (2022): 1-13.
4. Isensee, Fabian, et al. "nnU-Net: a self-configuring method for deep learning-based biomedical image segmentation." Nature methods 18.2 (2021): 203-211.
5. https://github.com/PyTorchLightning/pytorch-lightning
Figures
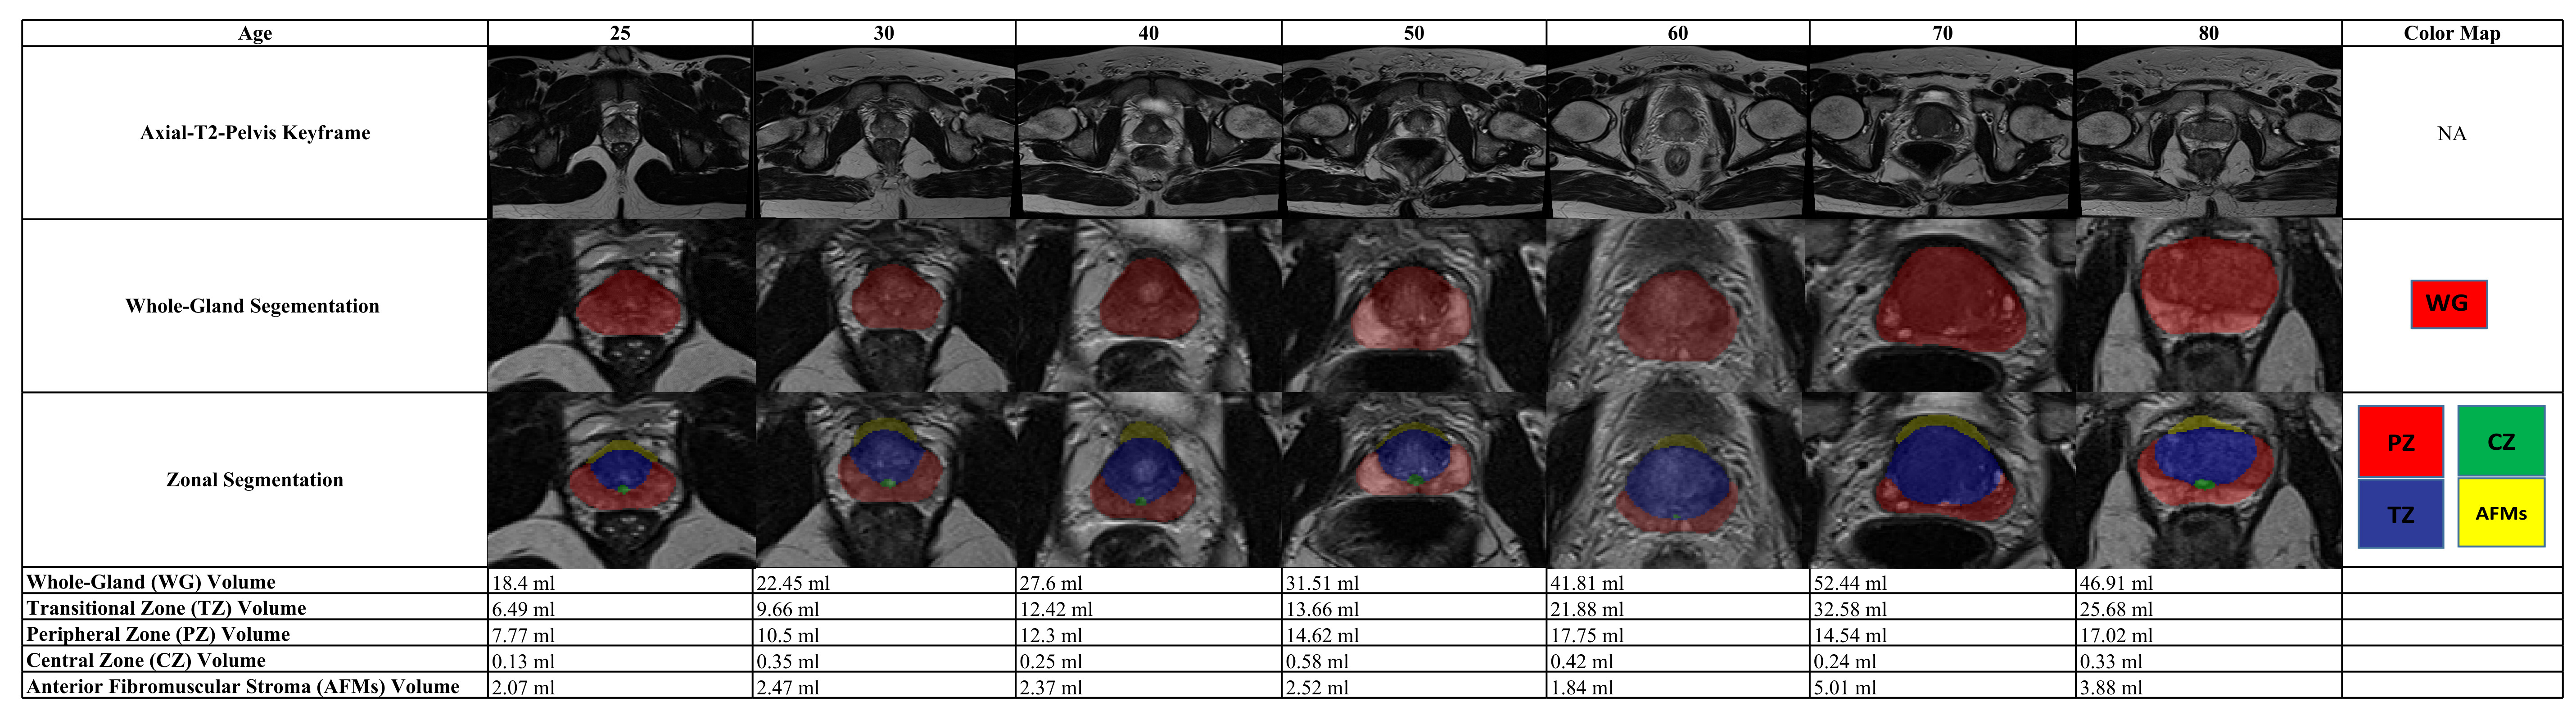
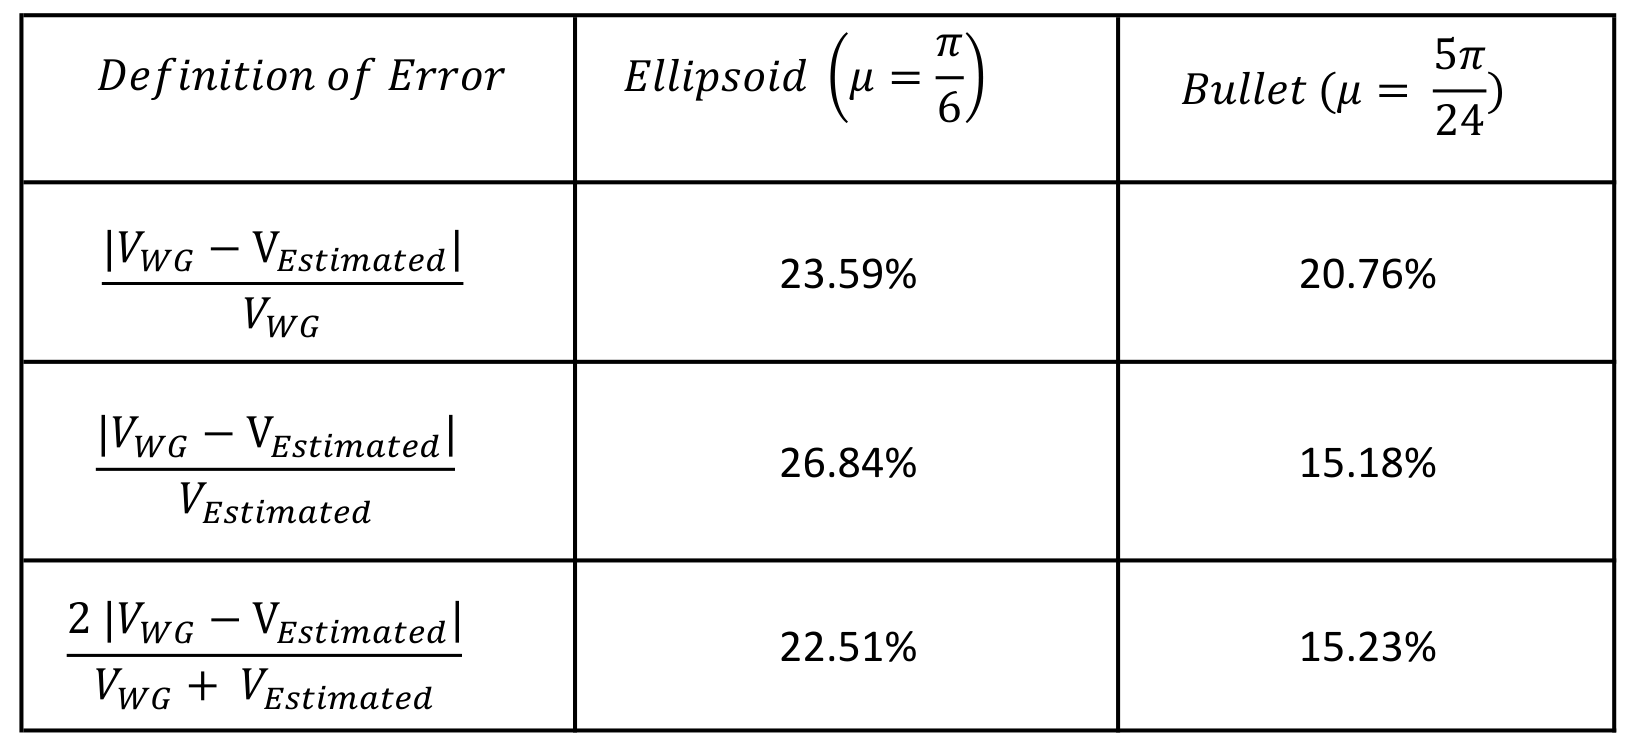
Table 1: Average error in calculating the estimated prostate volume ($$$V_{Estimated}$$$) using manually measured dimensions plugged into the geometric volume formula compared with the actual volume ($$$V_{WG} $$$) measured based on the prostate mask obtained from the proposed whole-gland AI-segmentation solution.