1470
Delta-Radiomic Based on Dynamic Contrast Enhanced MRI Predicts axillary Response after neoadjuvant chemotherapy in breast cancer patients
Shasha Liu1, Siyao DU1, Si Gao1, Lizhi Xie2, Yuee Teng3, Feng Jin4, and Lina Zhang1
1Department of Radiology, The First Hospital of China Medical University, shenyang, China, 2MR Research, GE Healthcare, Beijing, China, 3Departments of Medical Oncology and Thoracic Surgery, The First Hospital of China Medical University, shenyang, China, 4Department of Breast Surgery, The First Hospital of China Medical University, shenyang, China
1Department of Radiology, The First Hospital of China Medical University, shenyang, China, 2MR Research, GE Healthcare, Beijing, China, 3Departments of Medical Oncology and Thoracic Surgery, The First Hospital of China Medical University, shenyang, China, 4Department of Breast Surgery, The First Hospital of China Medical University, shenyang, China
Synopsis
Keywords: Breast, Radiomics, DCE-MRI
This prospective study with multiple follow-up time points investigated the early predictive value of the delta-radiomic model of axillary lymph node (ALN) using dynamic contrast-enhanced (DCE) MRI for axillary pathological complete response (pCR) in breast cancer patients after neoadjuvant chemotherapy (NAC). The results indicated that the delta-radiomic model based on early changes of ALN features performed better among all radiomic models. Moreover, when combined with clinical features, the combined model achieved the best diagnostic performance of any model we tested. The delta-radiomic + clinical model may be a promising method for ALN pCR prediction in the initial phase of NAC.Abstract
Purpose
The objective of this paper is to explore the value of a delta-radiomic model of the axillary lymph node (ALN) using dynamic contrast-enhanced (DCE) MRI for early prediction of the axillary pathological complete response (pCR) of breast cancer patients after neoadjuvant chemotherapy (NAC).Methods
A total of 120 patients with ALN-positive breast cancer who underwent breast MRI before (within one week prior to NAC) and after their first cycle of NAC (within 72h before the second cycle of NAC) between October, 2018 and May 2021 were prospectively included in this study. Figure 1 shows a flowchart of patient collection. Both breast MRI examinations were performed with a 3T MR scanner (SIGNATM Pioneer, GE Healthcare, Milwaukee, WI, USA) with an 8-channel phased-array breast coil. A T1-weighted DCE-MRI sequence (one pre-contrast phase and 20 post-contrast phases) was obtained using the three-dimensional (3D) Differential Subsampling with Cartesian Ordering (DISCO) technique (GE Healthcare). The DCE sequence total scan time was 6min48s. Patients were divided into a training (n=84) and validation (n=36) cohort based on the temporal order of their treatments. 2D region of interest (ROI) at the maximum cross-sectional area of one selected ALN was manually segmented on the peak contrast phase (136 s after contrast injection according to the DCE curve) by using the open-source ITK-snap software (www.itksnap.org, version 3.8.0). Radiomic features were extracted from the largest slice of targeted ALN on DCE-MRI using Analysis Kit software (A.K., GE Healthcare) at pretreatment and after the first-cycle of NAC, and the changes (delta-radiomic features) were calculated and recorded. Clinical information including patient age, menopausal status, estrogen receptor (ER) and progesterone receptor (PR) levels, human epidermal growth factor receptor-2 (HER2) levels, Ki-67 status, molecular subtypes, and clinical T/N staging data were all collected. Clinicopathological characteristics were compared using the Mann-Whitney U test for continuous variables and the chi-square or Fisher’s exact tests for categorical variables. Logistic regression was then applied to build radiomic models using the pretreatment (pre-), first-cycle(1st-), and changes (delta-) radiomic features separately. A clinical model was also built and combined with the radiomic models. We developed an individualized nomogram for visualization. The models were evaluated by discrimination, calibration, and clinical application and compared using DeLong test. Figure 2 shows the workflow of the critical steps.Results
Axillary pCR was observed in 53 (44.2%) cases (training cohort, n = 37; validation cohort, n = 16). The ER, PR, and HER2 expression and molecular subtype (p<0.05) in the training cohort were initially included to build the clinical model, and the stepwise method mentioned above preserved only ER and HER2 expression as independent predictors in the final clinical model. Figure 3 shows the ROC curves for all models. Among the three radiomic models, the ALN delta-radiomic model performed the best with AUCs of 0.851 (95% CI: 0.770-0.932) and 0.822 (95% CI: 0.685-0.958) in the training and validation cohorts, respectively. The clinical model (ER and HER2) yielded moderate AUCs of 0.742 (95% CI: 0.637-0.846) and 0.723 (95% CI: 0.550-0.896), respectively. After combining clinical features to the delta-radiomics model, the efficacy of the combined model (AUC=0.932) in the training cohort was significantly higher than that of both the delta-radiomic model (Delong p=0.017) and the clinical model (Delong p<0.001) individually. Additionally, in the validation cohort, the combined model had the highest AUC (0.859) of any of the models we tested although this was not statistically different from any other individual model’s validation AUC. The calibration curves showed agreement between the predictions and actual observations of the nomogram (Figure 4A) in both the training (Figure 4B) and validation cohorts (Figure 4C). Decision curves showed a high clinical benefit for the combined model in both the training (Figure 5A) and validation cohorts (Figure 5B).Discussion
We investigated the performance of ALN-related radiomic models for axillary pCR prediction at baseline and after early-treatment and also investigate the changes between these two points. Our result indicated the delta-radiomic + clinical model that incorporates clinical and ALN-MRI features may be a promising method for ALN pCR prediction in the initial phase of NAC and for further treatment decisions. Of the three radiomic models we constructed, the ALN delta-radiomic model showed the highest predictive value. Intratumor heterogeneity drives neoplastic progression and therapeutic response1, 2 and changes dynamically accompanied by size changes after treatment1. Delta-radiomics can show the heterogeneity of changing information, which is ignored by single time-point models3, 4. This result implicates the importance of introducing ALN features for breast cancer model building. Our study advanced the predictive time-point to one-cycle treatment and presented the early changes of ALN radiomic features associated with treatment response after NAC. Early adjustment of treatment regimens may be able to improve axillary pCR rates. For our delta-radiomic model, the first-cycle may be the only feasible time-point: treatment-driven ALN shrinkage makes it difficult to identify and obtain reliable radiomic features.Conclusion
This preliminary study indicates that ALN-based delta-radiomic model combined with clinical features is a promising strategy for the early prediction of downstaging ALN status after NAC. Future axillary MRI applications need to be further explored.Keywords
Axillary lymph node, DCE-MRI, Radiomics, Neoadjuvant Chemotherapy, pathological complete responseAcknowledgements
No.References
1. O'Connor JP, Rose CJ, Waterton JC, et al. Imaging intratumor heterogeneity: role in therapy response, resistance, and clinical outcome. Clin Cancer Res. 2015;21(2):249-257.
2. Vogelstein B, Papadopoulos N, Velculescu VE, et al. Cancer genome landscapes. Science. 2013;339(6127):1546-1558.
3. Crombe A, Perier C, Kind M, et al. T2 -based MRI Delta-radiomics improve response prediction in soft-tissue sarcomas treated by neoadjuvant chemotherapy. J Magn Reson Imaging. 2019;50(2):497-510.
4. Lin P, Yang PF, Chen S, et al. A Delta-radiomics model for preoperative evaluation of Neoadjuvant chemotherapy response in high-grade osteosarcoma. Cancer Imaging. 2020;20(1):7.
Figures
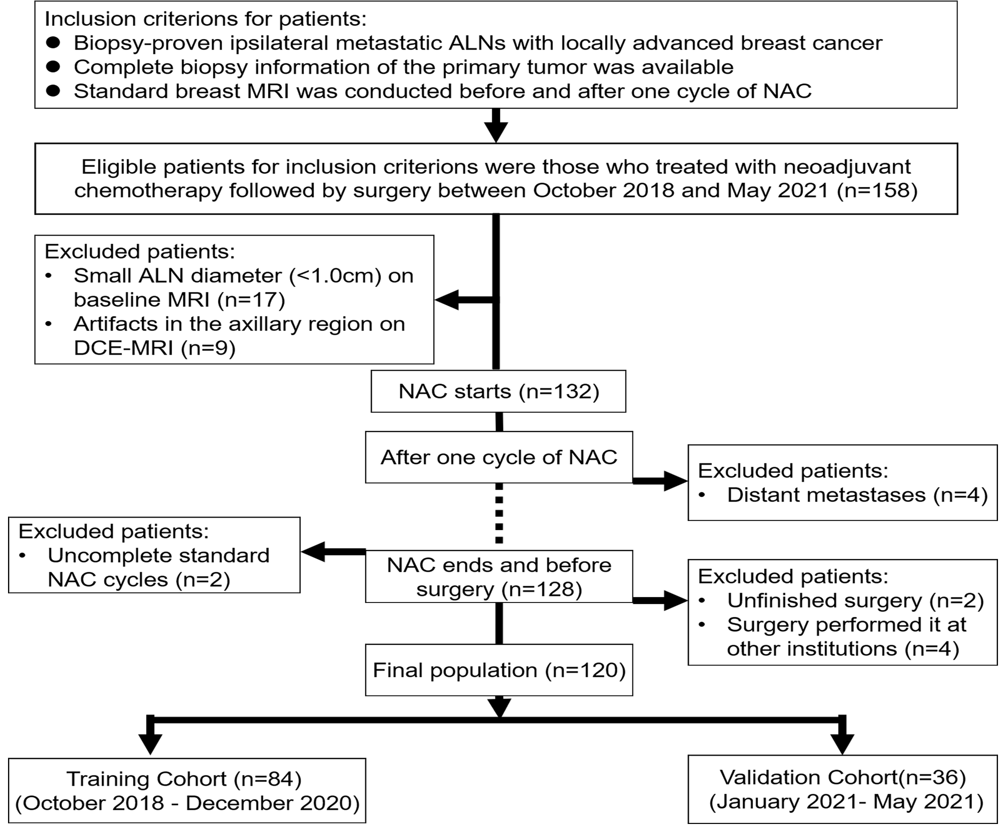
Figure 1 Flowchart
of patient recruitment pathway. ALN axillary Lymph nodes, NAC neoadjuvant
chemotherapy, DCE dynamic contrast enhanced
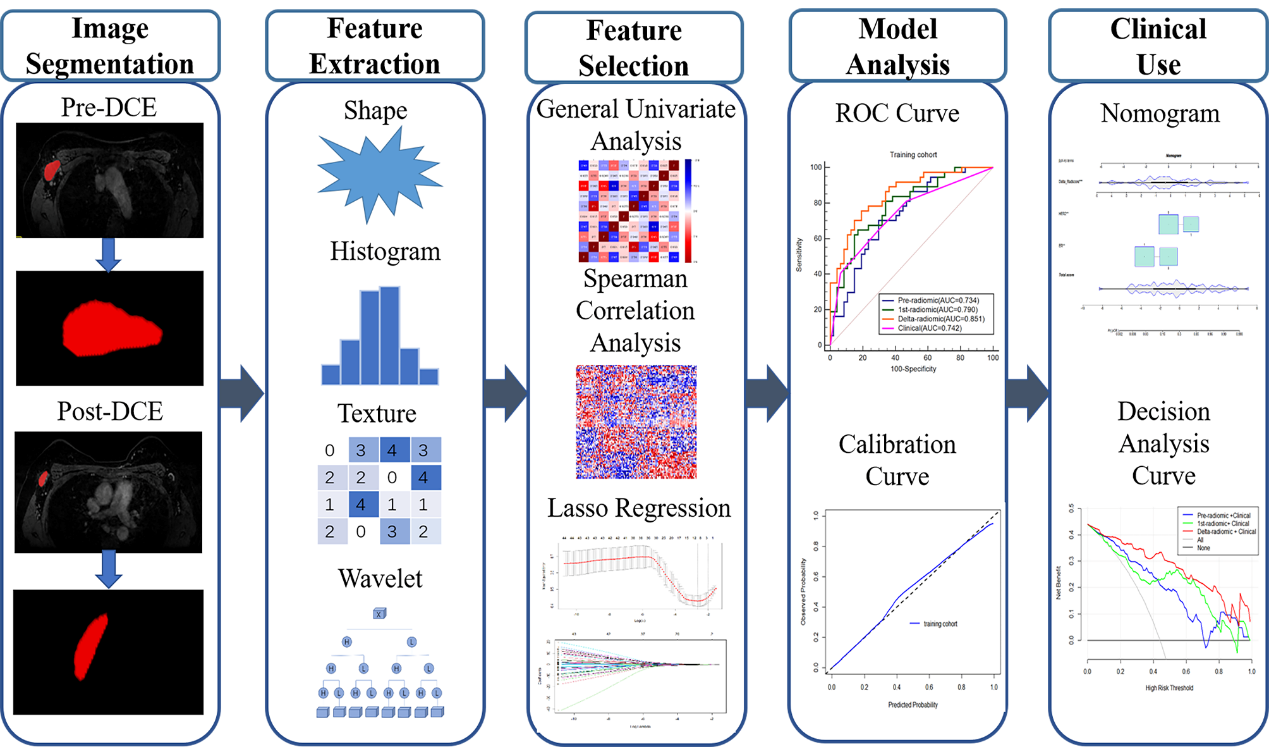
Figure
2 The
workflow of the critical steps. DCE
dynamic contrast enhanced, LASSO least absolute shrinkage and selection
operator, ROC receiver operating characteristic
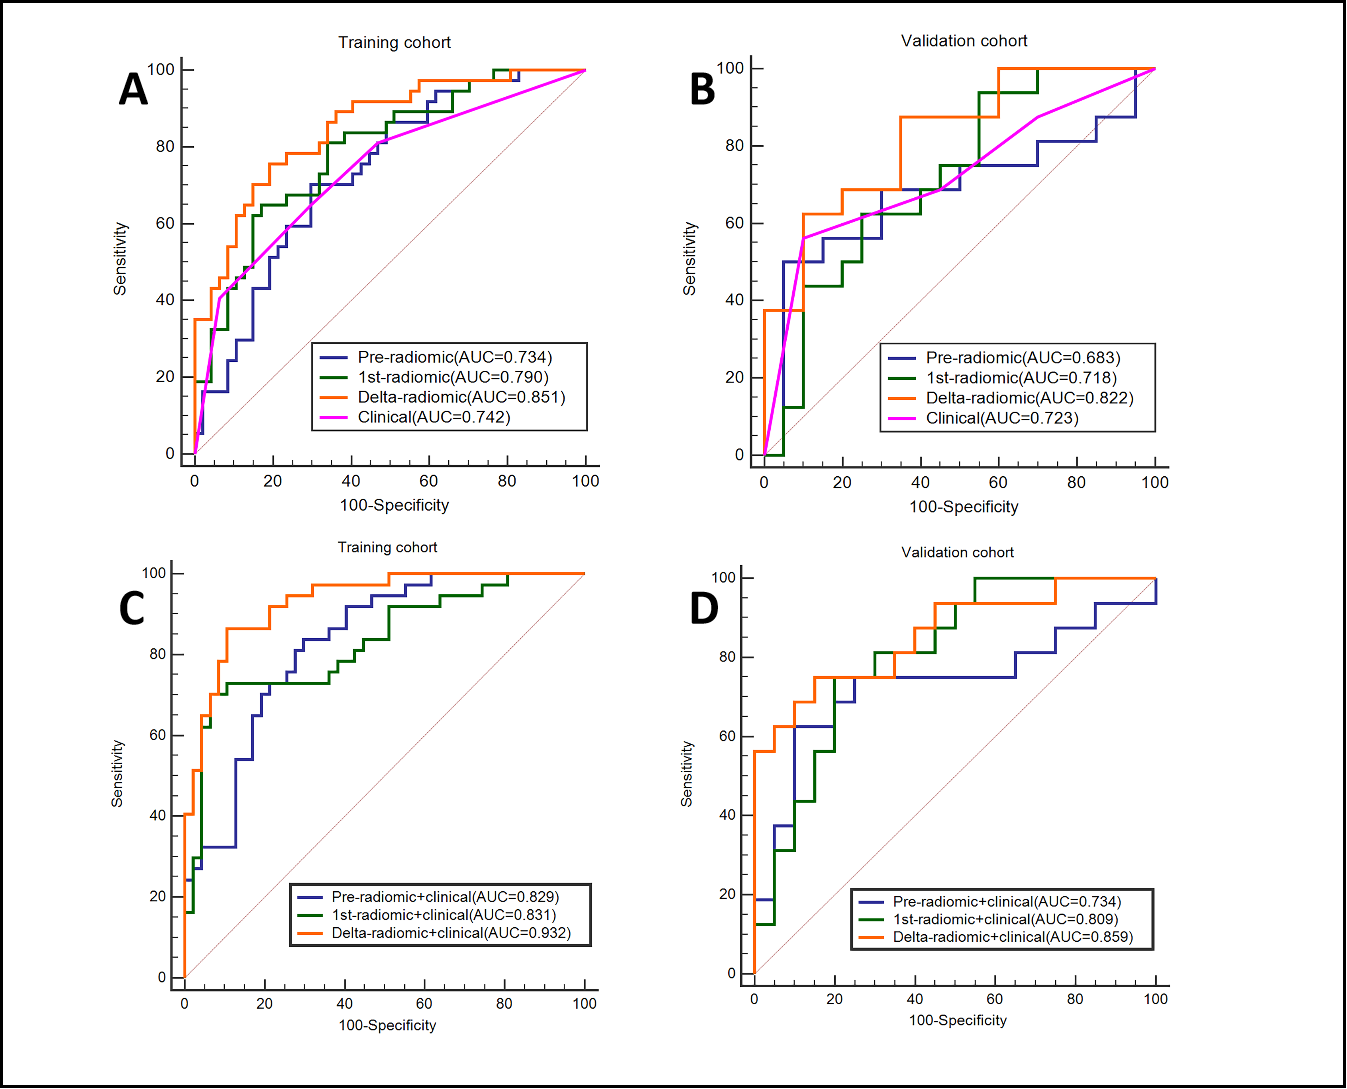
Figure 3 The
receiver operating characteristic (ROC) curves of separate (pre-radiomics, 1st-radiomics, delta-radiomics,
and clinical) models and
combined (pre-radiomics+
clinical, 1st-radiomics+ clinical,
delta-radiomics+
clinical)
models for predicting apCR . A.C
Training cohort. B.D Validation cohort. apCR axillary pathologic complete response
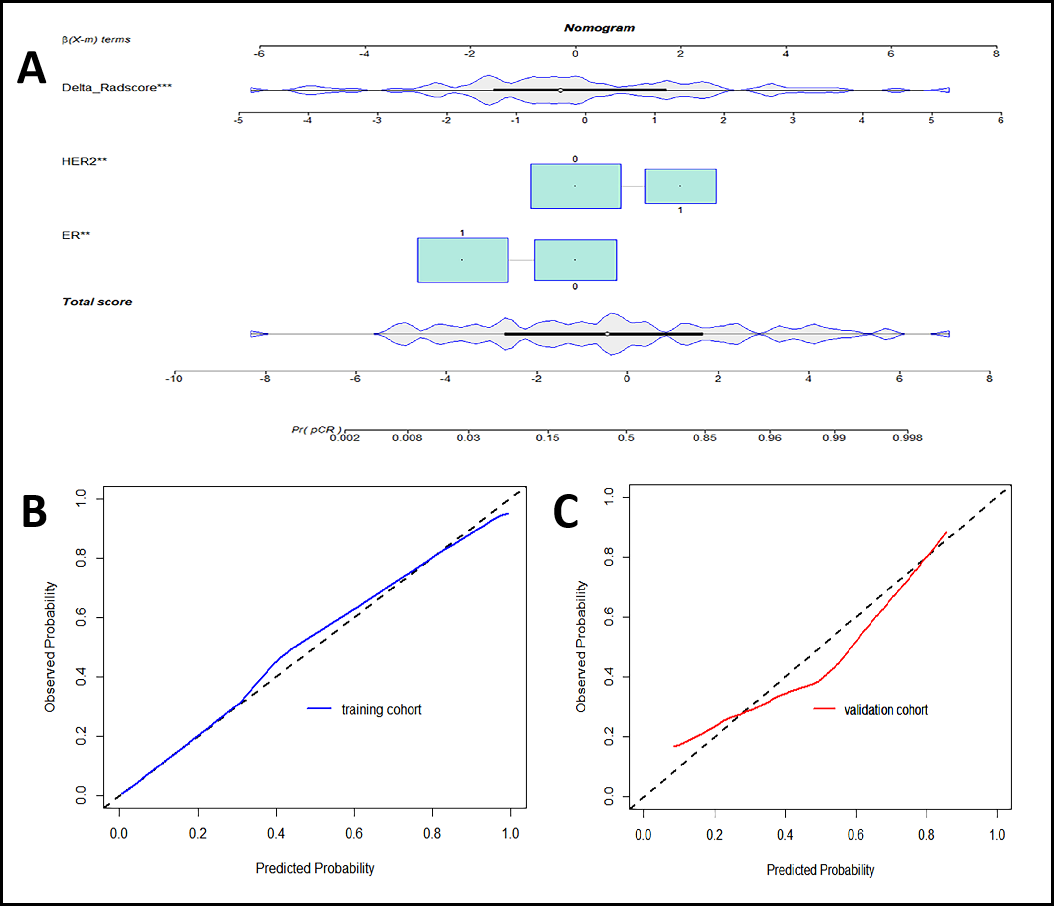
Figure 4 Calibration curves for nomogram. A nomogram
(delta-radiomics + clinical) B Training cohort. C Validation cohort.
The X-axis represents the predicted probability of apCR estimated by nomogram,
whereas the Y-axis represents the actual apCR rates. Calibration curves show
that the actual probability corresponded closely to the prediction of nomogram.
apCR axillary pathologic complete response.
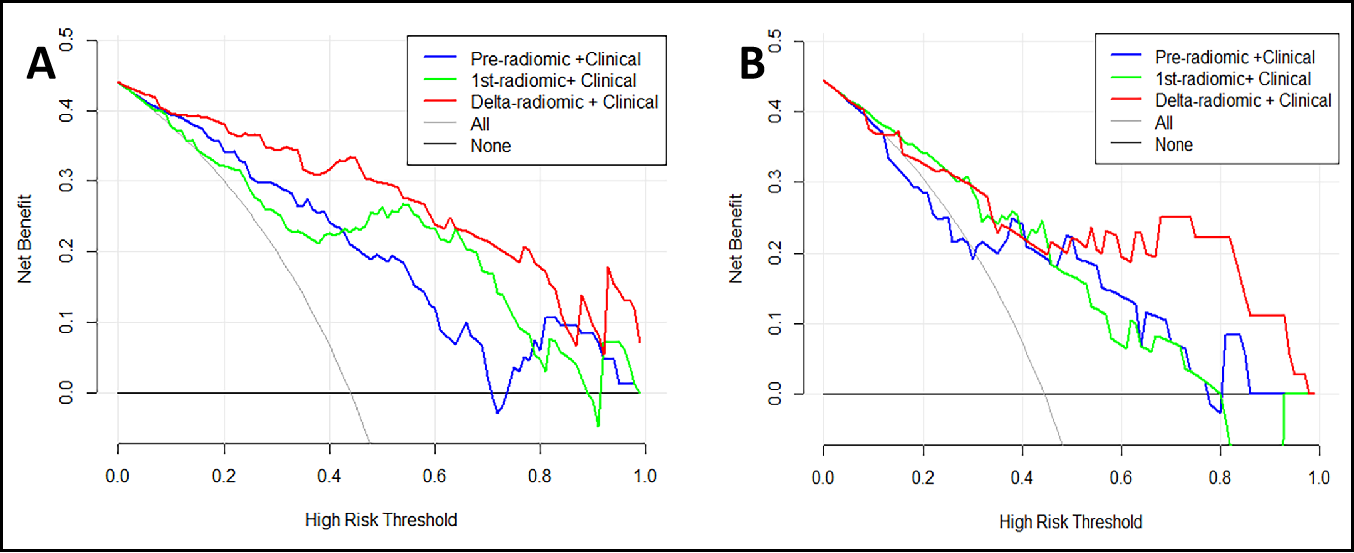
Figure 5 Decision curve analysis (DCA) of the combined models.
A Training cohort. B Validation cohort. The x-axis indicates the
threshold probability, while the y-axis indicates the net benefit. The gray
line indicates the hypothesis that all the patients achieved an apCR, and the black line indicates the hypothesis
that none of the patients achieved an apCR. apCR axillary pathologic complete response.
DOI: https://doi.org/10.58530/2023/1470