1469
Hyperpolarized 129Xe MRI ventilation textures predict short- and long-term response to Anti-IL-5Rα Biologic Therapy in Eosinophilic Asthma
Marrissa J McIntosh1,2, Maksym Sharma1,2, Harkiran K Kooner1,2, Hana Serajeddini2,3, Anurag Bhalla3, Cory Yamashita3, and Grace Parraga1,2,3,4
1Department of Medical Biophysics, Western University, London, ON, Canada, 2Robarts Research Institute, London, ON, Canada, 3Division of Respirology, Department of Medicine, Western University, London, ON, Canada, 4School of Biomedical Engineering, Western University, London, ON, Canada
1Department of Medical Biophysics, Western University, London, ON, Canada, 2Robarts Research Institute, London, ON, Canada, 3Division of Respirology, Department of Medicine, Western University, London, ON, Canada, 4School of Biomedical Engineering, Western University, London, ON, Canada
Synopsis
Keywords: Lung, Hyperpolarized MR (Gas), asthma, biologic therapy
It was previously shown that 129Xe MR ventilation images contain embedded texture features which help predict (before treatment was initiated) those severe asthma patients who were more likely to experience early response to anti-IL-5Rα biologic therapy. Thus, we postulated that such texture features would also help identify patients with an enduring, late response. Here we identified specific 129Xe MRI features that predicted both early and late response to anti-IL-5 therapy, which were superior to clinical measurements. These promising results suggest that 129Xe MRI texture features sensitively predict patients with response to biologic therapy interventions.Introduction
The regional contributions of airway inflammation,1 eosinophilia1 and mucus-plugs,2,3 which are important pathophysiologic features of poorly-controlled eosinophilic-asthma, to pulmonary ventilation abnormalities may be non-invasively evaluated using hyperpolarized noble gas MRI ventilation-defect-percent (VDP).4 VDP assumes all ventilated regions contribute equally to global lung function. Signal intensity differences, or ventilation heterogeneity, in MR images may be quantified as texture features extracted from gray-level run-length (GLRLM), co-occurrence (GLCM), size-zone (GLSZM), and dependence (GLDM), and neighbourhood gray-tone difference (NGTDM) matrices.5 We previously showed that hyperpolarized gas MRI-VDP and MRI GLRLM texture features could help identify eosinophilic-asthma patients who would experience early, within 28-days of treatment initiation, responses to anti-IL-5Rα biologic therapy.6 Whether these features, as well as GLCM, GLSZM, GLDM and NGTDM texture features, may allow for late (within 1-year of treatment initiation) response prediction remains unknown.Here we hypothesized that hyperpolarized gas MRI texture features would significantly predict eosinophilic-asthma patients with early and late responses to anti-IL-5Rα biologic therapy, and that these features would outperform standard clinical measurements.
Methods
Participants and Data Acquisition:We retrospectively analyzed 29 participants with poorly-controlled eosinophilic-asthma just prior to anti-IL-5Rα treatment initiation (Day-0) and at Day-28 (n=29) and 1-year (n=16) following continuous anti-IL-5Rα therapy. Anatomic 1H and 129Xe static ventilation MRI were acquired using a 3T scanner as previously described.7 Anatomic 1H MRI was acquired using a fast-spoiled gradient-recalled-echo (FGRE) sequence (partial-echo acquisition; total acquisition time=8s; repetition-time msec/echo-time msec=4.7/1.2; flip-angle=30°; field-of-view=40×40cm2; bandwidth=24.4kHz; 128×80 matrix, zero-padded to 128×128; partial-echo percent=62.5%; 15-17×15mm slices). 129Xe MRI was acquired using a three-dimensional FGRE sequence (total acquisition time=14s; repetition-time msec/echo-time msec=6.7/1.5; variable flip-angle; field-of-view=40×40cm2; bandwidth=15.63kHz; 128×128 matrix (zero-padded); 14×15mm slices). Supine participants were coached to inhale a 1.0L bag (400mL 129Xe + 600mL 4He for 129Xe MRI; 1.0L N2 for 1H MRI) from the bottom of a tidal breath with acquisition under breath-hold conditions. Participants performed spirometry8 and fractional exhaled nitric oxide9 according to guidelines. The Asthma Control Questionnaire (ACQ-6)10 was self-administered under the supervision of study personnel. Participants were dichotomized as responders if the reduction in ACQ-6 at Day-28 or 1-year compared to Day-0 was greater than the minimal-clinically-important-difference (0.5).11
Image Processing and Statistics:
Quantitative MRI analysis was performed on Day-0, post-bronchodilator MR images using a semi-automated segmentation algorithm, as previously described.12 Texture features were extracted from the 3D-application of GLRLM, GLCM, GLSZM, GLDM and NGTDM using the PyRadiomics platform.5 Shape-based and first-order (FO) features were also extracted. Feature selection was performed using area-under the receiver-operating-characteristic curve (AUC-ROC) to independently rank extracted texture features, including MRI-VDP, and clinical features. Separate logistic regression models were generated using the highest performing MRI texture features and clinical features. Model performance was evaluated using accuracy, sensitivity and specificity.
Results
Table 1 provides demographic characteristics for all participants and by ACQ-6 response. Twenty participants had Day-28 response, of which nine were persistent, and three participants had 1-year response only. Figure 1 provides 129Xe MRI ventilation images for representative participants with and without ACQ-6 response at Day-0, Day-28 and 1-year.Using AUC, we identified five unique features for Day-28, three unique features for 1-year and one common feature that were used to identify anti-IL-5Rα response (Table 2, Figure 2). VDP was not identified as a significant feature for either time-point (rank: 10/107 and 13/107, respectively), but did outperform all clinical variables (Day-28: VDP AUC=0.756 versus blood eosinophils AUC=0.703; 1-year: VDP AUC=0.771 versus mucus count AUC=0.646). Table 3 shows logistic regression models for MRI texture features and clinical features for Day-28 and 1-year. The highest accuracy was achieved with MRI texture features for Day-28 (accuracy=76%, sensitivity=67%, specificity=80%) and 1-year response (accuracy=81%, sensitivity=50%, specificity=92%).
Discussion
There are currently six biologic therapies for the treatment of eosinophilic-asthma, however it is difficult to predict which patients may benefit prior to therapy initiation. Using preliminary data in a small group of 17 eosinophilic-asthma patients,6 we previously showed that MRI texture features uniquely predicted patients who would experience early, within 28-days of treatment initiation, response to anti-IL-5Rα biologic therapy. Here, we developed highly accurate logistic regression models, using pre-treatment MRI texture features, to identify patients who experienced early and late responses to anti-IL-5Rα biologic therapy, and these models outperformed models developed with clinical features. High performing features included GLSZM small-area-low-gray-level-emphasis, GLSZM low-gray-level-zone-emphasis, GLDM small-dependence-low-gray-level-emphasis, GLCM cluster-shade, GLRLM short-run-low-gray-level-emphasis and FO skewness, which describe fine ventilation heterogeneity, more commonly referred to as “patchiness”. In contrast, high performing features including GLCM correlation, NGTDM strength and GLRLM long-run-low-gray-level-emphasis describe large regions of similar signal intensities, with the latter specifically referring to regions with low signal intensity. Interestingly, GLSZM low gray-level zone emphasis predicted response irrespective of follow-up time. Twenty features for Day-28 response and 40 features for 1-year response outperformed all clinical features, further supporting the prognostic value of MRI texture features for predicting anti-IL-5Rα response.Conclusions
Pre-treatment hyperpolarized 129Xe MRI texture features identified eosinophilic-asthma patients who responded to anti-IL-5Rα biologic therapy within 28-days and 1-year of treatment initiation. Considering the high-cost (~$30,000 annually) of therapy, the increasing number of biologic therapy options and the inability to predict patients who will respond highlights the clinical relevance and importance of this work.Acknowledgements
This study was funded by AstraZeneca PLC.References
1. Svenningsen, S. et al. Am J Respir Crit Care Med (2018).
2. Mummy, D. G. et al. Radiology (2021).
3. Svenningsen, S. et al. Chest (2019).
4. Kirby, M. et al. Proc. SPIE (2010).
5. van Griethuysen, J. J. M. et al. Cancer Res (2017).
6. McIntosh, M. J. et al. ISMRM (2020).
7. Svenningsen, S. et al. J Magn Reson Imaging (2013).
8. Miller, M. R. et al. Eur Respir J (2005).
9. Dweik, R. A. et al. Am J Respir Crit Care Med (2011).
10. Juniper, E. F. et al. Eur Respir J (1999).
11. Juniper, E. F. et al. Respir Med (2005).
12. Kirby, M. et al. Acad Radiol (2012).
Figures

Table 1. Participant Characteristics

Table 2. Top Ranked Features to Identify ACQ-6 Responders

Table 3. Logistic Regression Models
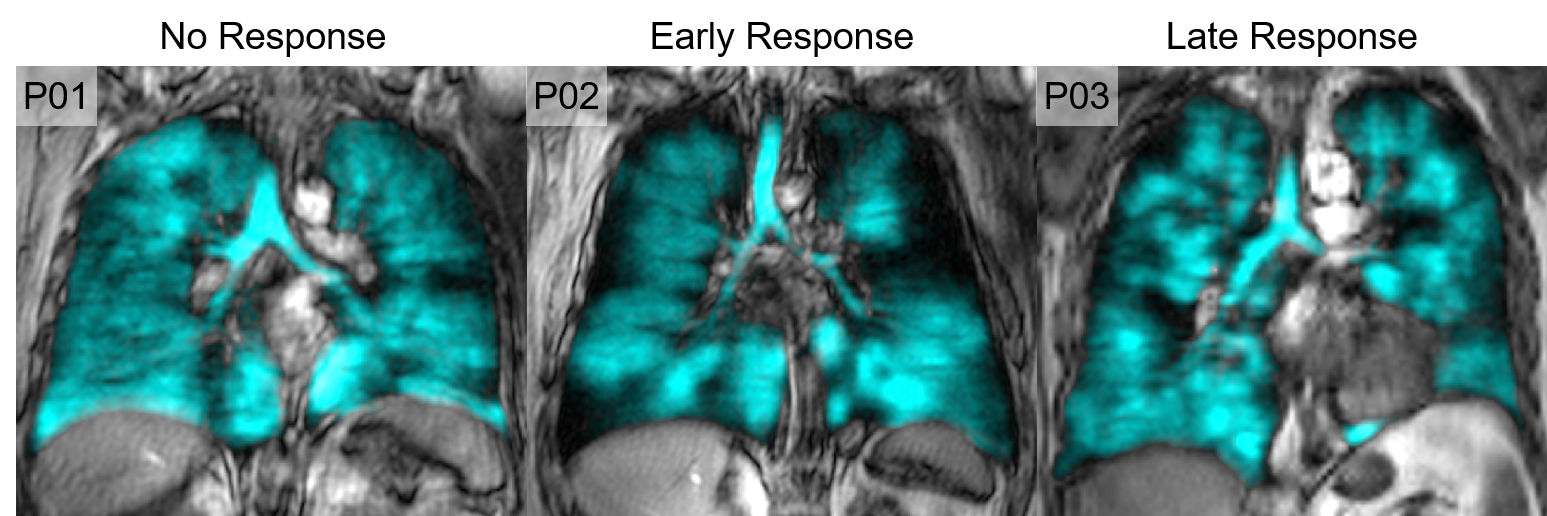
Figure 1. Qualitative results of no responder, early response and late response

Figure 2. Top ranked predictors of early and late response to anti-IL-5Rα
DOI: https://doi.org/10.58530/2023/1469