1468
Deep-learning based rectal tumor segmentation on multi-parametric MRI using pre-treatment and near-end-treatment data
Yang Zhang1,2, Liming Shi3, Xiaonan Sun3, Min-Ying Su2, Taoran Cui1, Ning J. Yue1, and Ke Nie1
1Department of Radiation Oncology, Rutgers-Cancer Institute of New Jersey, New Brunswick, NJ, United States, 2Department of Radiological Sciences, University of California, Irvine, CA, United States, 3Department of Radiation Oncology, Department of Radiation Oncology, Sir Run-run Shaw Hospital, Zhejiang University School of Medicine, Hangzhou, China
1Department of Radiation Oncology, Rutgers-Cancer Institute of New Jersey, New Brunswick, NJ, United States, 2Department of Radiological Sciences, University of California, Irvine, CA, United States, 3Department of Radiation Oncology, Department of Radiation Oncology, Sir Run-run Shaw Hospital, Zhejiang University School of Medicine, Hangzhou, China
Synopsis
Keywords: Cancer, Machine Learning/Artificial Intelligence
In this study, the convolutional neural network (CNN) was implemented to segment the rectal cancer in 185 patients, with tumor ROI outlined by a radiologist on multiparametric magnetic resonance images (mp-MRI). The Dice similarity coefficient (DSC) and mean symmetrical surface distance (MSD) values were used to evaluate the results of the proposed algorithm. The mean DSC and MSD were 0.88 and 2.2 cm respectively for pre-treatment MR images. The transfer-learning model using paired pre-treatment and near-end-treatment images could also lead to acceptable result for boost volume segmentation with the mean DSC of 0.83 and MSD of 2.7 cm. Our work showed the deep-learning with combined image sequences was promising for automatic tumor localization and segmentation of locally advanced rectal cancer. After applying transfer learning with the prior information obtained from the pre-treatment images, the proposed method can be further used to identify boost volume for radiation dose escalation which has been demonstrated beneficial in improving pathological complete response rate.Intriduction
Multiparametric Magnetic Resonance Imaging (mp-MRI) has been considered as the first choice of rectal cancer diagnosis and mandatory for pre-operative staging. The mp-MRI radiomics information has also been proven successful in early prediction of treatment response [1-4] However, the manual delineation of region-of-interest (ROI) is time-consuming and reader-dependent. An automatic tumor localization and segmentation is of great importance for prediction model construction.Deep learning models have stimulated great interest for medical imaging processing such as pulmonary node detection and segmentation. However, due to considerable individual differences in the location and shape, and movable surrounding tissue, segmentation of rectal cancer can be complicated. To date, different semi- and automatic segmentation methods have been proposed but only achieved barely acceptable results with Dice Similarity Coefficient (DSC) between 0.55-0.74. Additionally, multiple clinical trials have also confirmed that dose escalation beyond conventional 50.4Gy is correlated with increased rate of complete response with acceptable toxicity. However, previous algorithms designed only on pre-treatment diagnostic images, which might not be adaptable for boost target identification on near-end-treatment MRIs.Recognizing that T2-weighted (T2w) MRI and various functional MRI methods provide different and unique image contrasts, therefore in this study, we aim to develop deep-learning based algorithms based on pre-treatment mp-MRI and evaluate which MRI sequence and its combination is optimal for rectal cancer delineation. Furthermore, we have designed transfer learning models from the pre-treatment images to the near-end-treatment images to identify boost volume which may allow radiation dose escalation to further improve treatment outcome.Methods
Multi-parametric MRI from 185 patients with locally advanced rectal adenocarcinoma were collected and used in this study. All contained pre-treatment image sets and 98 had paired near-end-treatment images. The imaging protocol included T1w, T2w, DCE-MRI acquired using a spoiled gradient echo sequence (LAVA), and DWI with two b-values. The ground-truth was outlined as a region of interest (ROI) by an experienced rectal MRI radiologist, Intensity standardization was firstly applied to all images with the intensity distribution set to have mean zero and standard deviation of one.Our proposed method is a network with two combined serials of U-nets with architecture shown in Fig 3. The two U-net was trained differently. Each U-net contains 12 convolutional layers in descending part and 12 convolutional layers in ascending part. The convex hull of each lesion ROI was generated and enlarged by 1.5 times. These generated labels were utilized to train the first U-net. The results of this U-net were sent to the next U-net which was trained by original tumor ROI and applied to predict the boundary of lesions. The first U-net worked a localizer which roughly indicate the rectal positions. The U-net was used to convert each image into probability map with the same size.These models were all trained with five-fold cross-validation. The validation group was used to optimize the hyperparameters such as learning rate, decay rate, and epochs by maximizing the object function. Based on the results, we compared the proposed method with the previously published method as patch-based identification using all pre-treatment sequences as input [5]. The details of the patch-based identification method are shown in Figure 1. Then the performances of the models trained using individual sequences (T2, DWI, LAVA) or using all sequences were compared to identify the optimal image set for tumor delineation.After the using the pre-treatment images, the trained models were fine-tuned using 1/3 of the near-end-treatment data then validated by the rest of the near-end-treatment data for boost volume identification. Moreover, another model was established with paired pre-treatment and near-end-treatment data to improve the transfer learning performance. To evaluate the performance of the segmentation, the DSC and mean symmetrical surface distance (MSD) value were used to compare the results of the proposed algorithm and the ROI outlined by reader.Results
Our model can achieve a mean DSC of 0.88 compared to previously proposed patch-based algorithm with DSC of 0.74. The MSD also improved from 3.1cm to 2.2cm if using all combined pre-treatment mp-MRI sequences. Two examples are shown on Figs. 5. If using T2w MRI only, the DSC was only 0.78. With addition of functional DWI, the DSC improved to 0.80 and could further increased to 0.88 with DCE-MRI. However, if using DCE or DWI alone, the DSC were inferior compared to high-resolution T2w MRI in tumor delineation. If pre-treatment model was directly applied to near-end-treatment images, the DSC dropped from 0.88 to 0.76. This indicates the model from the pre-treatment data is not capable to segment the lesions on the near-end-treatment images. When the model was fine-tuned with combination of paired pre-treatment and near-end-treatment images, the projected segmentation for the boost volume from pre-treatment diagnostic images could improve to 0.83 DSC. The detail results are shown in Table 1.Conclusion
Developing an efficient and reliable tumor segmentation method is essential to quantitatively extract imaging information and further to assess patient risk or benefit in getting personalized treatment. Several deep learning models have been established based on T2W images or DWI alone [5-6], but segmentation result is barely acceptable with DSC between 0.55 to 0.74. In this study, we established a deep-learning networks with combined multi-parametric imaging sequences. The results showed that deep-learning algorithm especially the combined serial U-Net model was promising to perform fully automatic and accurate segmentation of rectal tumor. This provides a fundamental step to reliably and efficiently extract morphological and functional information of the tumor to further understand individual tumor characteristics. Moreover, after applying transfer learning with the prior information obtained from the pre-treatment images, the proposed method, to our best knowledge, as the first time to provide automatic delineation of boost volume which can be used to design treatment strategy of radiation dose escalation. All have the potential to lead personalized treatment selection.Acknowledgements
This study is supported in part by NIH R01 CA127927 and Rutgers-RBHS precision medicine pilot grant, The Rutgers-Cancer Institute of New Jersey P30 CA072720.References
[1] Kim YH, Kim DY, Kim TH, Jung KH, Chang HJ, Jeong SY, Sohn DK, Choi HS, Ahn JB, Kim DH, Lim SB. Usefulness of magnetic resonance volumetric evaluation in predicting response to preoperative concurrent chemoradiotherapy in patients with resectable rectal cancer. International Journal of Radiation Oncology* Biology* Physics. 2005 Jul 1;62(3):761-8.[2] Seierstad T, Hole KH, Grøholt KK, Dueland S, Ree AH, Flatmark K, Redalen KR. MRI volumetry for prediction of tumour response to neoadjuvant chemotherapy followed by chemoradiotherapy in locally advanced rectal cancer. The British journal of radiology. 2015 May 28;88(1051):20150097.[3] Nie K, Shi L, Chen Q, Hu X, Jabbour SK, Yue N, Niu T, Sun X. Rectal Cancer: Assessment of Neoadjuvant Chemoradiation Outcome based on Radiomics of Multiparametric MRI. Clin Cancer Res. 2016 Nov 1;22(21):5256-5264.[4] Liu Z, Zhang XY, Shi YJ, Wang L, Zhu HT, Tang ZC, Wang S, Li XT, Tian J, Sun YS. Radiomics Analysis for Evaluation of Pathological Complete Response to Neoadjuvant Chemoradiotherapy in Locally Advanced Rectal Cancer. Clin Cancer Res. 2017 Sep 22. [Epub ahead of print][5] Trebeschi S, van Griethuysen JJ, Lambregts DM, Lahaye MJ, Parmer C, Bakers FC, Peters NH, Beets- Tan RG, Aerts HJ. Deep Learning for Fully-Automated Localization and Segmentation of Rectal Cancer on Multiparametric MR. Scientific Reports. 2017 Jul 13;7(1):5301.[6] Kingma D, Ba J. Adam: A method for stochastic optimization. arXiv preprint arXiv:1412.6980. 2014 Dec 22.Figures
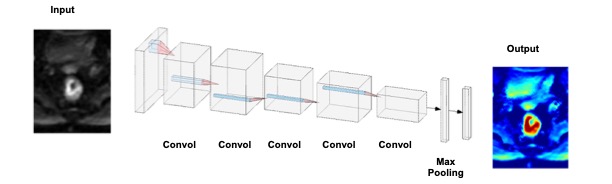
Figure
1: CNN architecture using 6 sets of images as inputs (T2, two DWI: b=0, 800
s/mm2, three DCE: one pre-, two post-contrast). The gray rectangle represents
3X3 convolutional kernel. 24 features are used in the first convolutional
layer, and the number doubles in each convolutional layer (i.e. 24,
48, 96, 192). Dropout of 1/2 is used after the fully connected layer, and 1/3
after each max pooling layer. ReLu is
used for nonlinearity in each layer, except in the output layer, where a softmax is
used instead. Stride two is used in the max pooling.
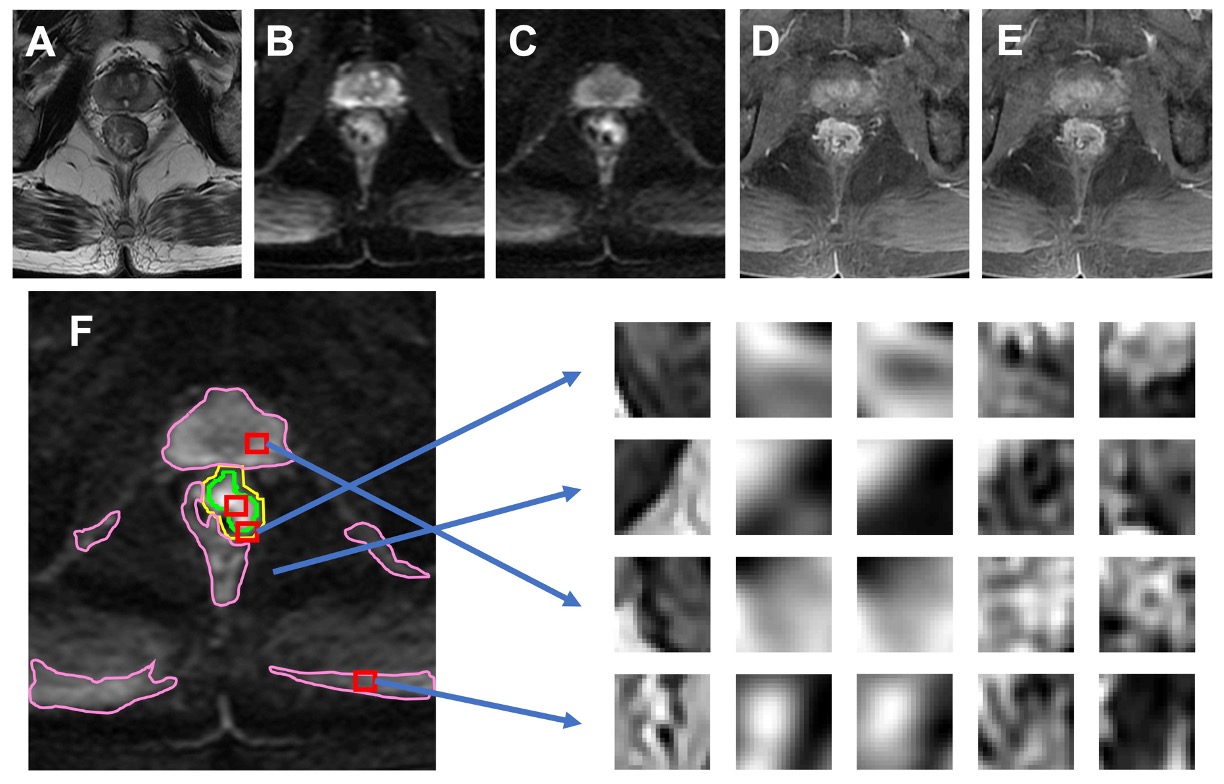
Figure 2:
An example from 80-year-old male patient with lower-rectum cancer (A)
T2-weighted image, (B) DWI with b = 0, (C) DWI with b=800, (D) pre-contrast
image, (E) 60 seconds post-contrast image. (F) The tumor (green) is manually
outlined. The background is divided into three regions as used in Ref [5]: the
first (magenta) is the hyper-intense region on DWI (b=800); the second (yellow)
is the region surrounding the tumor in a 1 cm radius; and the third is the
remaining area. Examples of extracted patches from the tumor and three
non-lesion regions corresponding to (A-E) images are shown.
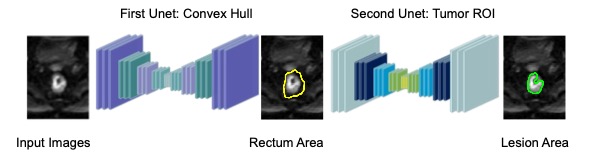
Figure 3:
Architecture of
the
U-nets. The
two U-net was trained differently. The convex hull of each lesion ROI was
generated and enlarged by 1.5 times. These generated labels were utilized to
train the first U-net. The results of this U-net were sent to the next U-net
which was trained by original tumor ROI and applied to predict the boundary of
lesions. Each
of
the
U
net
contain 12 convolutional layers in descending parts and 12 convolutional layers in the ascending part. The input and output images sizes are 128x128.
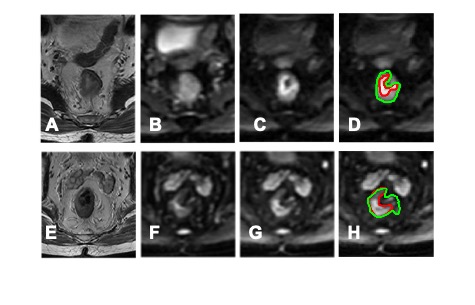
Figure 4: Case
examples for the segmentation results. The top ra=ow is from an 80-year-old male
patient with lower-rectum cancer. (A) T2-weighted image. (B) DWI with b = 0.
(C) DWI with b=800. (D) The segmentation results. The green line is the
segmentation results from the U-net using all sequences. The bottom row is
from a 56-year-old male patient with
mid-rectum cancer. (A) T2-weighted image. (B) DWI with b = 0. (C) DWI with
b=800. (D) The segmentation results. The green line is the segmentation results
from the U-net using all sequences.
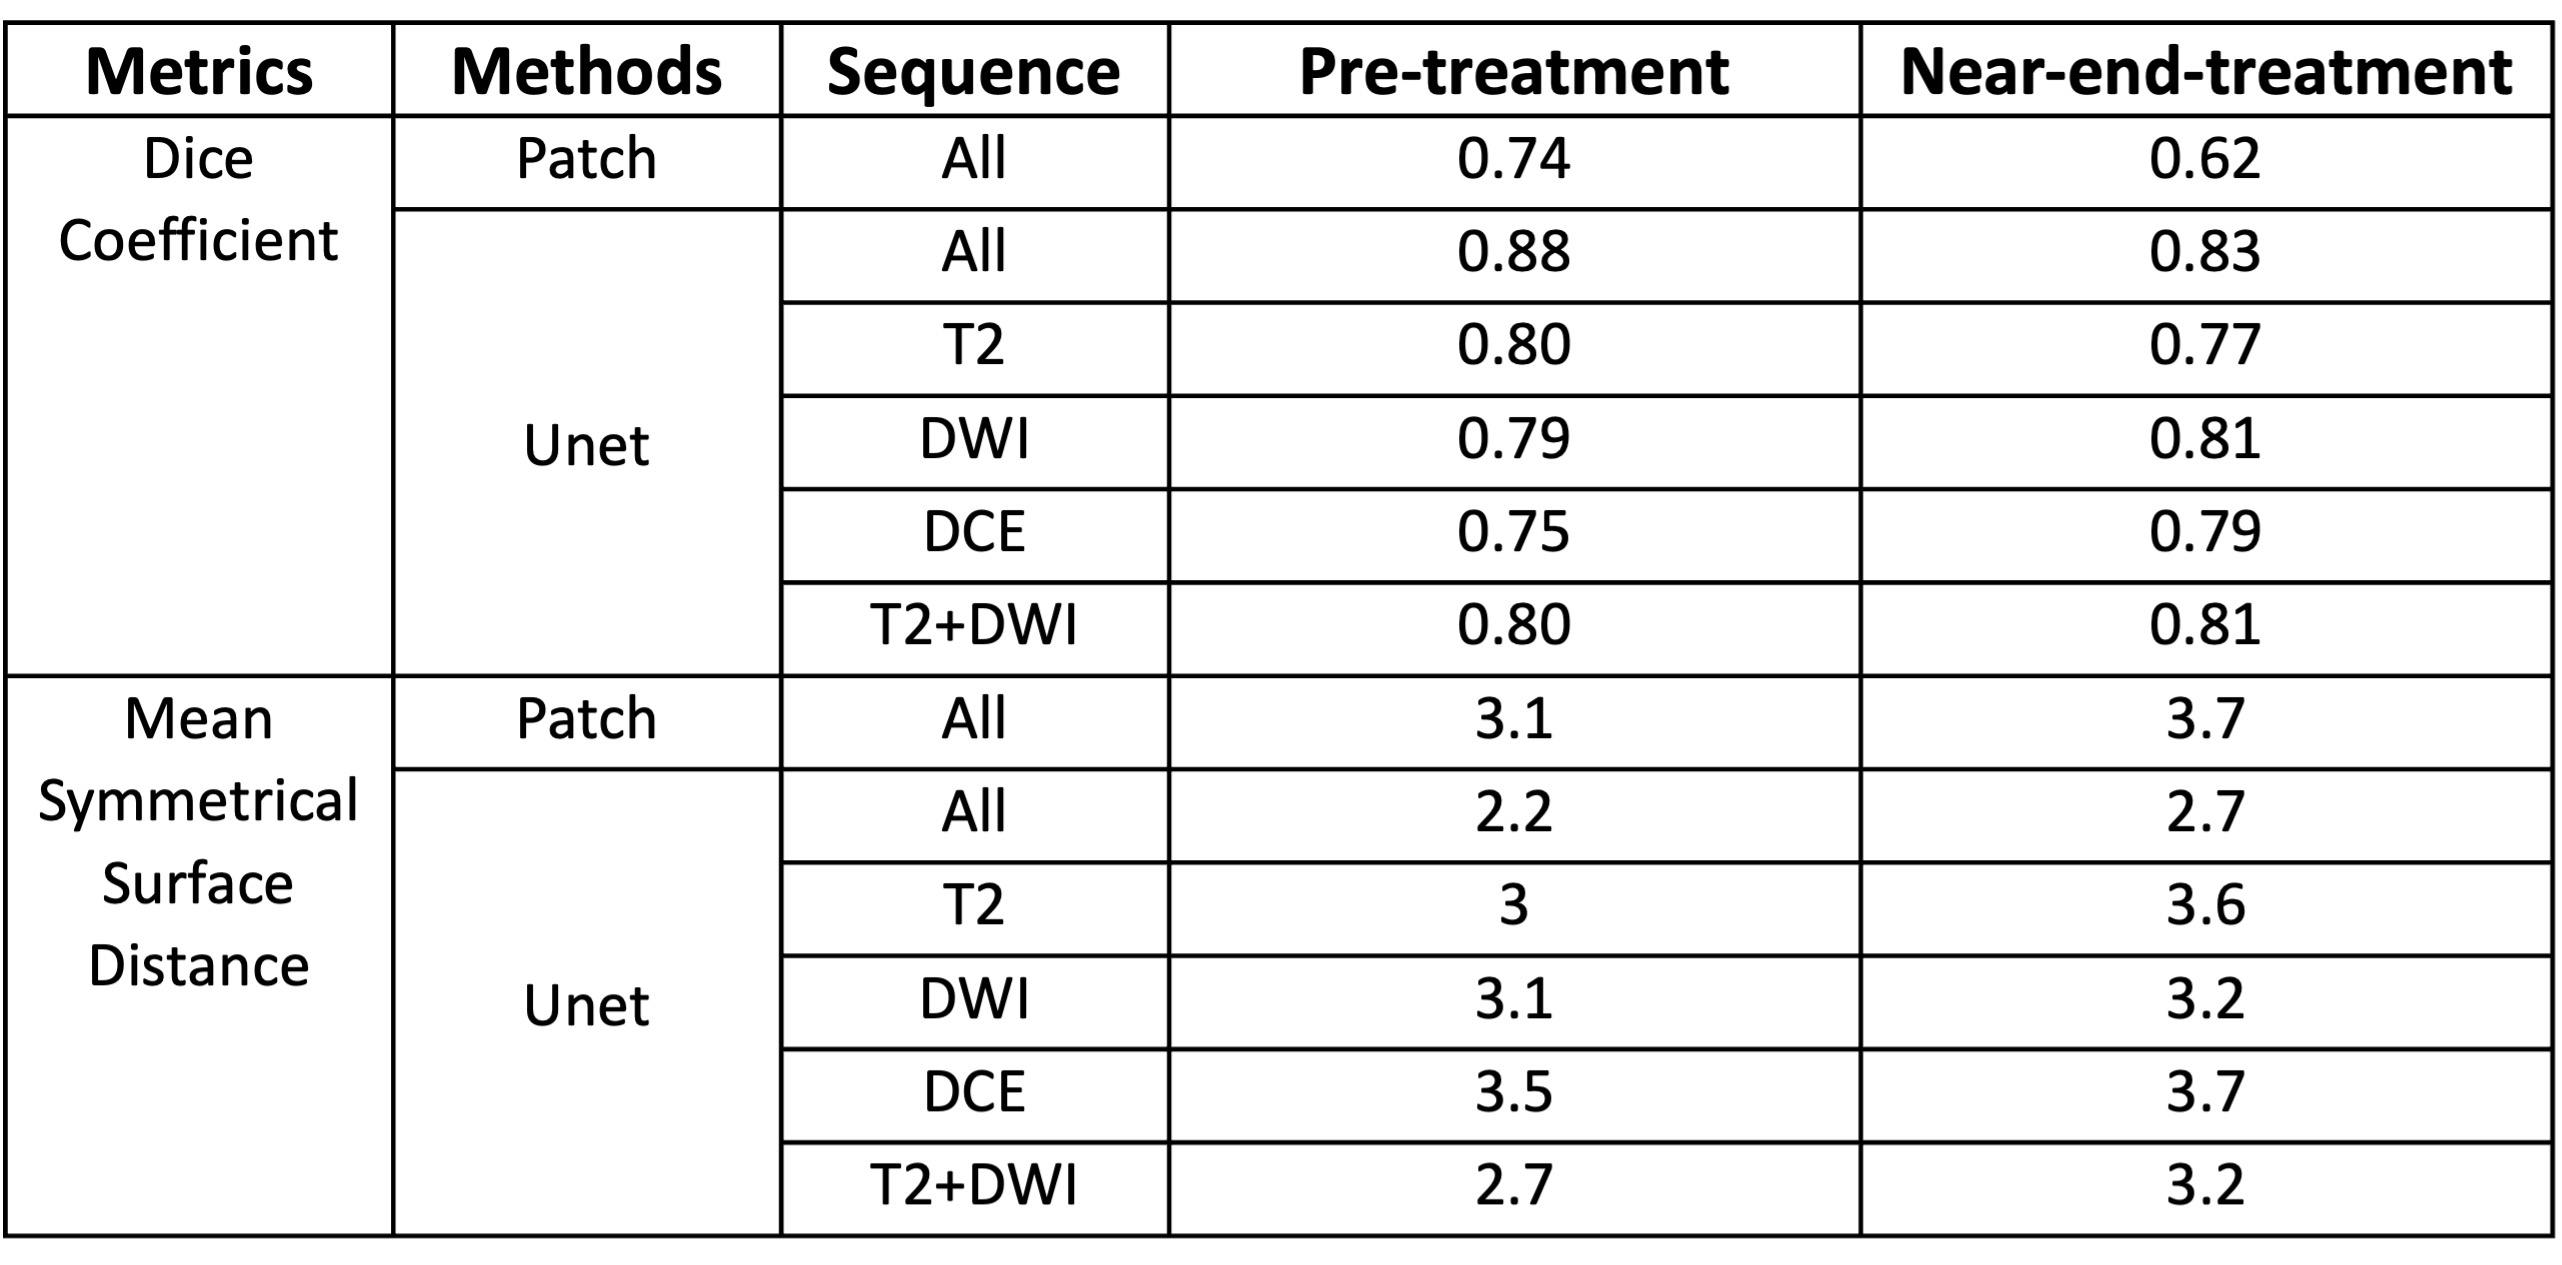
Table1: Segmentation results using
different methods and sequences. The segmentation on pre-treatment data and near-end-treatment data was evaluated by DSC and MSD.
DOI: https://doi.org/10.58530/2023/1468