1465
Synthesizing contrast-enhancement map from non-contrasted black-blood images for brain lymphatic imaging using a deep neural network1Korea Advanced Institute of Science and Technology, Daejeon, Korea, Republic of, 2Department of Radiology, Seoul National University College of Medicine, Seoul, Korea, Republic of, 3Seoul National University Hospital, Seoul, Korea, Republic of
Synopsis
Keywords: Neurofluids, Machine Learning/Artificial Intelligence
In this study, we proposed non-invasive brain lymphatic region mapping by synthesizing contrast-enhancement maps (CEM) from non-contrast enhanced black blood imaging (non-CEBB). T1 images were used as secondary input along with non-CEBB, which helped the network to better distinguish lymphatic regions from blood vessels. From the reconstructed 3D CEM segmentation, enhancement was mainly distributed in dorsal parasagittal dura, parasagittal regions, brain basal region and around choroid plexus, consistent with previous studies. This study could be applied to the segmentation of the brain lymphatic region with less ambiguity and may help automatic segmentation rather than intensity-based segmentation by adapting self-supervised learning.Introduction
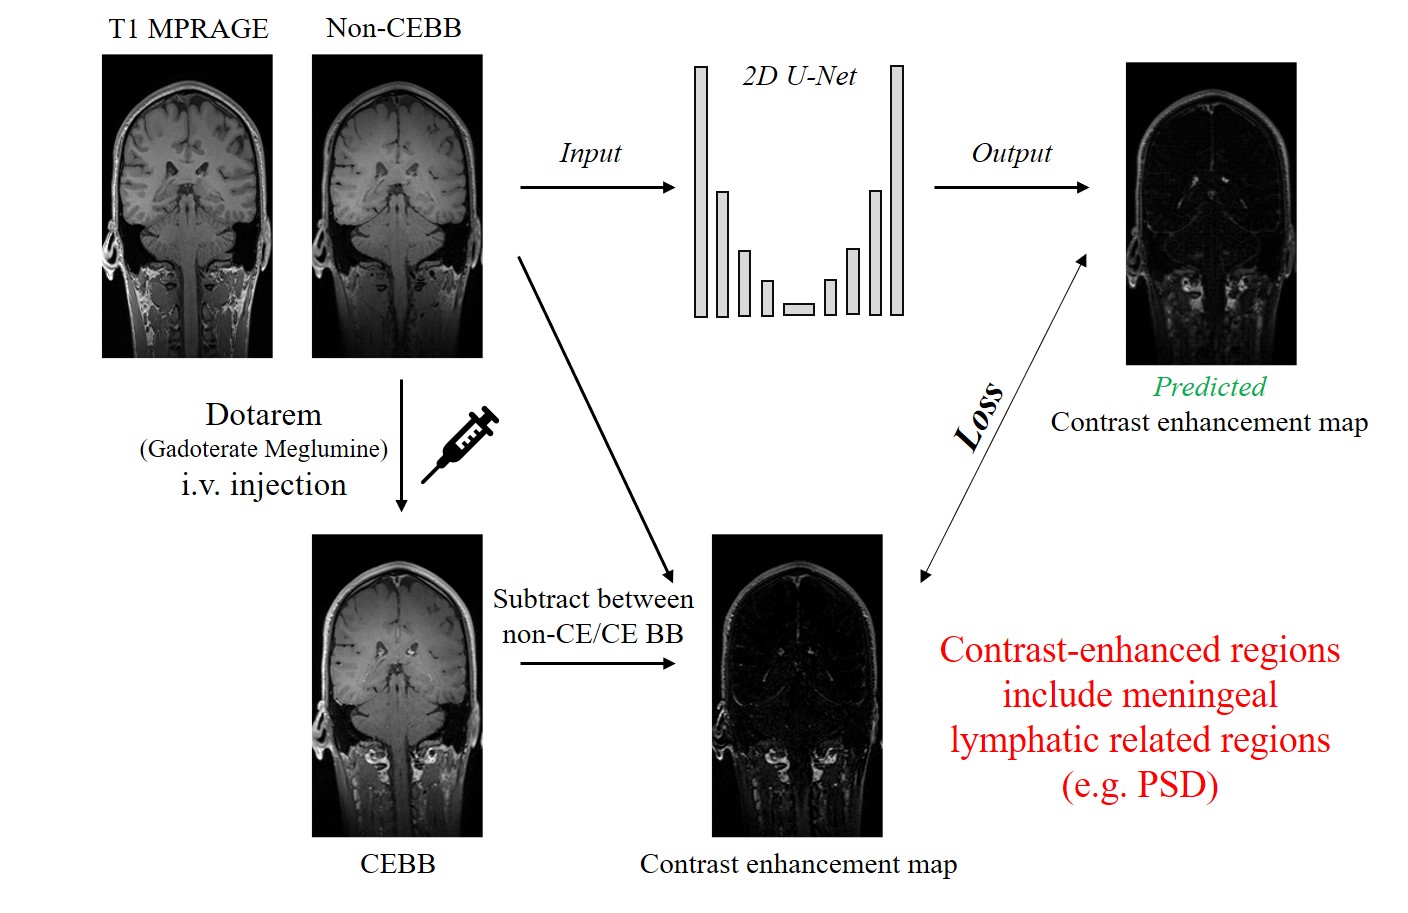
The glymphatic system and meningeal lymphatic vessels (mLVs) provide new insights into the waste clearance of central nervous system (CNS)1. Based on the recent studies on the CNS clearance, mLVs are found to be the major routes of waste product outflow compared to the other pathways and that impairment in mLVs are related to neurodegenerative diseases1,2,3. In-vivo imaging of the brain lymphatics has gained importance due to their functionality in CNS waste clearance. The meningeal lymphatics are mainly distributed in the dorsal meninges around the superior sagittal sinus and the skull base2,3. Several studies used contrast-enhanced MRI to visualize the brain lymphatic system. Intravenously injected molecules move from the blood vessels to the mLVs. Thereafter, contrast-enhanced black-blood (CEBB) imaging suppresses the blood signal and emphasizes the lymphatic signal clearly4,5,6. However, using contrast-agent has side-effects with common symptoms including injection site pain, headaches and dizziness. Also, serious but rare side effects include gadolinium toxicity and nephrogenic systemic fibrosis in patient with kidney problems. In this study, we aimed to synthesize contrast-enhancement maps (CEM) from non-CEBB images without using contrast agent, and to segment brain lymphatic-related regions non-invasively.Method
All the experiments were performed on a 3T whole-body scanner (Trio, Siemens). This study was approved by Institutional Review Board and written informed consent was obtained before the experiment. The total number of volunteers was 60. The dataset was separated into the training set (n=42), validation set (n=12) and test set (n=6).Contrast-enhanced 3D T1 black-blood images and 3D T1 MPRAGE were acquired (Fig.1). 3D T1 black-blood imaging parameters were TR/TE = 620/15msec, flip angle = variable, matrix size = 256×256x144, FOV = 250×250 mm2, thickness = 1.2mm, scan direction = sagittal, number of averages = 1, echo train length = 21 and total scan time = 5min 35secs. 3D T1 black-blood imaging was performed before and after contrast agent i.v. injection. We used Dotarem(Gadoterate meglumine) as a contrast agent. High-resolution 3D T1 MPRAGE was acquired with 1mm isotropic spatial resolution and the same FOV as 3D black-blood imaging.
To normalize the training data distribution, all the images were normalized between 0 and 1. To adjust image misalignment due to motion, 3D T1 data and CEBB images were registered with non-CE BB images and T1 image was resampled to make the same resolution as black-blood imaging (SimpleITK)7.
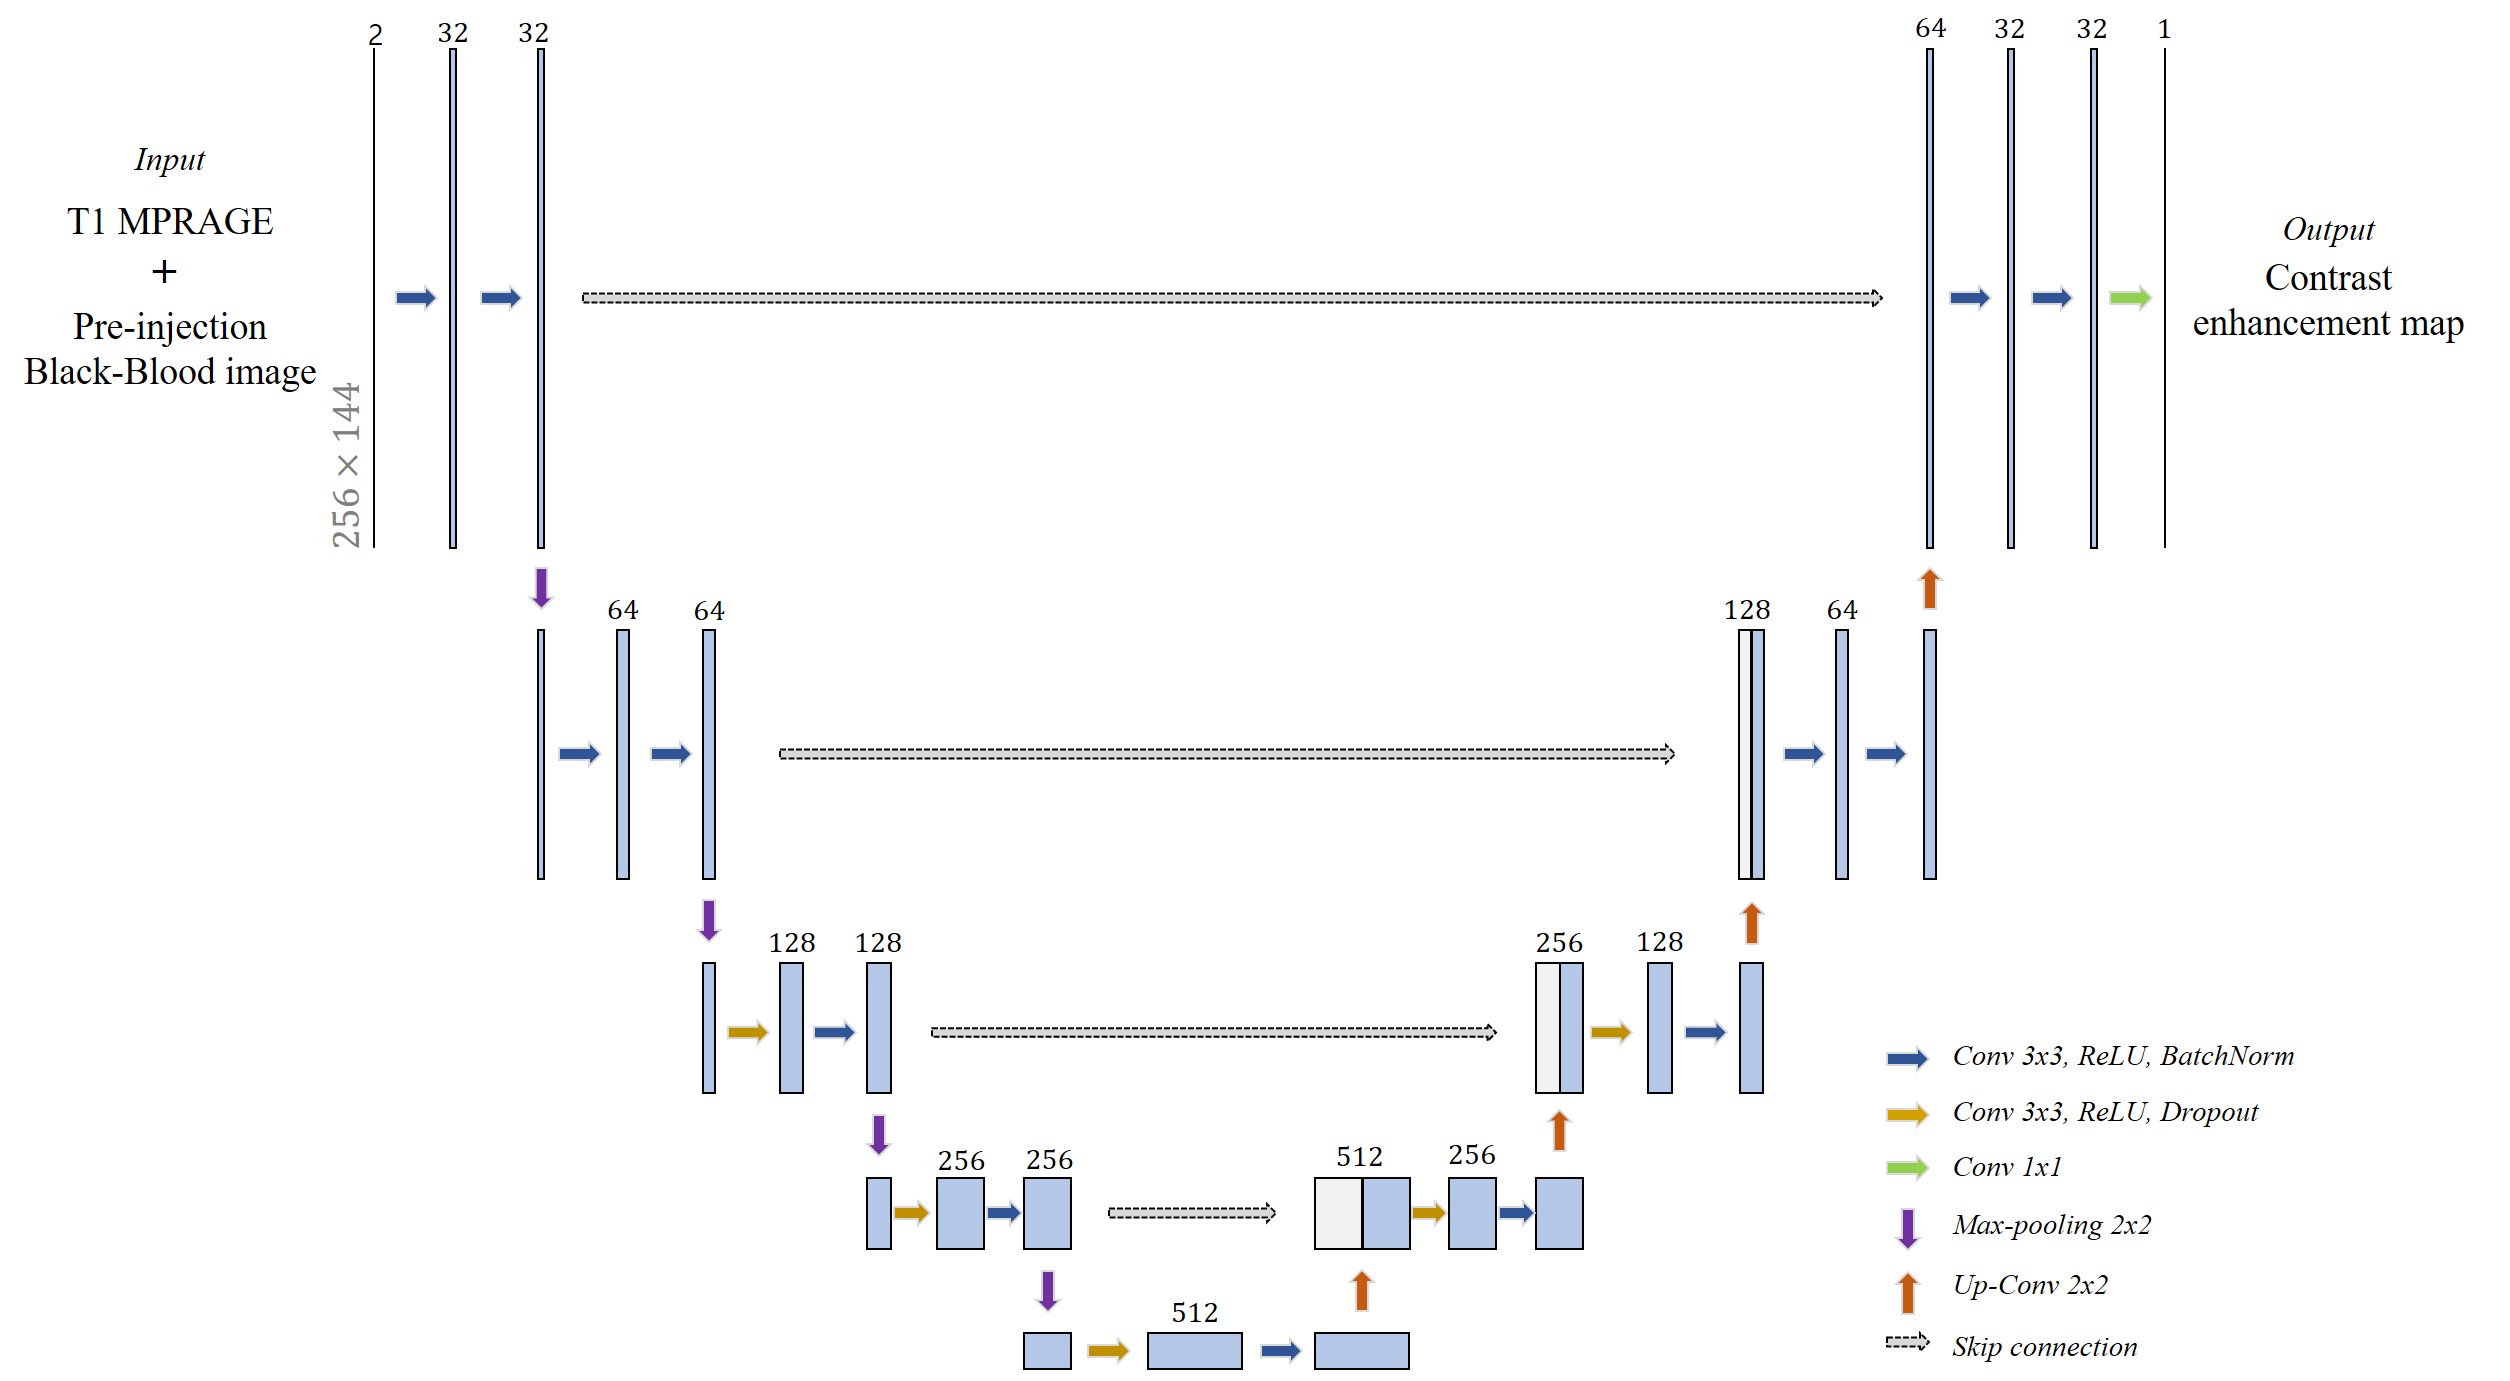
To synthesize the CEM from non-CEBB, we used 2D deep-convolutional neural network with U-net structure (Fig.2). The U-net structure had four pooling layers and four up-convolutional layers. We used 32 features after initial convolution and the input image size was 256×144. The image datasets include 3D-T1 and 3D black-blood imaging that were used as coronal 2D images for network training and testing. Input data was given by 2 channels which were concatenated with T1 image and non-CE BB image. The ground truth CEM was given as subtraction between CEBB and non-CEBB. The loss function(β) included structural similarity(SSIM), mean squared error and perceptual loss from VGG-net feature map8(Eq.1). $$\hat{β}=argmin((1-\frac{1}{N}\sum_{i=1}^{N}SSIM(y_i,\hat{y_i})+\sqrt{\frac{1}{N}\sum_{i=1}^{N}(y_i,\hat{y_i})^2}+perceptual loss) ... (Eq.1)$$
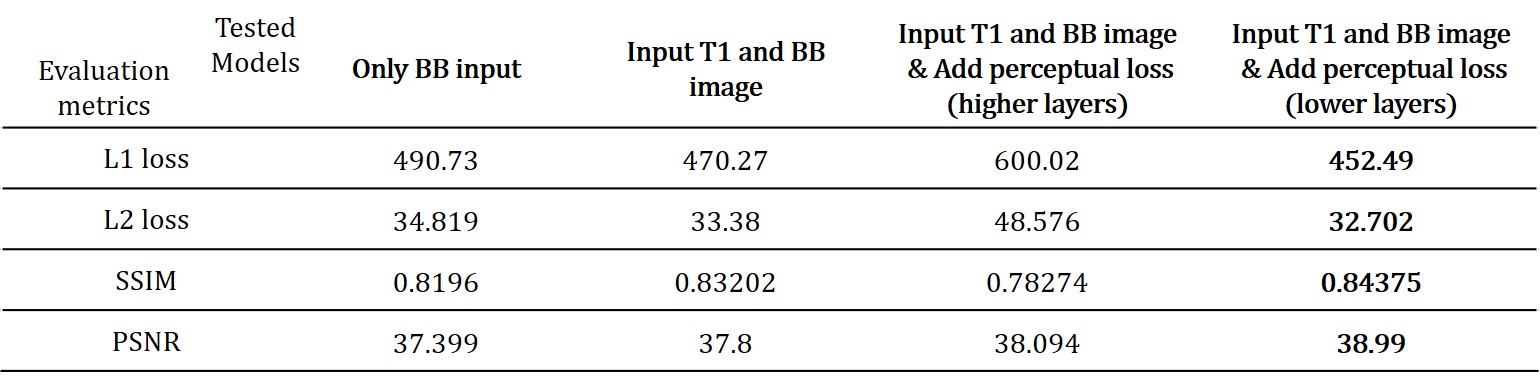
Total training was conducted 150 epochs with data augmentation (rotate, shift), batch size was 5 and the learning rate was 0.001 and reduced when the training process met plateau. The network training setup was tested with various options. We tested additional input data (T1 image) for training, perceptual loss effect and VGG feature map choice for better perceptual loss. From the various training setups, we evaluated the model performance by L1 loss, L2 loss, SSIM and peak signal-to-noise ratio (PSNR). After acquiring synthesized contrast-enhanced region image from the network output, intensity-based threshold was applied to make segmentation map.
Result
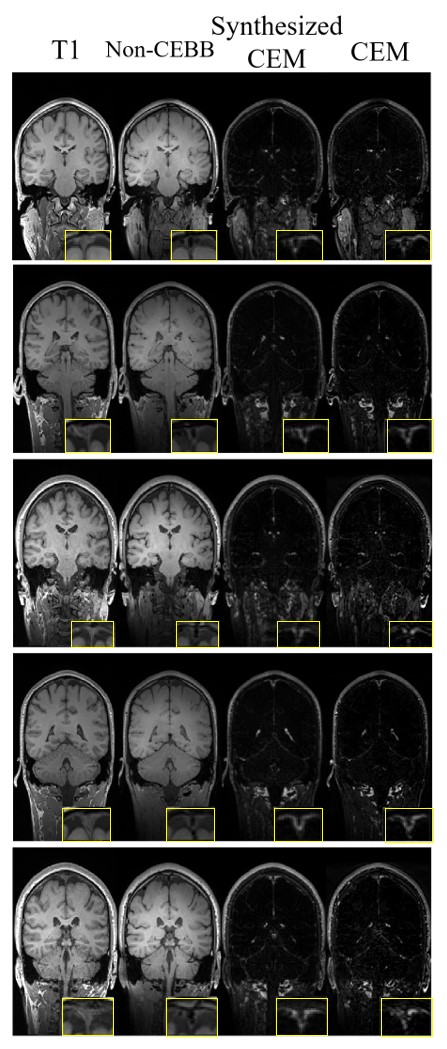
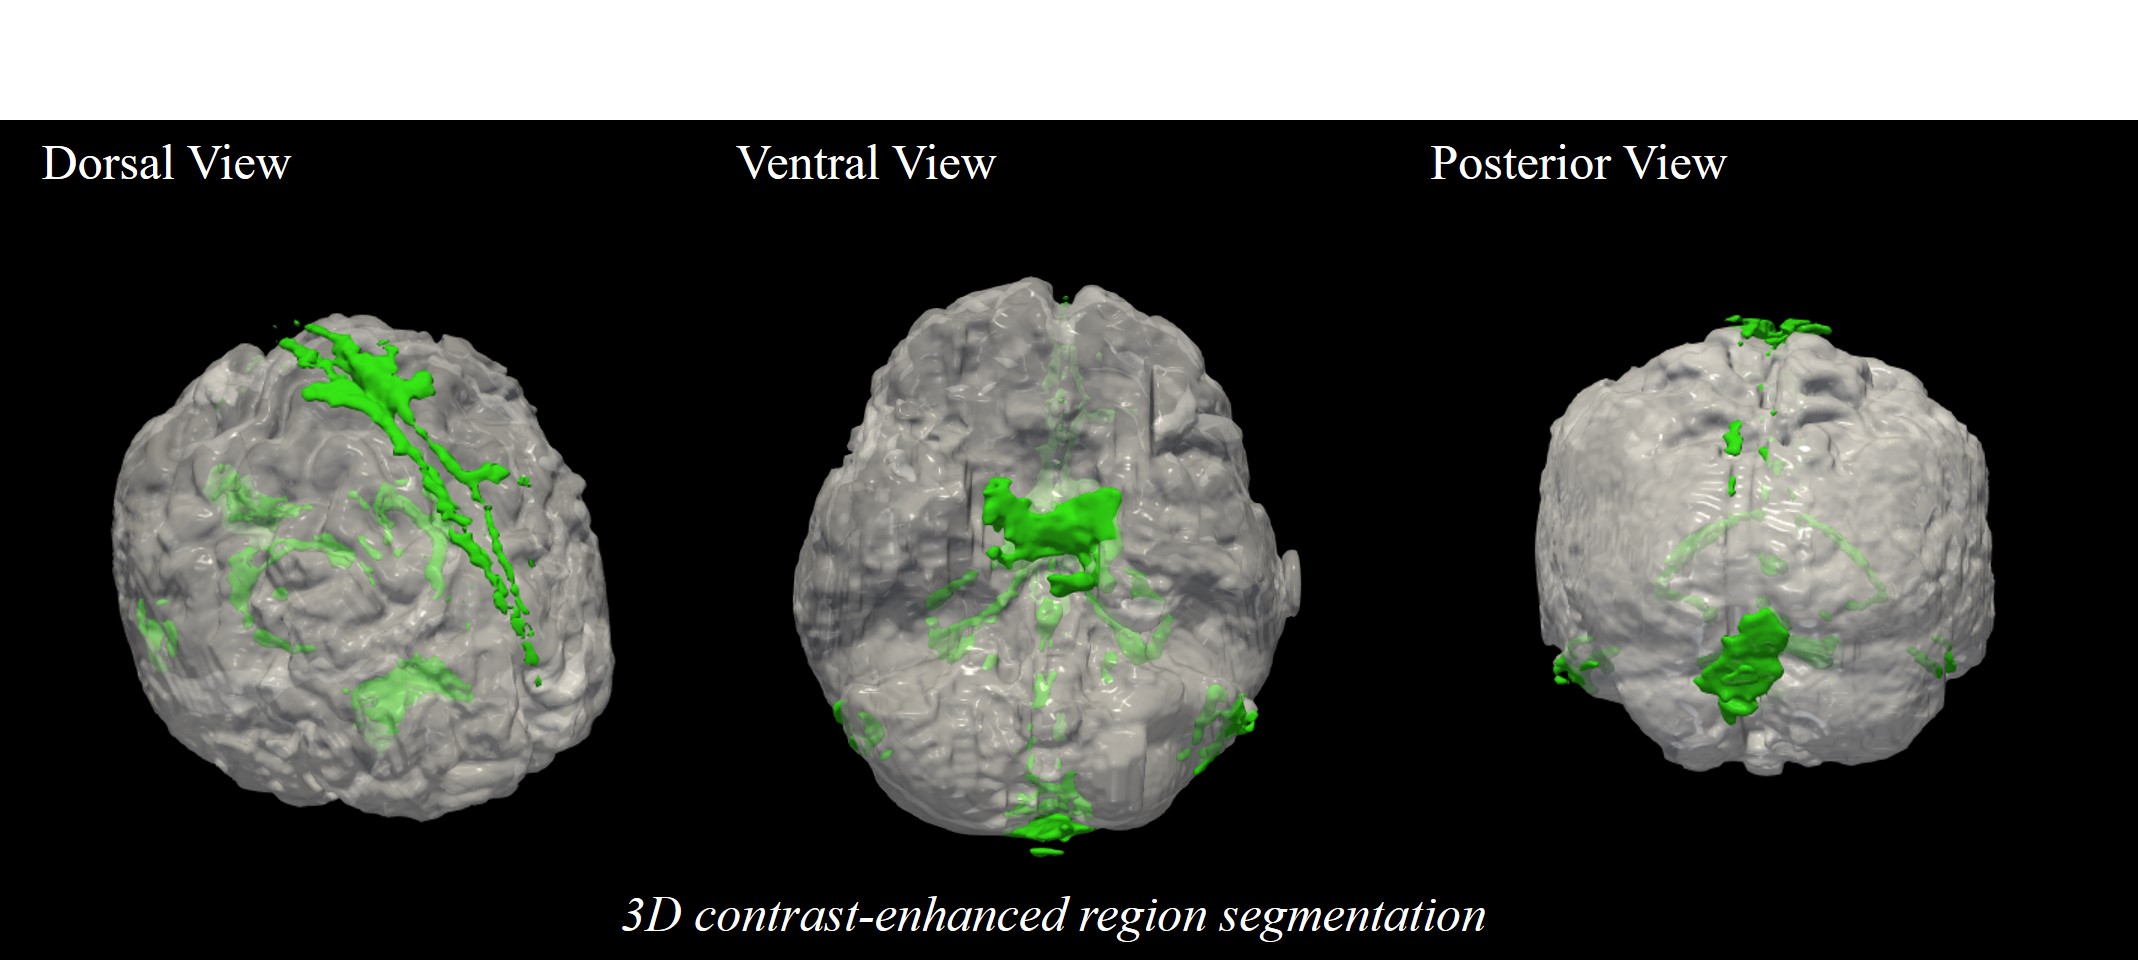
As we expected, concatenating T1 image with non-CEBB image for additional information did help to improve image synthesis performance (Table.1). For perceptual loss using lower layer feature map from VGG-net, it did not enhance network performance and provided more blur images than the previous models without perceptual loss (Table.1). We changed VGG-net feature layers from higher layers to lower layers to measure perceptual loss. The model with perceptual loss with lower layers of VGG-net and 2-channel input performed best, thus we used this setting to make CEM from non-CEBB images (Table.1).The contrast-enhanced map (CEM) was synthesized from the non-CEBB and T1 image (Fig.3). After applying skull stripping to synthesized CEM, the 3D CEM segmentation model was demonstrated by applying intensity threshold (Fig.4).
Discussion
In this study, we proposed a deep learning method of mapping meningeal lymphatic related regions non-invasively by synthesizing CEM from non-CEBB and T1 image. T1 images that were used as a secondary input with black-blood data helped the network to better distinguish lymphatic regions from blood vessel regions (Fig.2, Table.1). From the 3D CEM segmentation, enhancement distribution was consistent with that of previous studies, which was mainly distributed in dorsal parasagittal dura, parasagittal regions, brain basal region and around choroid plexus4,5,6(Fig.3,4). There is still some ambiguity in identifying and segmenting meningeal lymphatics throughout the brain by manual interpretation. This study can be applied to the segmentation of the lymphatic region of the brain with less ambiguity. This study can be expanded by adapting the self-supervised learning to help with automatic segmentation instead of intensity-based method.Acknowledgements
No acknowledgement found.References
[1] Louveau, Antoine, et al. "Understanding the functions and relationships of the glymphatic system and meningeal lymphatics." The Journal of clinical investigation 127.9 (2017): 3210-3219.
[2] Da Mesquita, Sandro, et al. "Functional aspects of meningeal lymphatics in ageing and Alzheimer’s disease." Nature 560.7717 (2018): 185-191.
[3] Ahn, Ji Hoon, et al. "Meningeal lymphatic vessels at the skull base drain cerebrospinal fluid." Nature 572.7767 (2019): 62-66.
[4] Absinta, M., et al., Human and nonhuman primate meninges harbor lymphatic vessels that can be visualized noninvasively by MRI. Elife, 2017. 6.
[5] Jacob, L., et al., Conserved meningeal lymphatic drainage circuits in mice and humans. J Exp Med, 2022. 219(8).
[6] Park, M., et al., Aging Is Positively Associated with Peri-Sinus Lymphatic Space Volume: Assessment Using 3T Black-Blood MRI. J Clin Med, 2020. 9(10).
[7] Z. Yaniv, B. C. Lowekamp, H. J. Johnson, R. Beare, “SimpleITK Image-Analysis Notebooks: a Collaborative Environment for Education and Reproducible Research”, J Digit Imaging., doi: 10.1007/s10278-017-0037-8, 31(3): 290-303, 2018.
[8] Ledig, Christian, et al. "Photo-realistic single image super-resolution using a generative adversarial network." Proceedings of the IEEE conference on computer vision and pattern recognition. 2017.
Figures