1464
The impact of infusion rate on Gd-DTPA transport in the glymphatic system in mouse brain1Department of Biomedical Engineering, Case Western Reserve University, Cleveland, OH, United States, 2Department of Biomedical Engineering, University of Michigan, Ann Arbor, MI, United States, 3Department of Radiology, Case Western Reserve University, Cleveland, OH, United States, 4Department of Pediatrics, Case Western Reserve University, Cleveland, OH, United States, 5Department of Physiology and Biophysics, Case Western Reserve University, Cleveland, OH, United States
Synopsis
Keywords: Neurofluids, Contrast Agent, Glymphatic system
This study evaluated the impact of infusion rate on tracer transport in mouse glymphatic system. Gd-DTPA was administered via cisterna magna at a rate either comparable to the CSF production rate in mouse brain (0.33 μL/min) or three-fold higher (1 μL/min). The kinetics and distribution of Gd-DTPA were assessed by DCE-MRI for 2 hours. Our results show a significantly increased transport along the dorsal brain regions and penetration into the deep brain regions at a slow infusion rate, suggesting that the infusion rate may alter the pressure gradient and affect tracer transport and distribution in the brain.Introduction
Recent investigation on the transport of perivascular cerebrospinal fluid (CSF) and its exchange with the interstitial fluid (ISF) has led to the recognition of the glymphatic system and its role in solute transport and waste removal.1 Glymphatic function has been extensively studied using intrathecally administered tracers, including dynamic contrast-enhanced MRI (DCE-MRI) studies in combination with gadolinium-based contrast agents (GBCAs). Studies employing rodent models, especially genetically manipulated mouse models of human diseases, provide the opportunity for understanding the role of the glymphatic system in disease progression.2 However, the optimal tracer infusion rate is yet to be determined. While previous studies in mice suggest that a total volume of 1-10 μL at an infusion rate of 1-2 μL/min induce only mild and transient changes in intracranial pressure,3 the impact of such disturbances on CSF flow and tracer transport remain to be elucidated.4,5In this study, we investigated the transport kinetics and distribution patterns of Gd-DTPA administered intracisternally at two different infusion rates: a fast infusion rate (1 μL/min for 10 min) commonly used in most studies on the glymphatic system employing mouse models,2 and a slow infusion rate (0.33 μL/min for 30 min) that is comparable to the estimated CSF production rate in mouse brain.6 Our results show that these two different infusion rates led to significantly different kinetics and distribution patterns in the transport of Gd-DTPA.
Methods
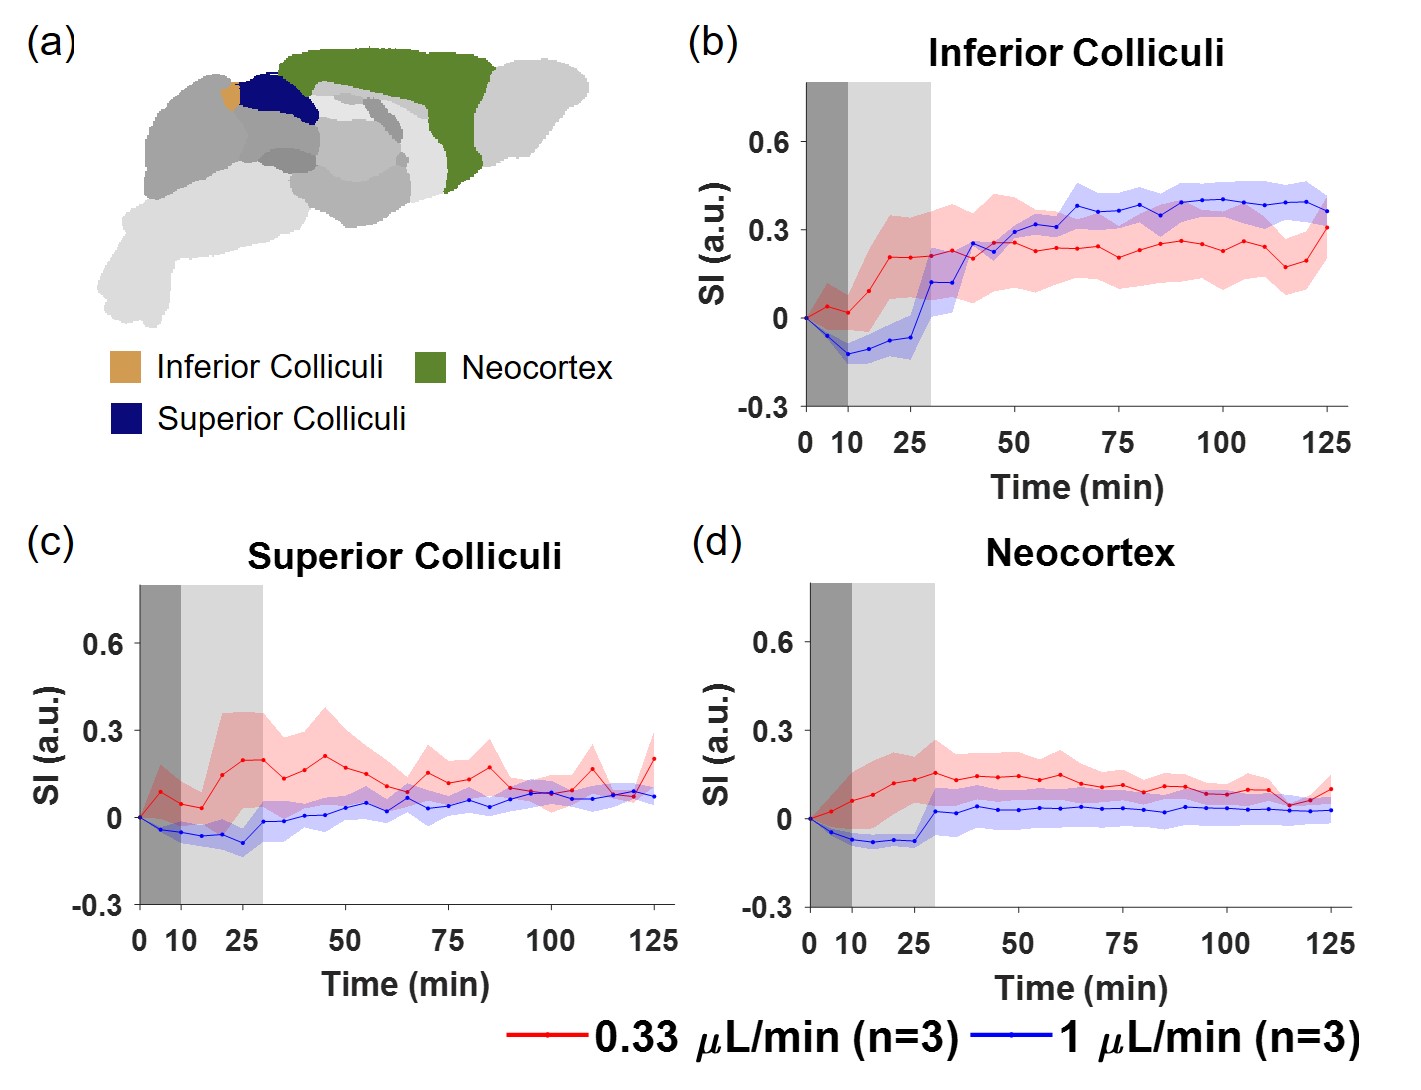
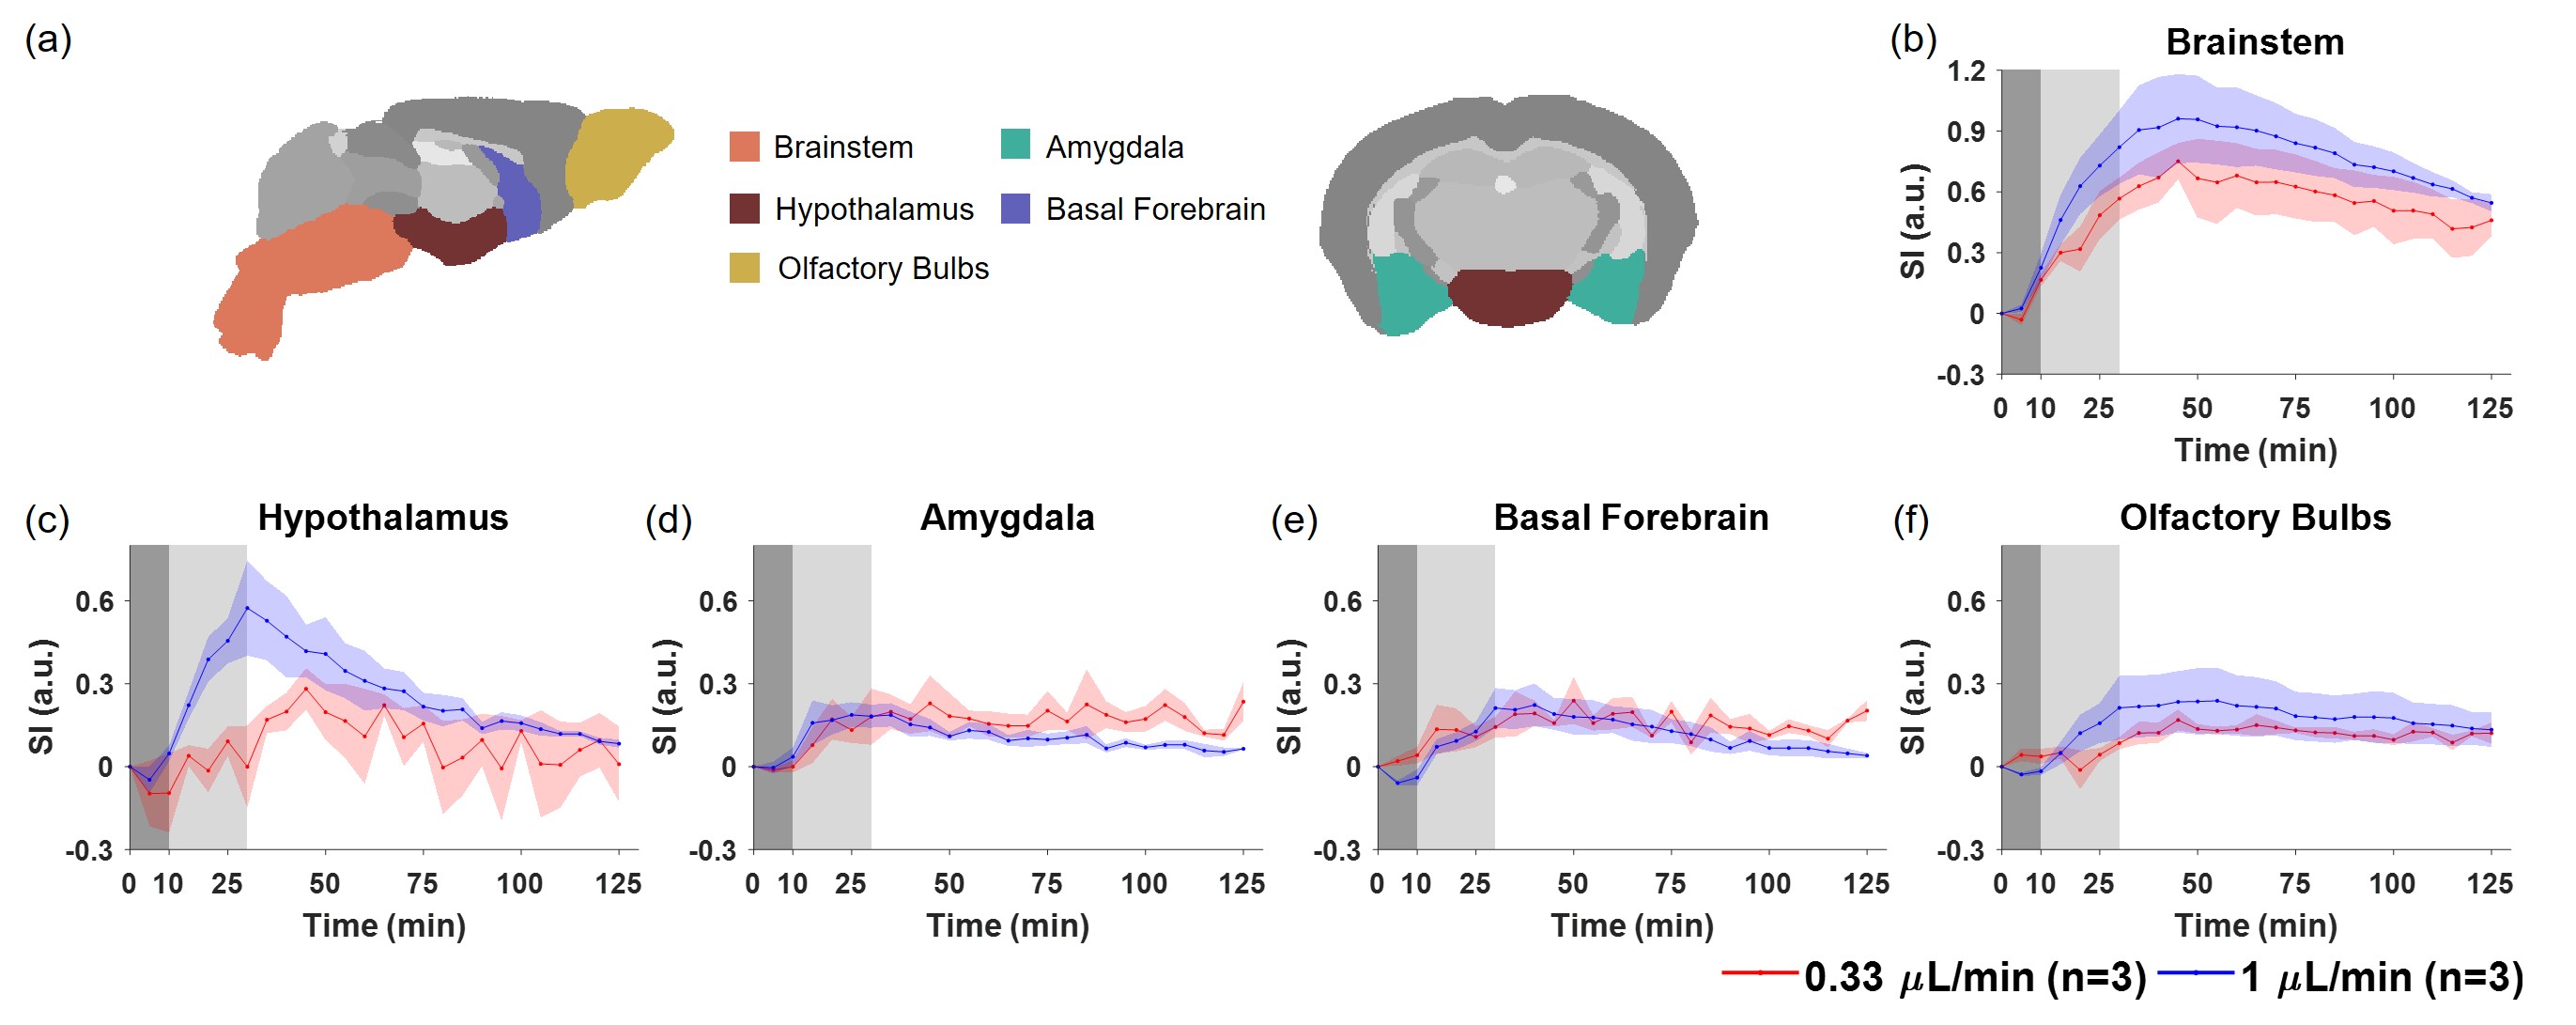
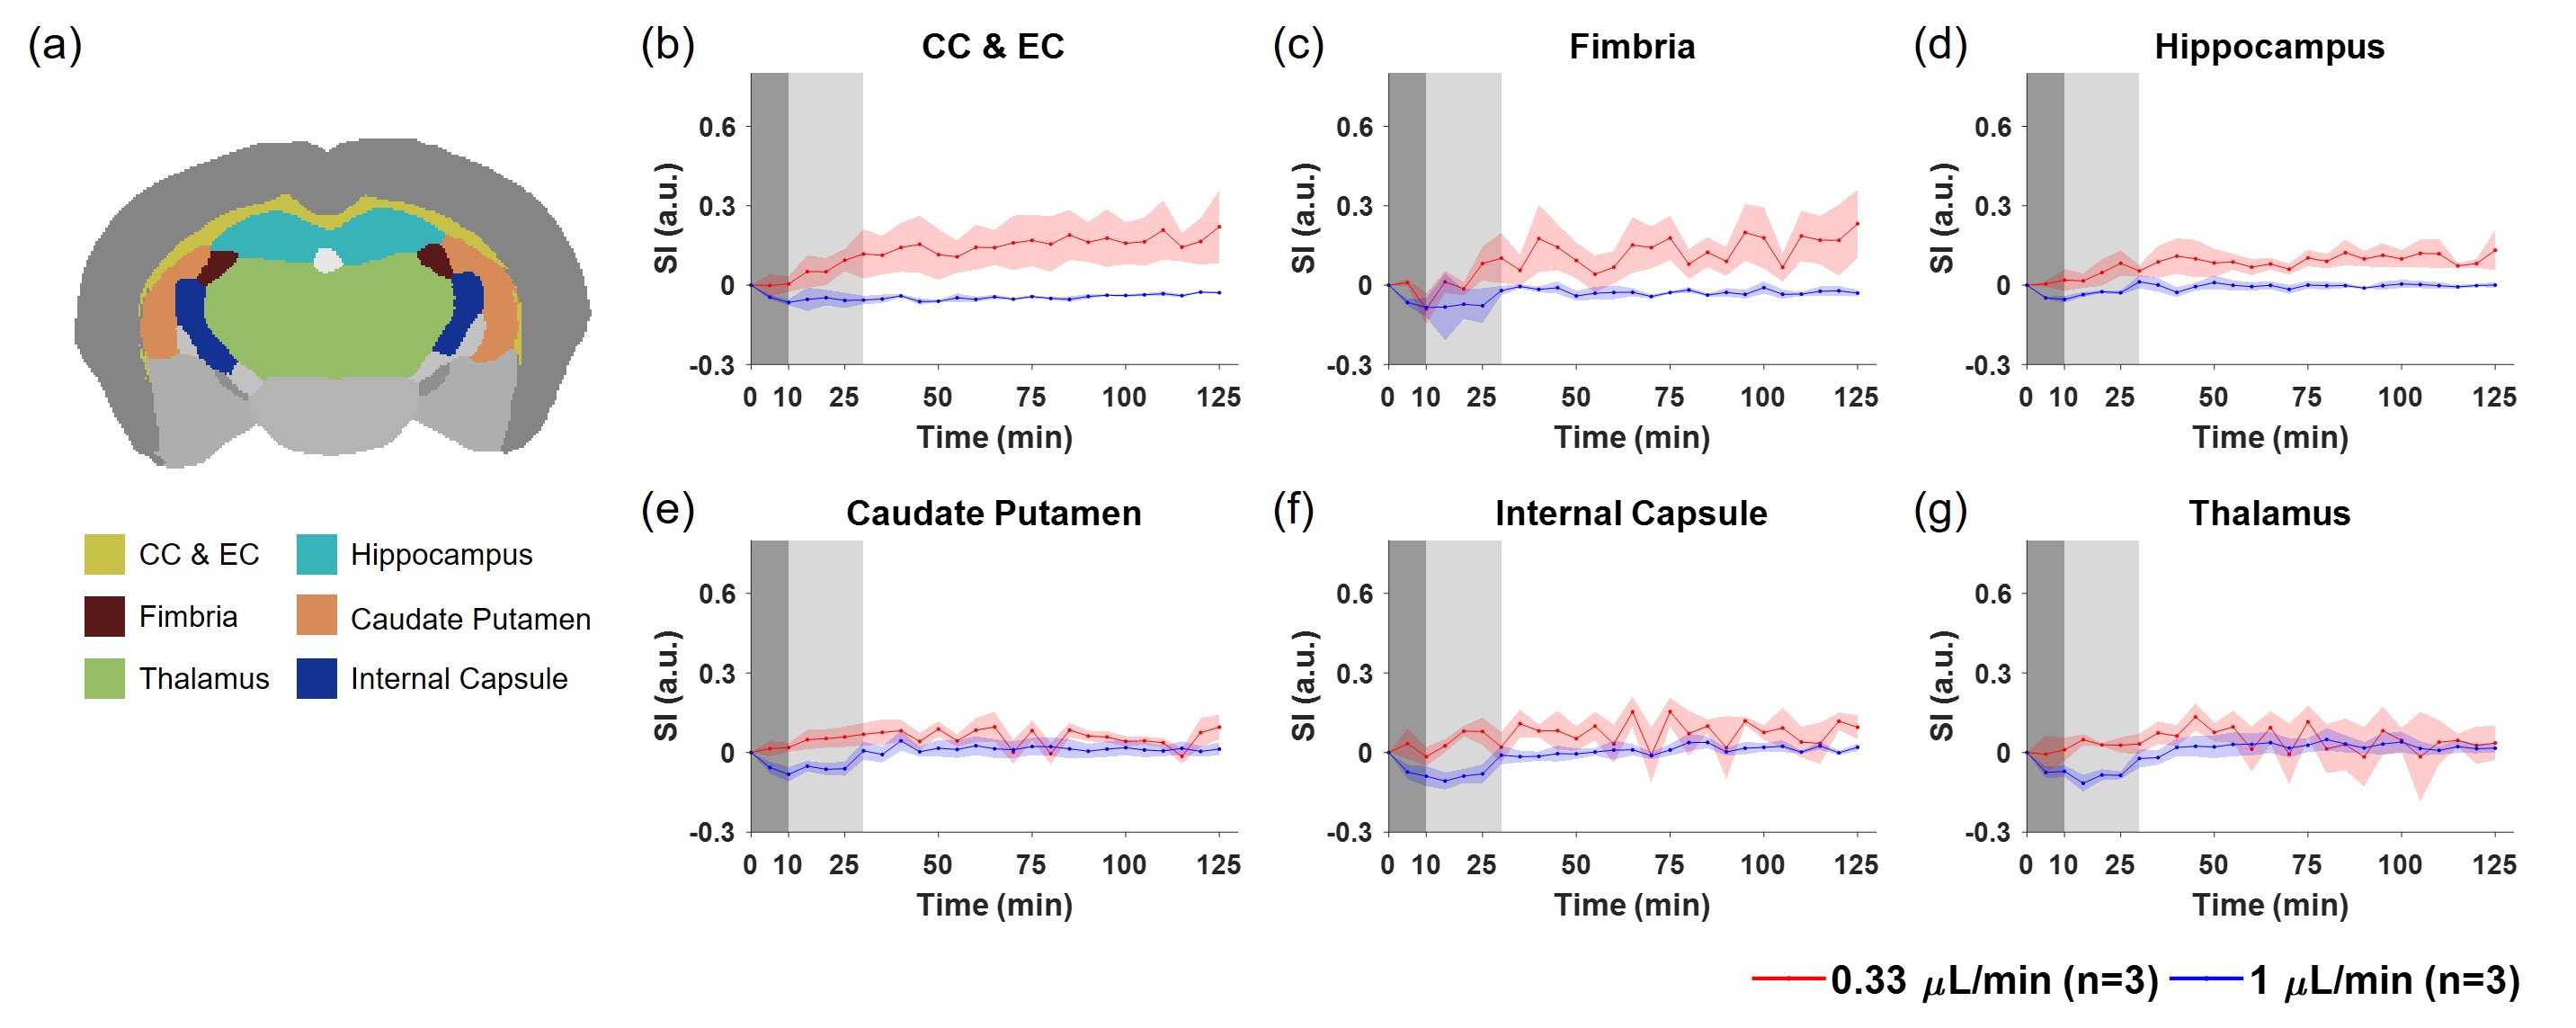
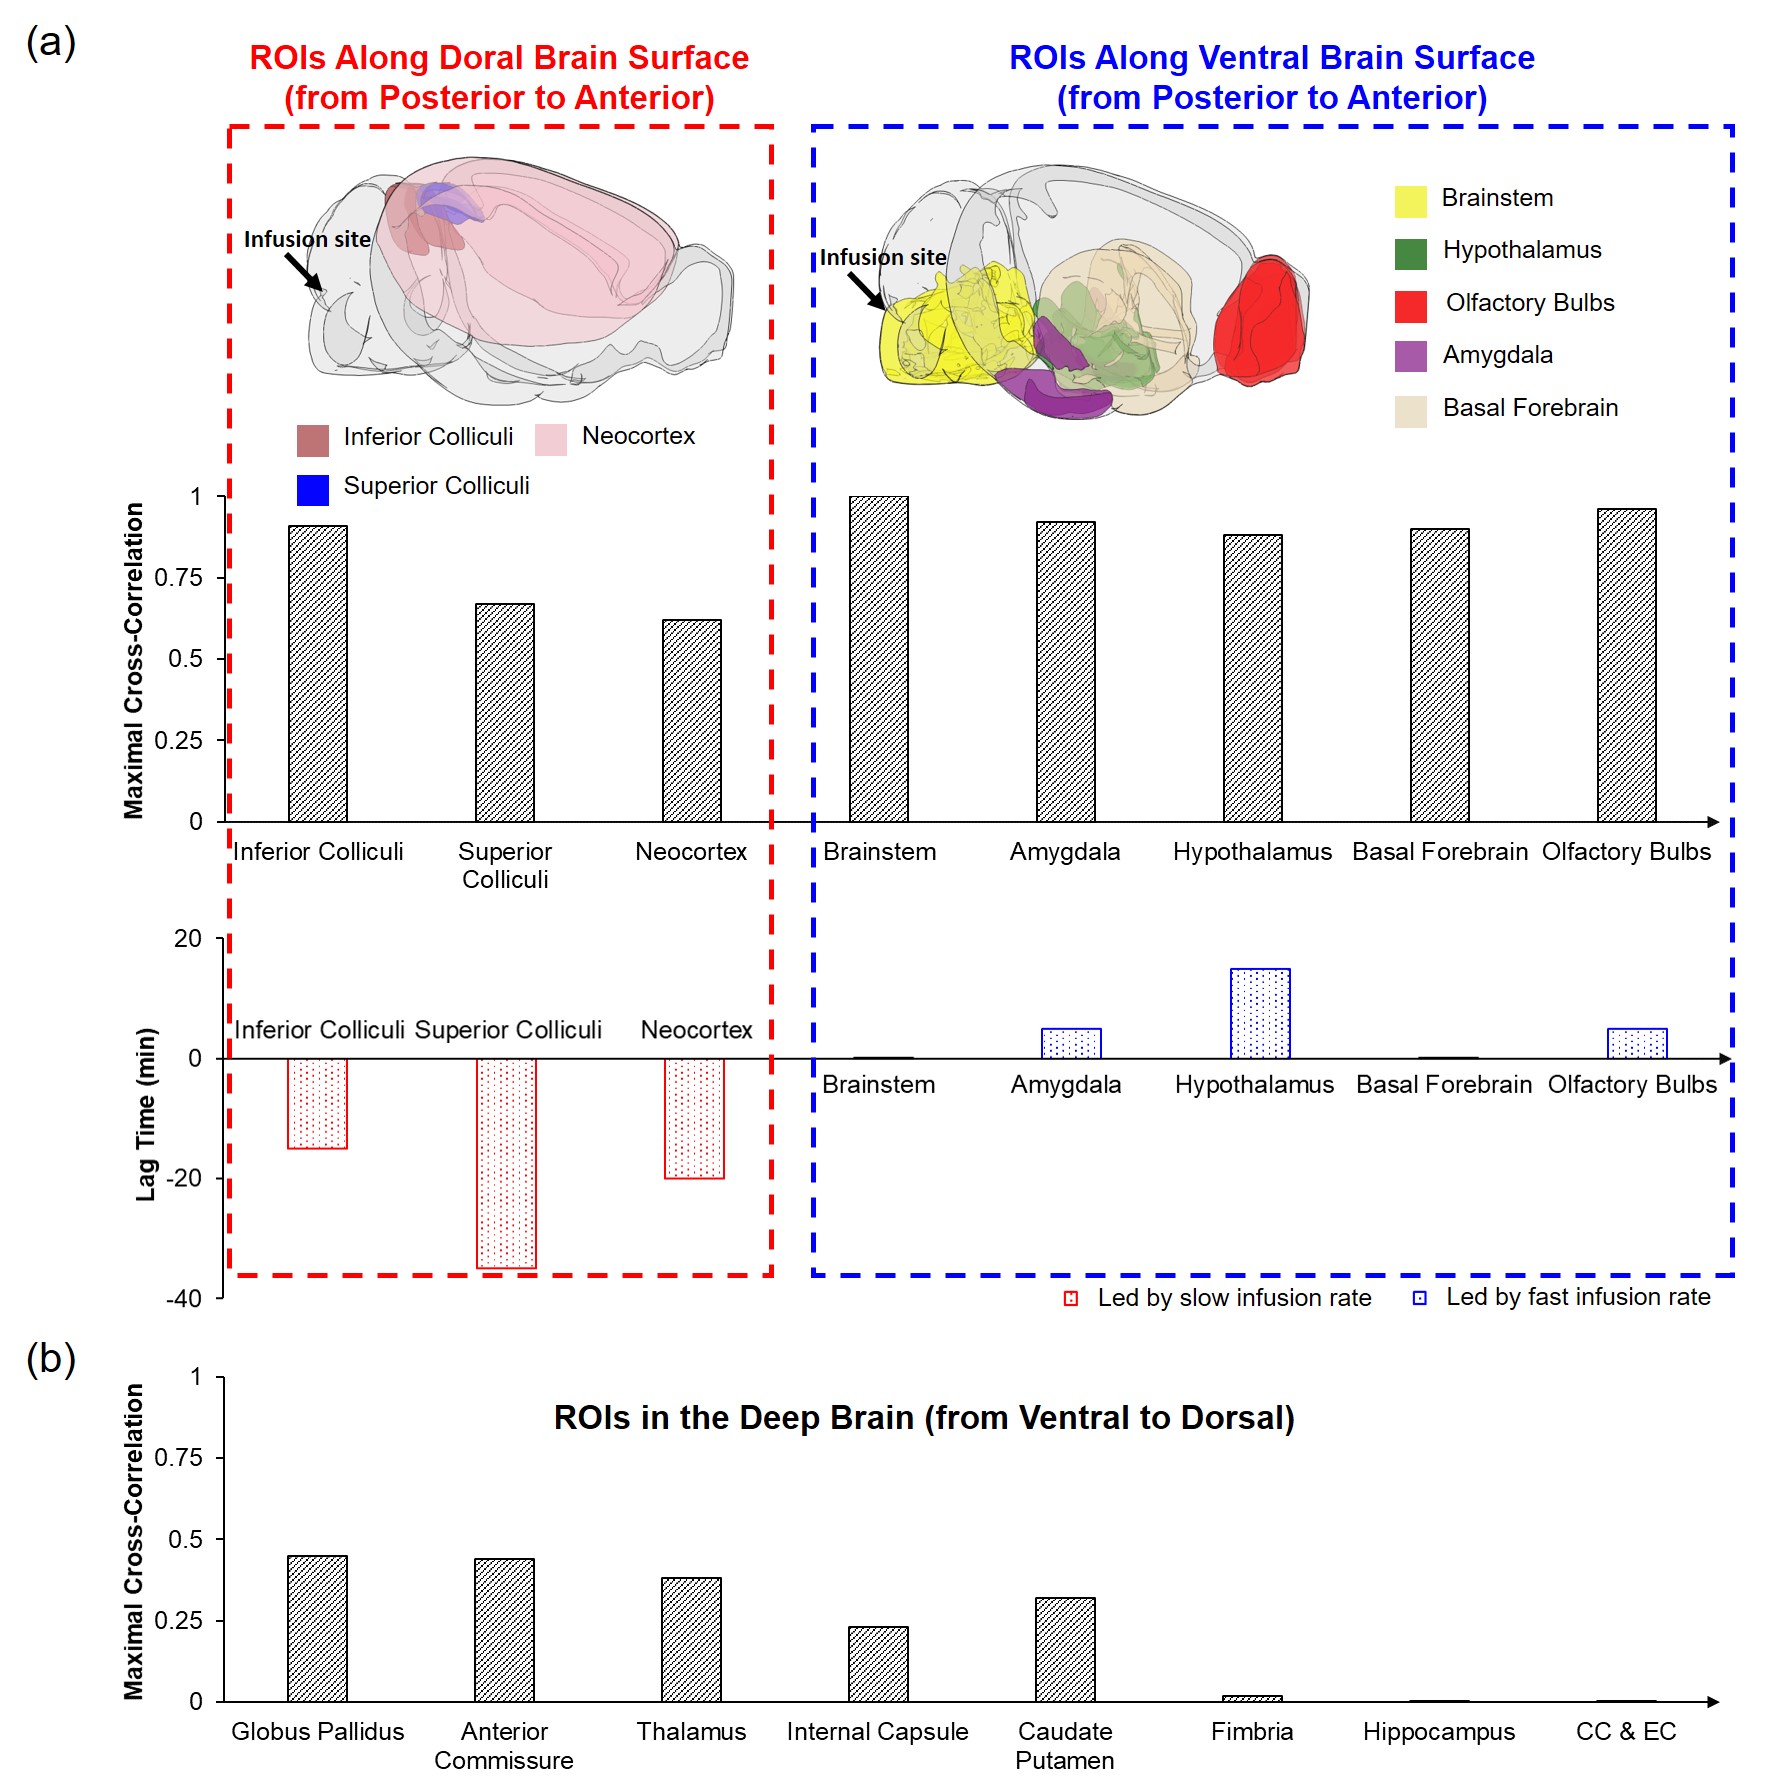
Experimental Protocol: MRI studies were performed on a Bruker 9.4T scanner, using an 86-mm volume coil as the transmitter and a 4-channel phased-array coil as the receiver. 10- to 12-week-old male C57BL/6J mice were randomly assigned to receive intracisternal infusion of 10 μL of 12.5 mM Gd-DTPA at an infusion rate of either 1 μL/min for 10 min (n=3), or at 0.33 μL/min for 30 min (n=3). The transport of Gd-DTPA from cisterna magna to the whole brain was tracked by a T1-weighted 3D FLASH sequence with following parameters: TR/TE, 50/2.8 ms; flip angle, 20°; FOV, 20×16×14 mm3; matrix size, 150×120×105; yielding an isotropic resolution of 133 μm and a temporal resolution of ~5 min. Before Gd-DTPA infusion, a baseline image was acquired with 2 averages, followed by the acquisition of 25 single-average dynamic images for 2 hours.Data analysis: All image analyses were performed using in-house developed or open-source MATLAB or Python software.7,8 Regions of interest (ROIs) that covered the dorsal, ventral, and deep brain regions were generated by co-registering motion-corrected images to an MRI mouse brain atlas using the ANTs toolbox.7,9 The maximal signal change in the cerebellum proximal to the infusion site was used to normalize the time courses of signal change in all ROIs. Time-lagged cross-correlation analysis was performed to compare the kinetics of signal changes induced by two different infusion rates in all ROIs.
Results
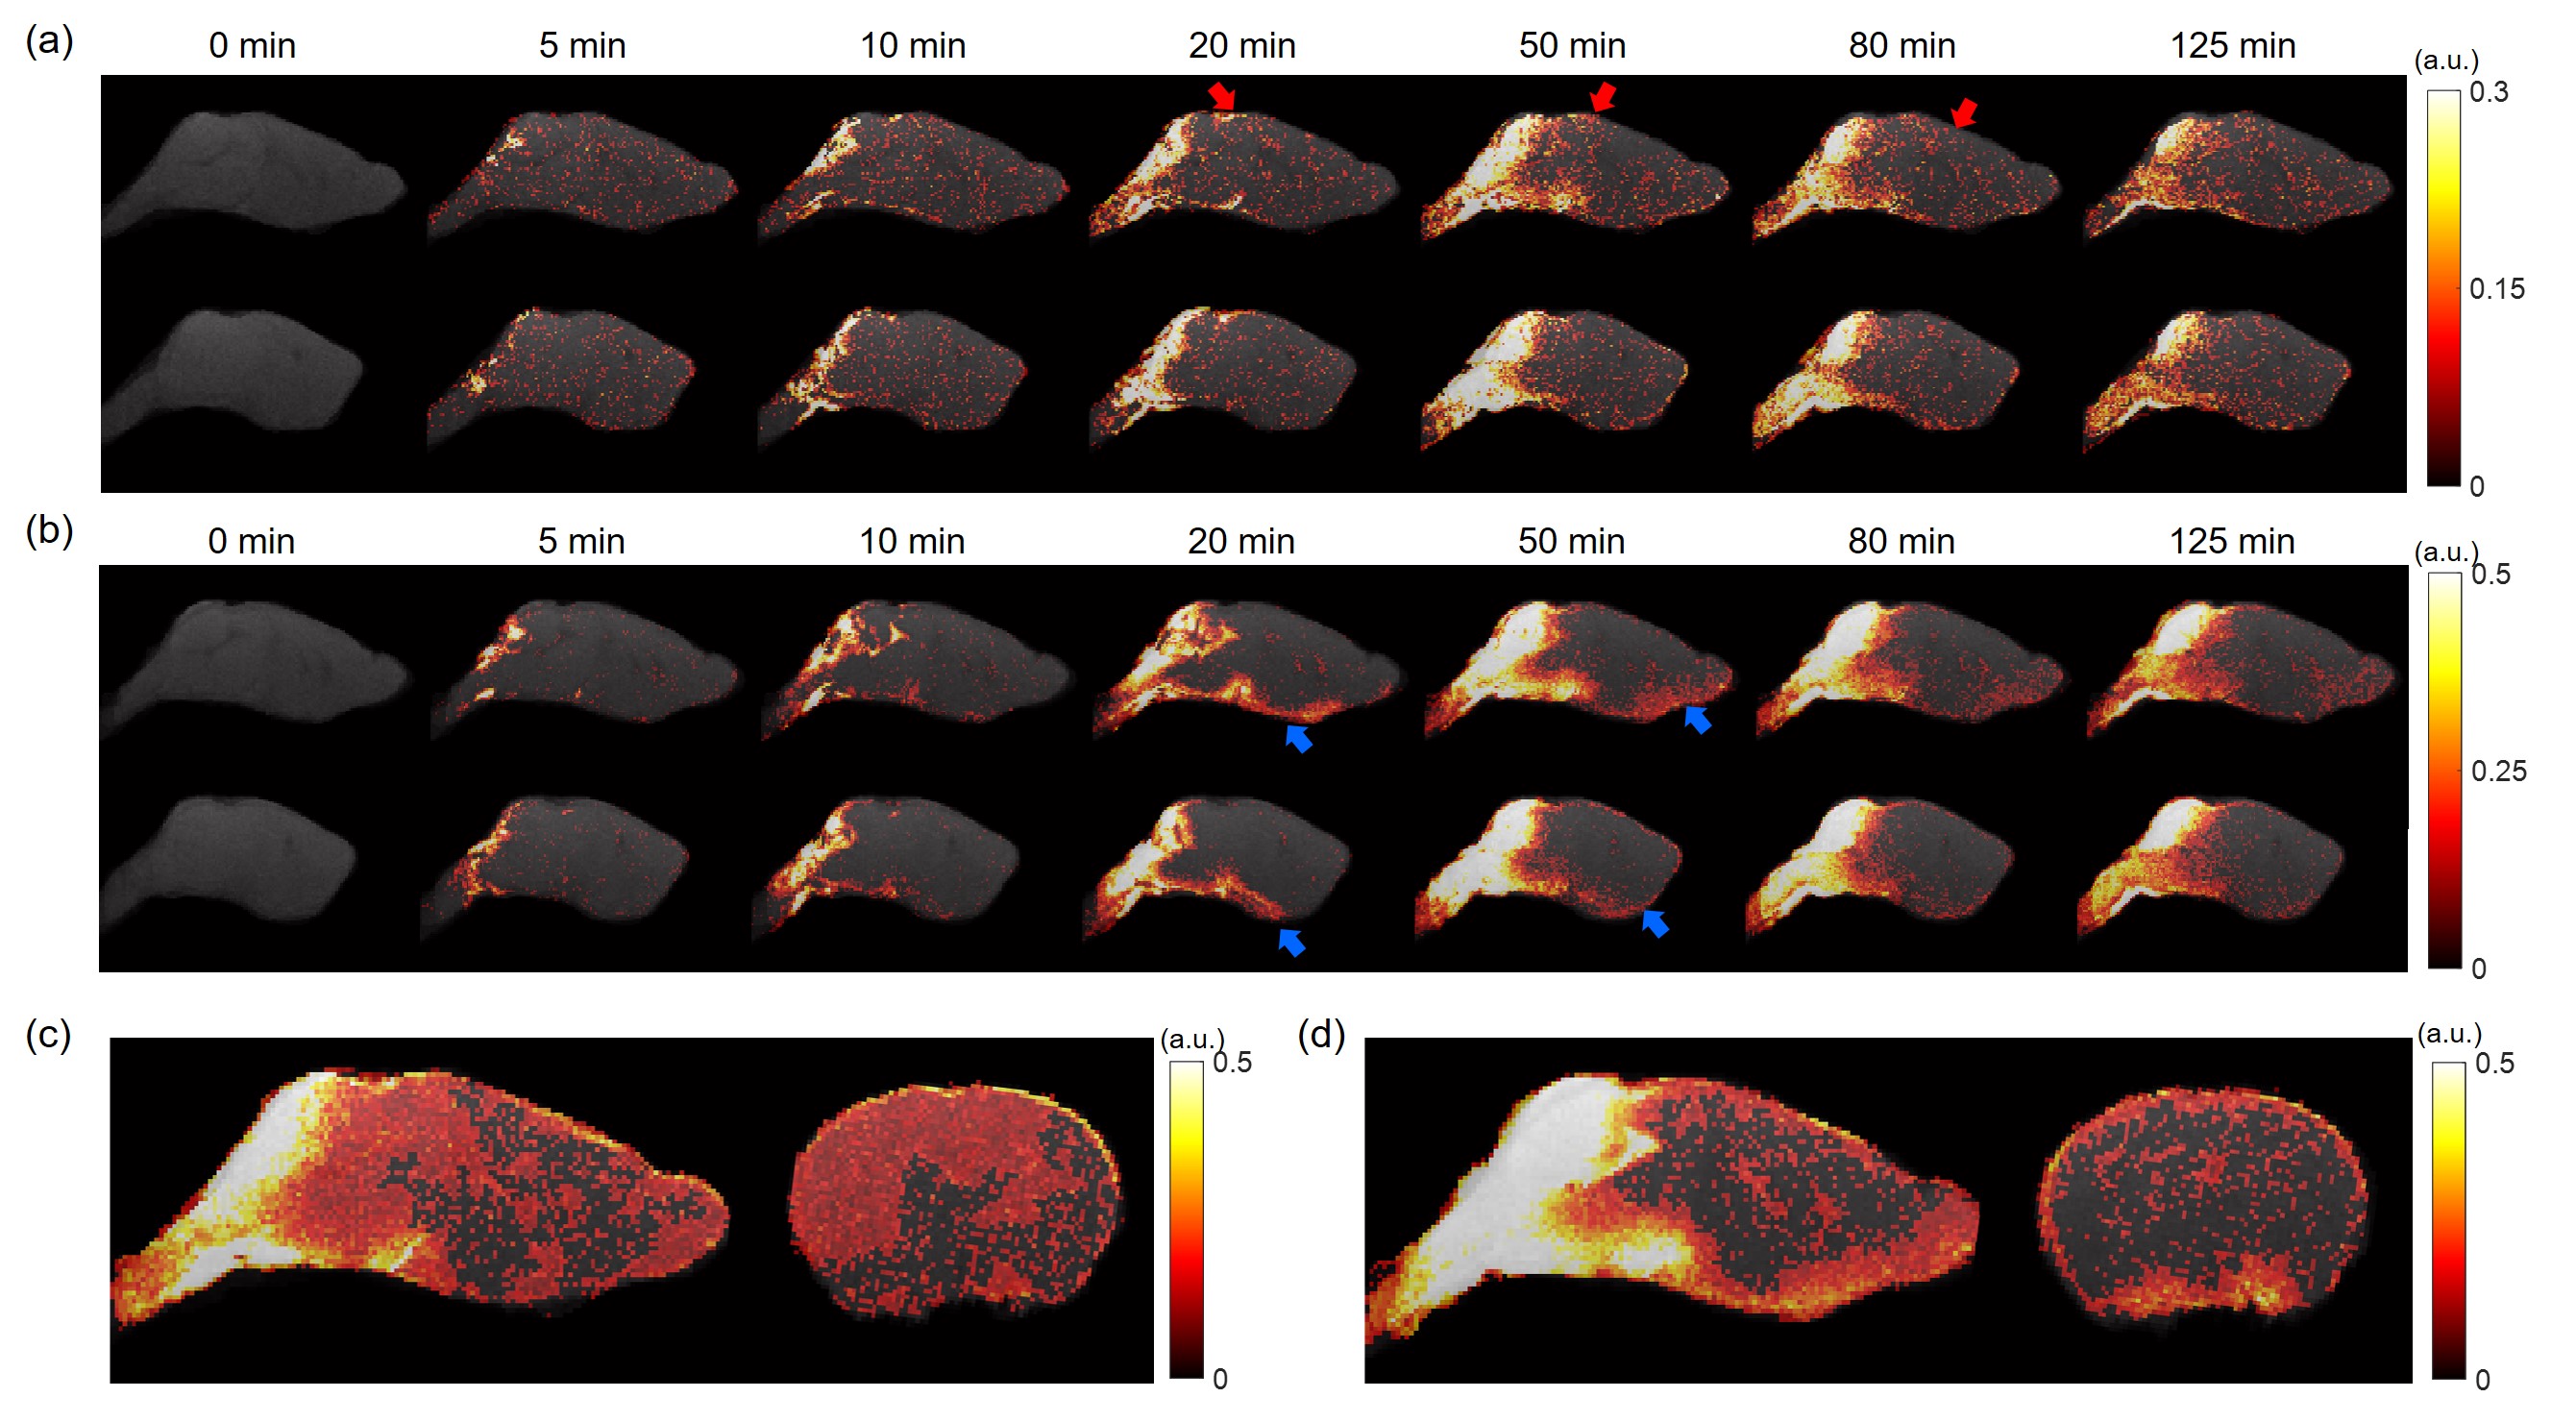
Figure 1 shows the averaged dynamic images and time maximum intensity projections (tMIPs). The slow infusion rate led to more extensive Gd-DTPA transport along the dorsal side of the brain, as well as more penetration into the deep brain (Figure 1(a)&(c)). In contrast, a fast infusion rate gave rise to more dominant transport along the ventral surface (Figure 1(b)&(d)). These differences in Gd-DTPA transport can also be appreciated from the time courses of signal changes, where ROIs in the dorsal region showed fast Gd-DTPA transport and more pronounced signal increase in mice with a slow infusion rate (Figure 2), and mice with a fast infusion rate showed fast Gd-DTPA transport and larger signal increase on the ventral side (Figure 3). In the deep brain region, Gd-DTPA penetration was more extensive in mice with a slow infusion rate, especially in those ROIs that are proximal to the dorsal side (Figure 4). Further, mice with the fast infusion rate showed negligible signal enhancement in the deep brain region.Comparison of the time courses of signal changes showed a high correlation coefficient in ROIs in the ventral and dorsal regions between the two groups, suggesting similar Gd-DTPA transport kinetics in these ROIs (Figure 5(a)). Further, the negative lag time in the dorsal ROIs and positive lag time in the ventral ROIs suggest that mice with a slow infusion rate showed faster Gd-DTPA transport in the dorsal region but slower transport in the ventral region compared to mice with a fast infusion rate. In the deep brain region, correlation coefficient was <0.5, suggesting less similarity in transport kinetics between the two groups, especially in the three ROIs proximal to the dorsal brain where Gd-DTPA penetration was negligible in mice with a fast infusion rate (Figure 5(b)).
Discussion and Conclusion
To date, most studies on mouse glymphatic function have used a fast infusion rate of ~1 μL/min in the administration of intracisternal tracers. While this infusion rate may cause only mild and transient disturbance to the intracranial pressure,3 the current study suggests that the infusion rate can significantly impact Gd-DTPA transport kinetics and distribution patterns in the mouse brain. The mechanisms by which tracer infusion interacts with CSF flows leading to the observed difference in Gd-DTPA transport should be the focus of future investigation.Acknowledgements
This work was supported by grants from the U.S. National Institute of Health (R01 NS124206 and R01 EB023704).References
1. Iliff JJ, Wang M, Liao Y, et al. A Paravascular Pathway Facilitates CSF Flow Through the Brain Parenchyma and the Clearance of Interstitial Solutes, Including Amyloid β. Sci Transl Med; 4. Epub ahead of print 15 August 2012. DOI: 10.1126/scitranslmed.3003748.
2. Benveniste H, Lee H, Ozturk B, et al. Glymphatic Cerebrospinal Fluid and Solute Transport Quantified by MRI and PET Imaging. Neuroscience 2021; 474: 63–79.
3. Xue Y, Liu X, Koundal S, et al. In vivo T1 mapping for quantifying glymphatic system transport and cervical lymph node drainage. Sci Rep 2020; 10: 14592.
4. Ding G, Chopp M, Li L, et al. MRI investigation of glymphatic responses to Gd-DTPA infusion rates. J Neurosci Res 2018; 96: 1876–1886.
5. Bedussi B, van der Wel NN, de Vos J, et al. Paravascular channels, cisterns, and the subarachnoid space in the rat brain: A single compartment with preferential pathways. J Cereb Blood Flow Metab 2017; 37: 1374–1385.
6. Pardridge WM. CSF, blood-brain barrier, and brain drug delivery. Expert Opin Drug Deliv 2016; 13: 963–975.
7. Avants BB, Tustison NJ, Song G, et al. A reproducible evaluation of ANTs similarity metric performance in brain image registration. NeuroImage 2011; 54: 2033–2044.
8. Claudi F, Tyson AL, Petrucco L, et al. Visualizing anatomically registered data with brainrender. eLife 2021; 10: e65751.
9. Ma Y, Hof PR, Grant SC, et al. A three-dimensional digital atlas database of the adult C57BL/6J mouse brain by magnetic resonance microscopy. Neuroscience 2005; 135: 1203–1215.
Figures