1461
Real-Time Imaging of Cerebrospinal Fluid Flow with Low-Rank and Subspace Modeling1Institute of Science and Technology for Brain-Inspired Intelligence, Fudan University, Shanghai, China, 2Department of Radiology, Zhongshan Hospital, Fudan University, Shanghai, China, 3Department of Biomedical Engineering, University of Texas at Austin, Austin, TX, United States, 4Philips Healthcare, Shanghai, China, 5Oden Institute for ComputationalEngineering and Sciences, University of Texas at Austin, Austin, TX, United States
Synopsis
Keywords: Neurofluids, Velocity & Flow
Quantification of cerebrospinal fluid (CSF) flow is critical for studying the physiological and pathological mechanisms of CSF dynamics and related neurological diseases. Conventional cine phase-contrast MRI provides an effective tool to quantify CSF flow, however, this method is not suitable for evaluating beat-by-beat flow variabilities associated with cardiac arrhythmia and/or respiratory regulation. This work presents a real-time flow MRI method at a spatial resolution of 0.5 mm and temporal resolution of 52 ms for assessment of CSF flow in cerebral aqueduct at 3T, which can well resolve beat-by-beat CSF flow variations. Its feasibility has been demonstrated in multiple healthy subjects.Introduction
Cerebrospinal fluid (CSF) plays an important role in the brain health. Previous research studies have suggested that CSF provides mechanical protection from brain injury and is also instrumental in the removal of waste products from the central nervous system[1, 2]. Abnormal changes in the flow dynamics of CSF have been demonstrated in several neurological diseases, such as hydrocephalus[3] and Chiari malformations[4]. Given that the pulsation of CSF shares the similar rhythm to the blood flow, phase-contrast MRI (PC-MRI) with peripheral pulse transducer (PPU) synchronized cine acquisition has been widely used for quantitative assessment of CSF flow[5]. However, the conventional cine PC-MRI techniques are not well suited to evaluating beat-by-beat flow variability (e.g., associated with cardiac arrhythmia and/or respiratory regulation). Real-time flow imaging is a promising technique to overcome the above limitations[6, 7]. A recent study has shown promising results for aqueduct CSF at 7T[8]. In this work, we develop and evaluate a new real-time PC-MRI method for imaging the CSF flow in cerebral aqueduct at 3T.Methods
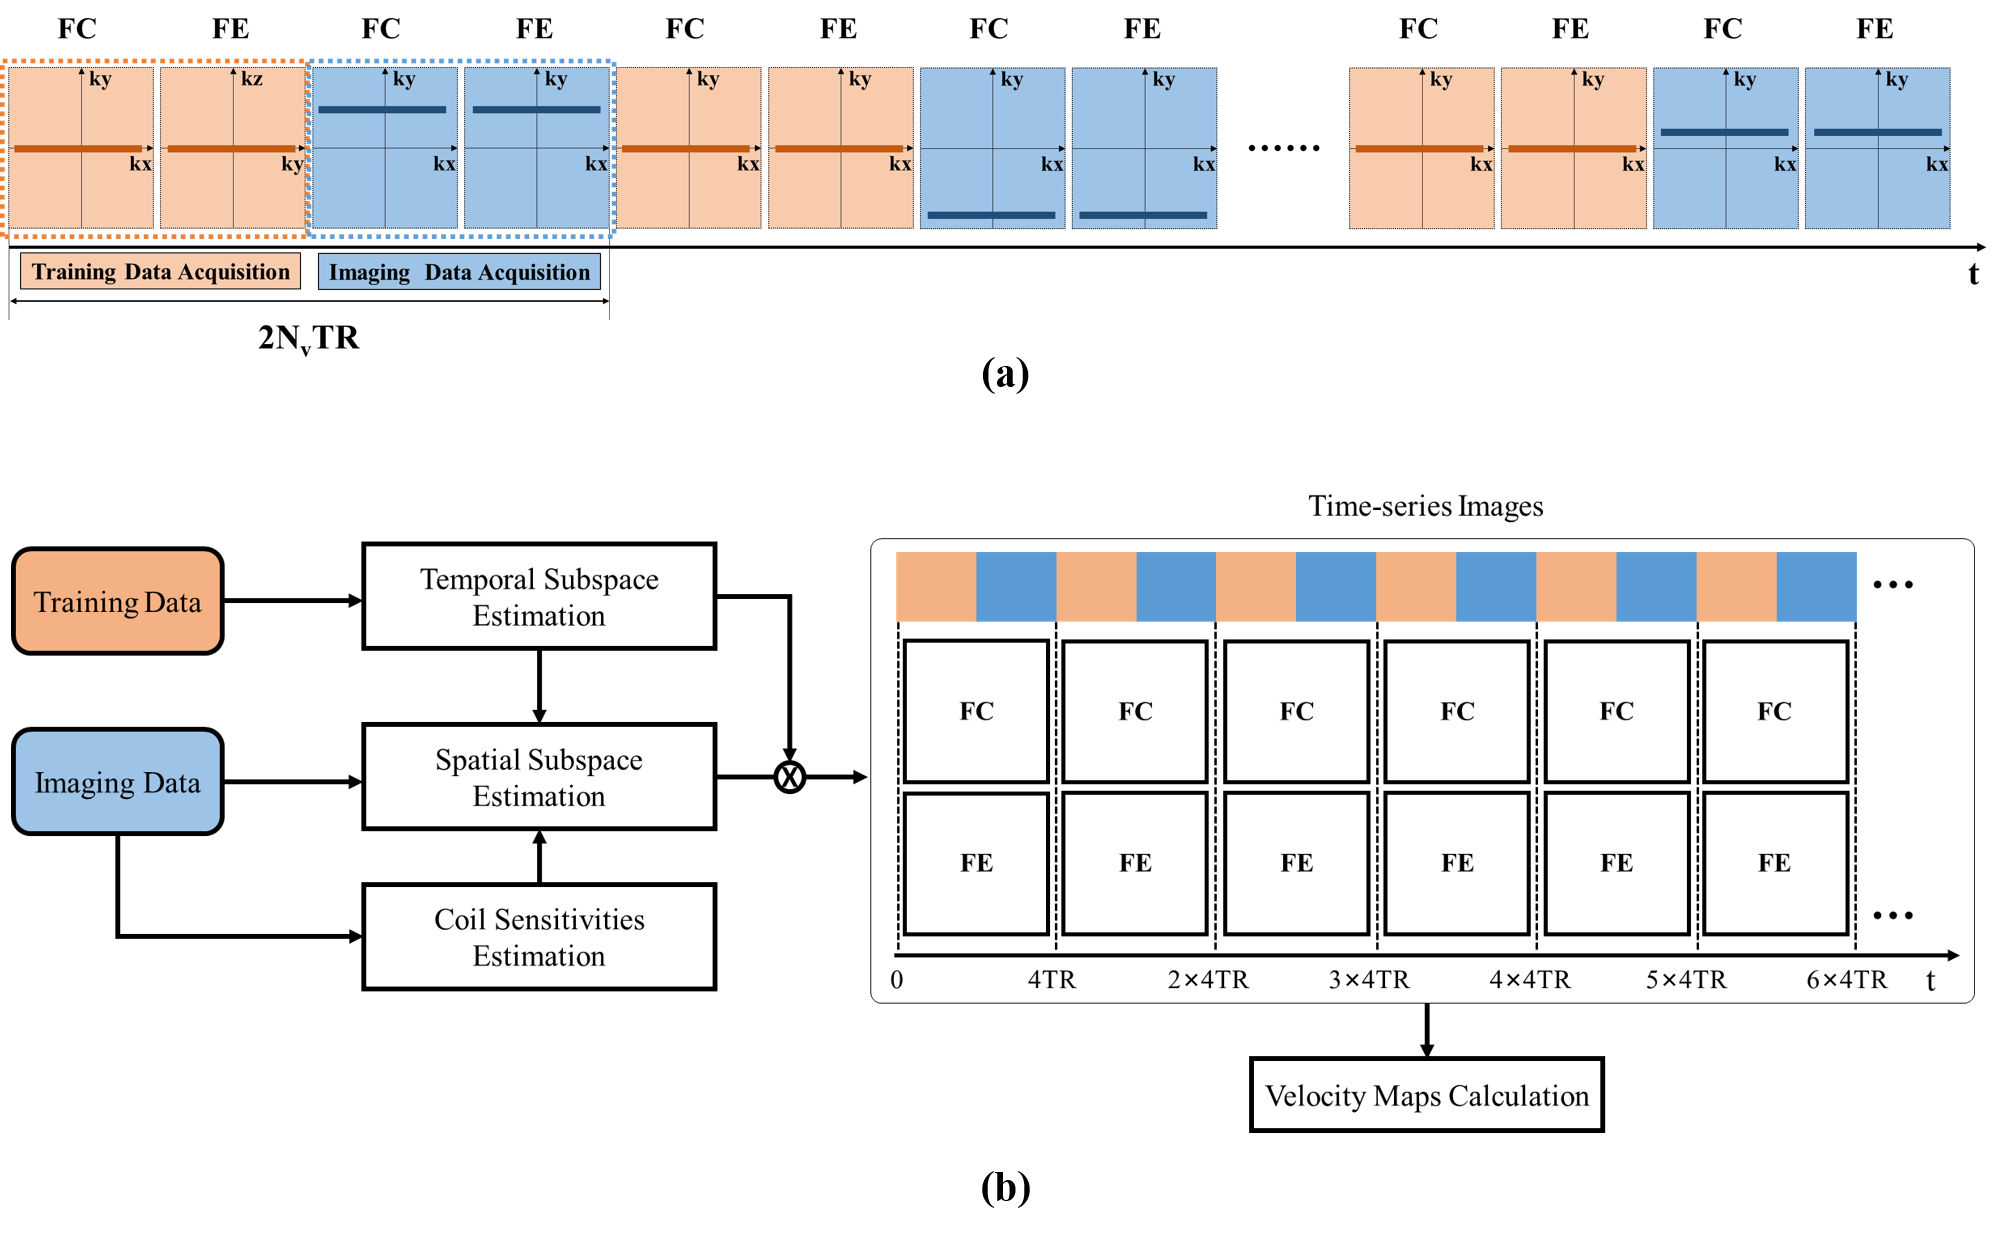
Data acquisition and image reconstruction:The proposed real-time 2D PC-MRI acquisition is illustrated in Fig. 1(a), where flow-compensated (FC) and through-plane flow-encoded (FE) data were acquired. Specifically, an interleaved sampling pattern was used to collect two sets of (k, t)-space data, including training and imaging data. Here, the training data are sampled from the central k-space with a high temporal resolution, while the imaging data are sampled in a uniform random manner from the outer k-space with a high spatial resolution. Here we performed a low-rank and subspace reconstruction for the highly-accelerated real-time PC-MRI. We first estimate the temporal subspace from the temporal training data, and calculate the coil sensitivity maps from the time-averaged imaging data. Then we determine the spatial subspace by solving the resulting low-rank reconstruction problem. After image reconstruction, the time-series through-plane velocity maps can be obtained. We illustrate the procedure of the image reconstruction process in Fig. 1(b).
MR scan experiments:
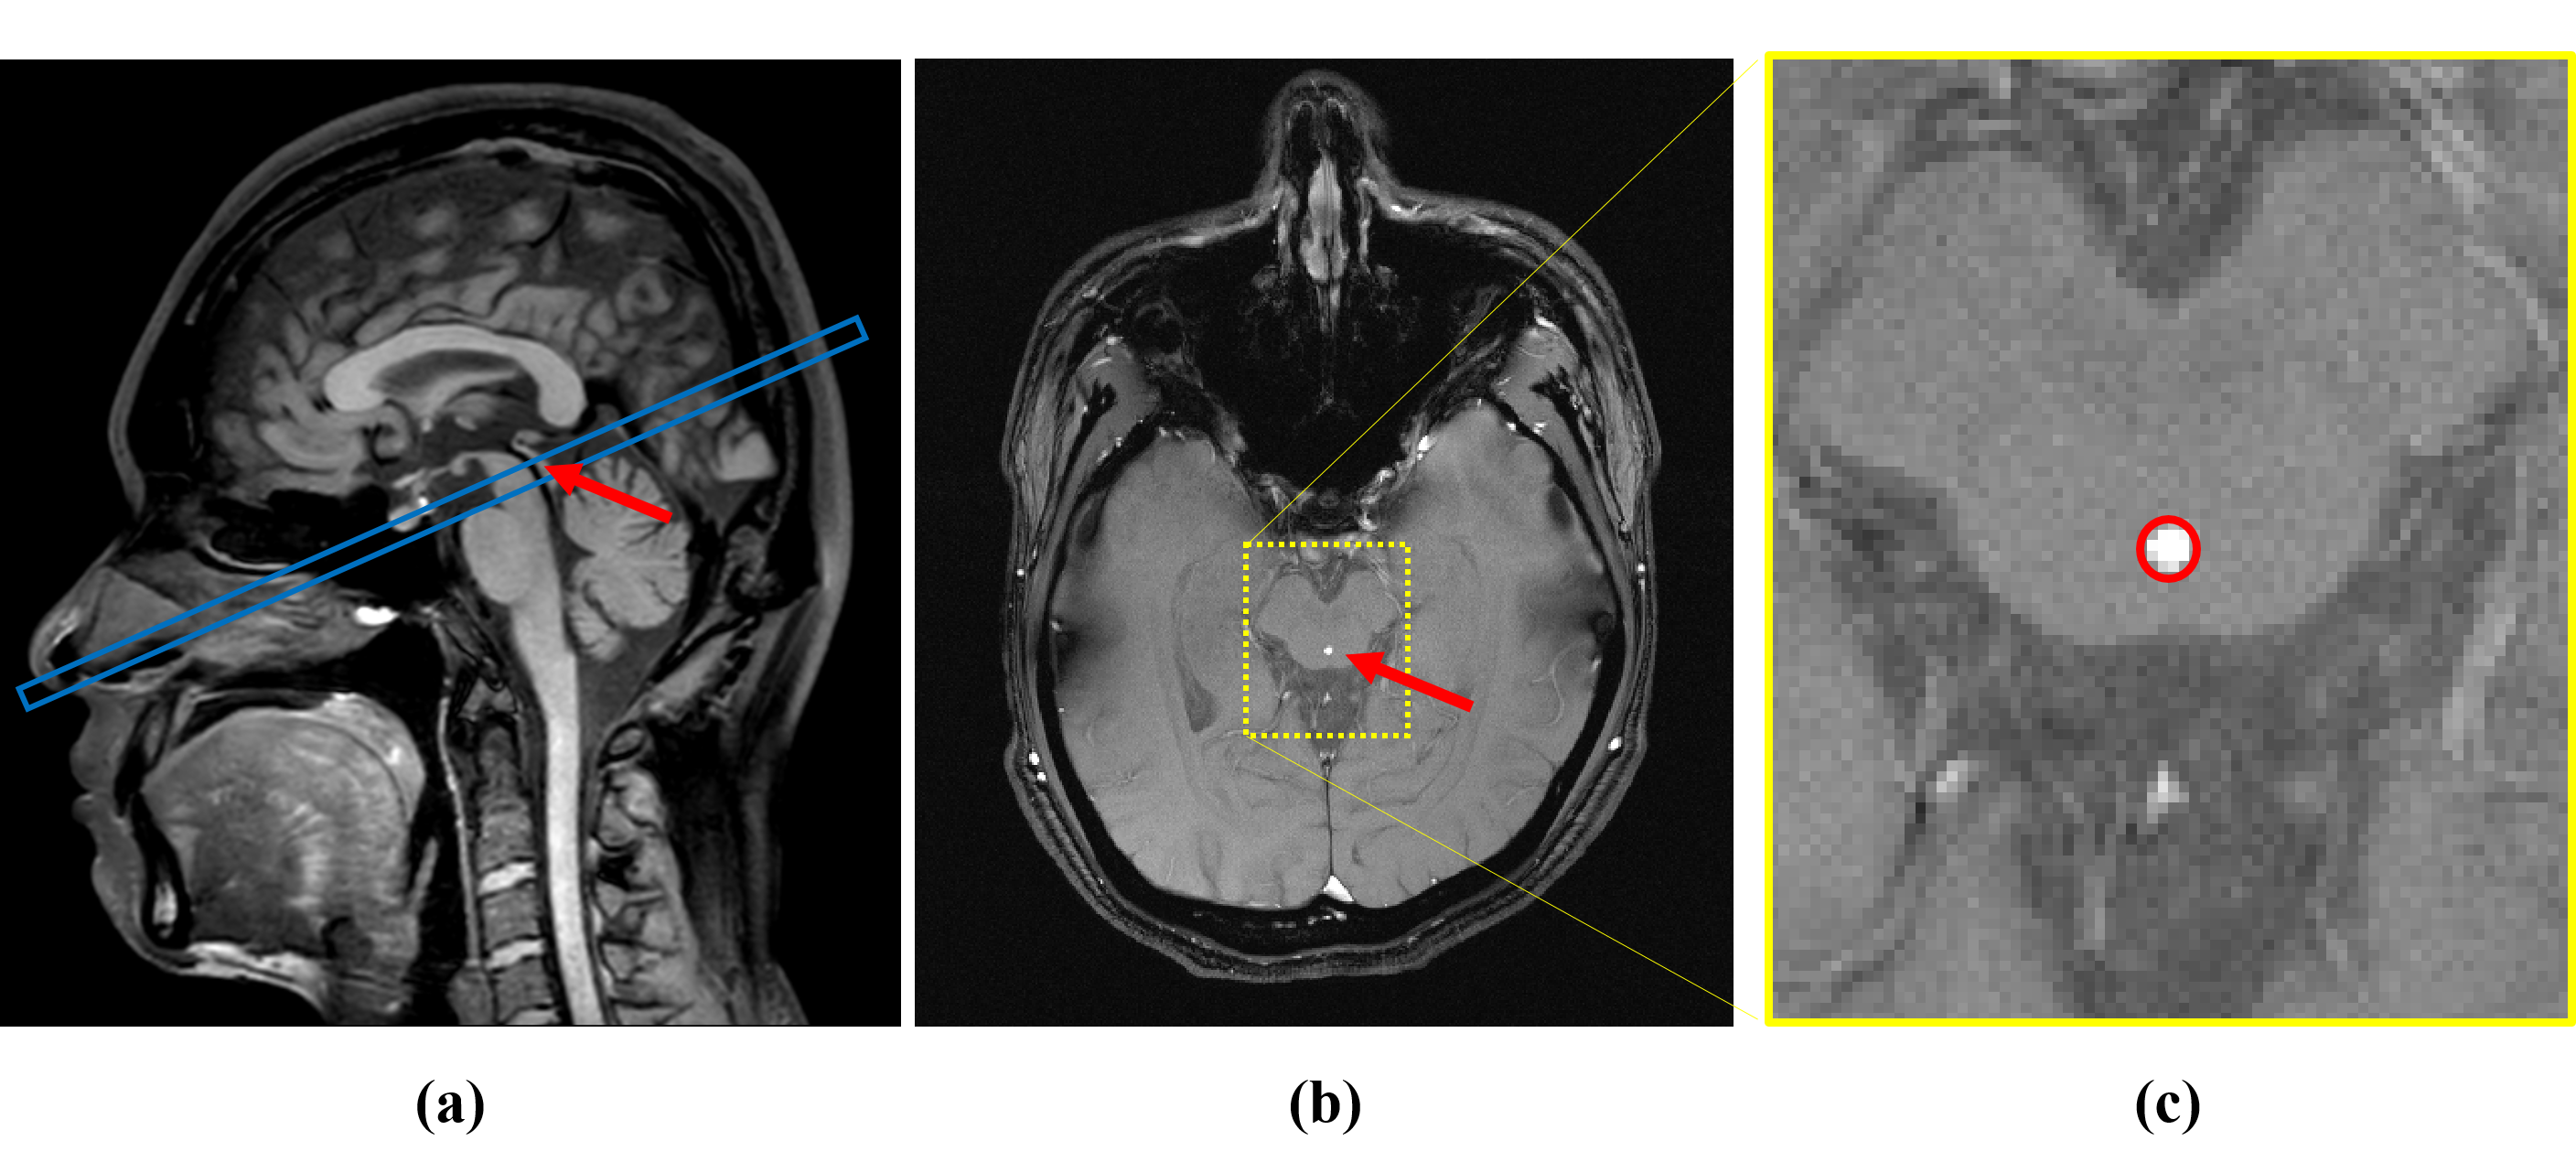
All the imaging experiments were performed on a 3.0 T whole body MR scanner (Ingenia, Philips Healthcare, Best, the Netherlands). Six healthy volunteers (3 males, age: 23-33 years old) were recruited to evaluate the performance of the proposed real-time flow imaging method. For comparison, we performed both the conventional cine PC-MRI with retrospective PPU-synchronization and our implemented real-time flow imaging method without any additional gating or control. The imaging plane was placed perpendicular to the cerebral aqueduct based on a whole-brain 3D T1-weighted image, as shown in Fig. 2(a). For both cine and real-time flow MRI experiments, the following imaging parameters were used: field of view = 240 mm × 160 mm, matrix size = 480 × 320, spatial resolution = 0.50 mm × 0.50 mm, slice thickness = 5 mm, repetition time/echo time = 13/8.7 ms, flip angle = 15°, and encoding velocity = 12~15 cm/s. For the real-time flow imaging, the reconstructed temporal resolution is 52 ms, while for the cine imaging, the temporal resolution is around 60 ms. For analysis of CSF flow, the region of interest (ROI) was manually drawn on the cross-section magnitude image to incorporate the cerebral aqueduct, as illustrated in Fig. 2(b-c).
Results
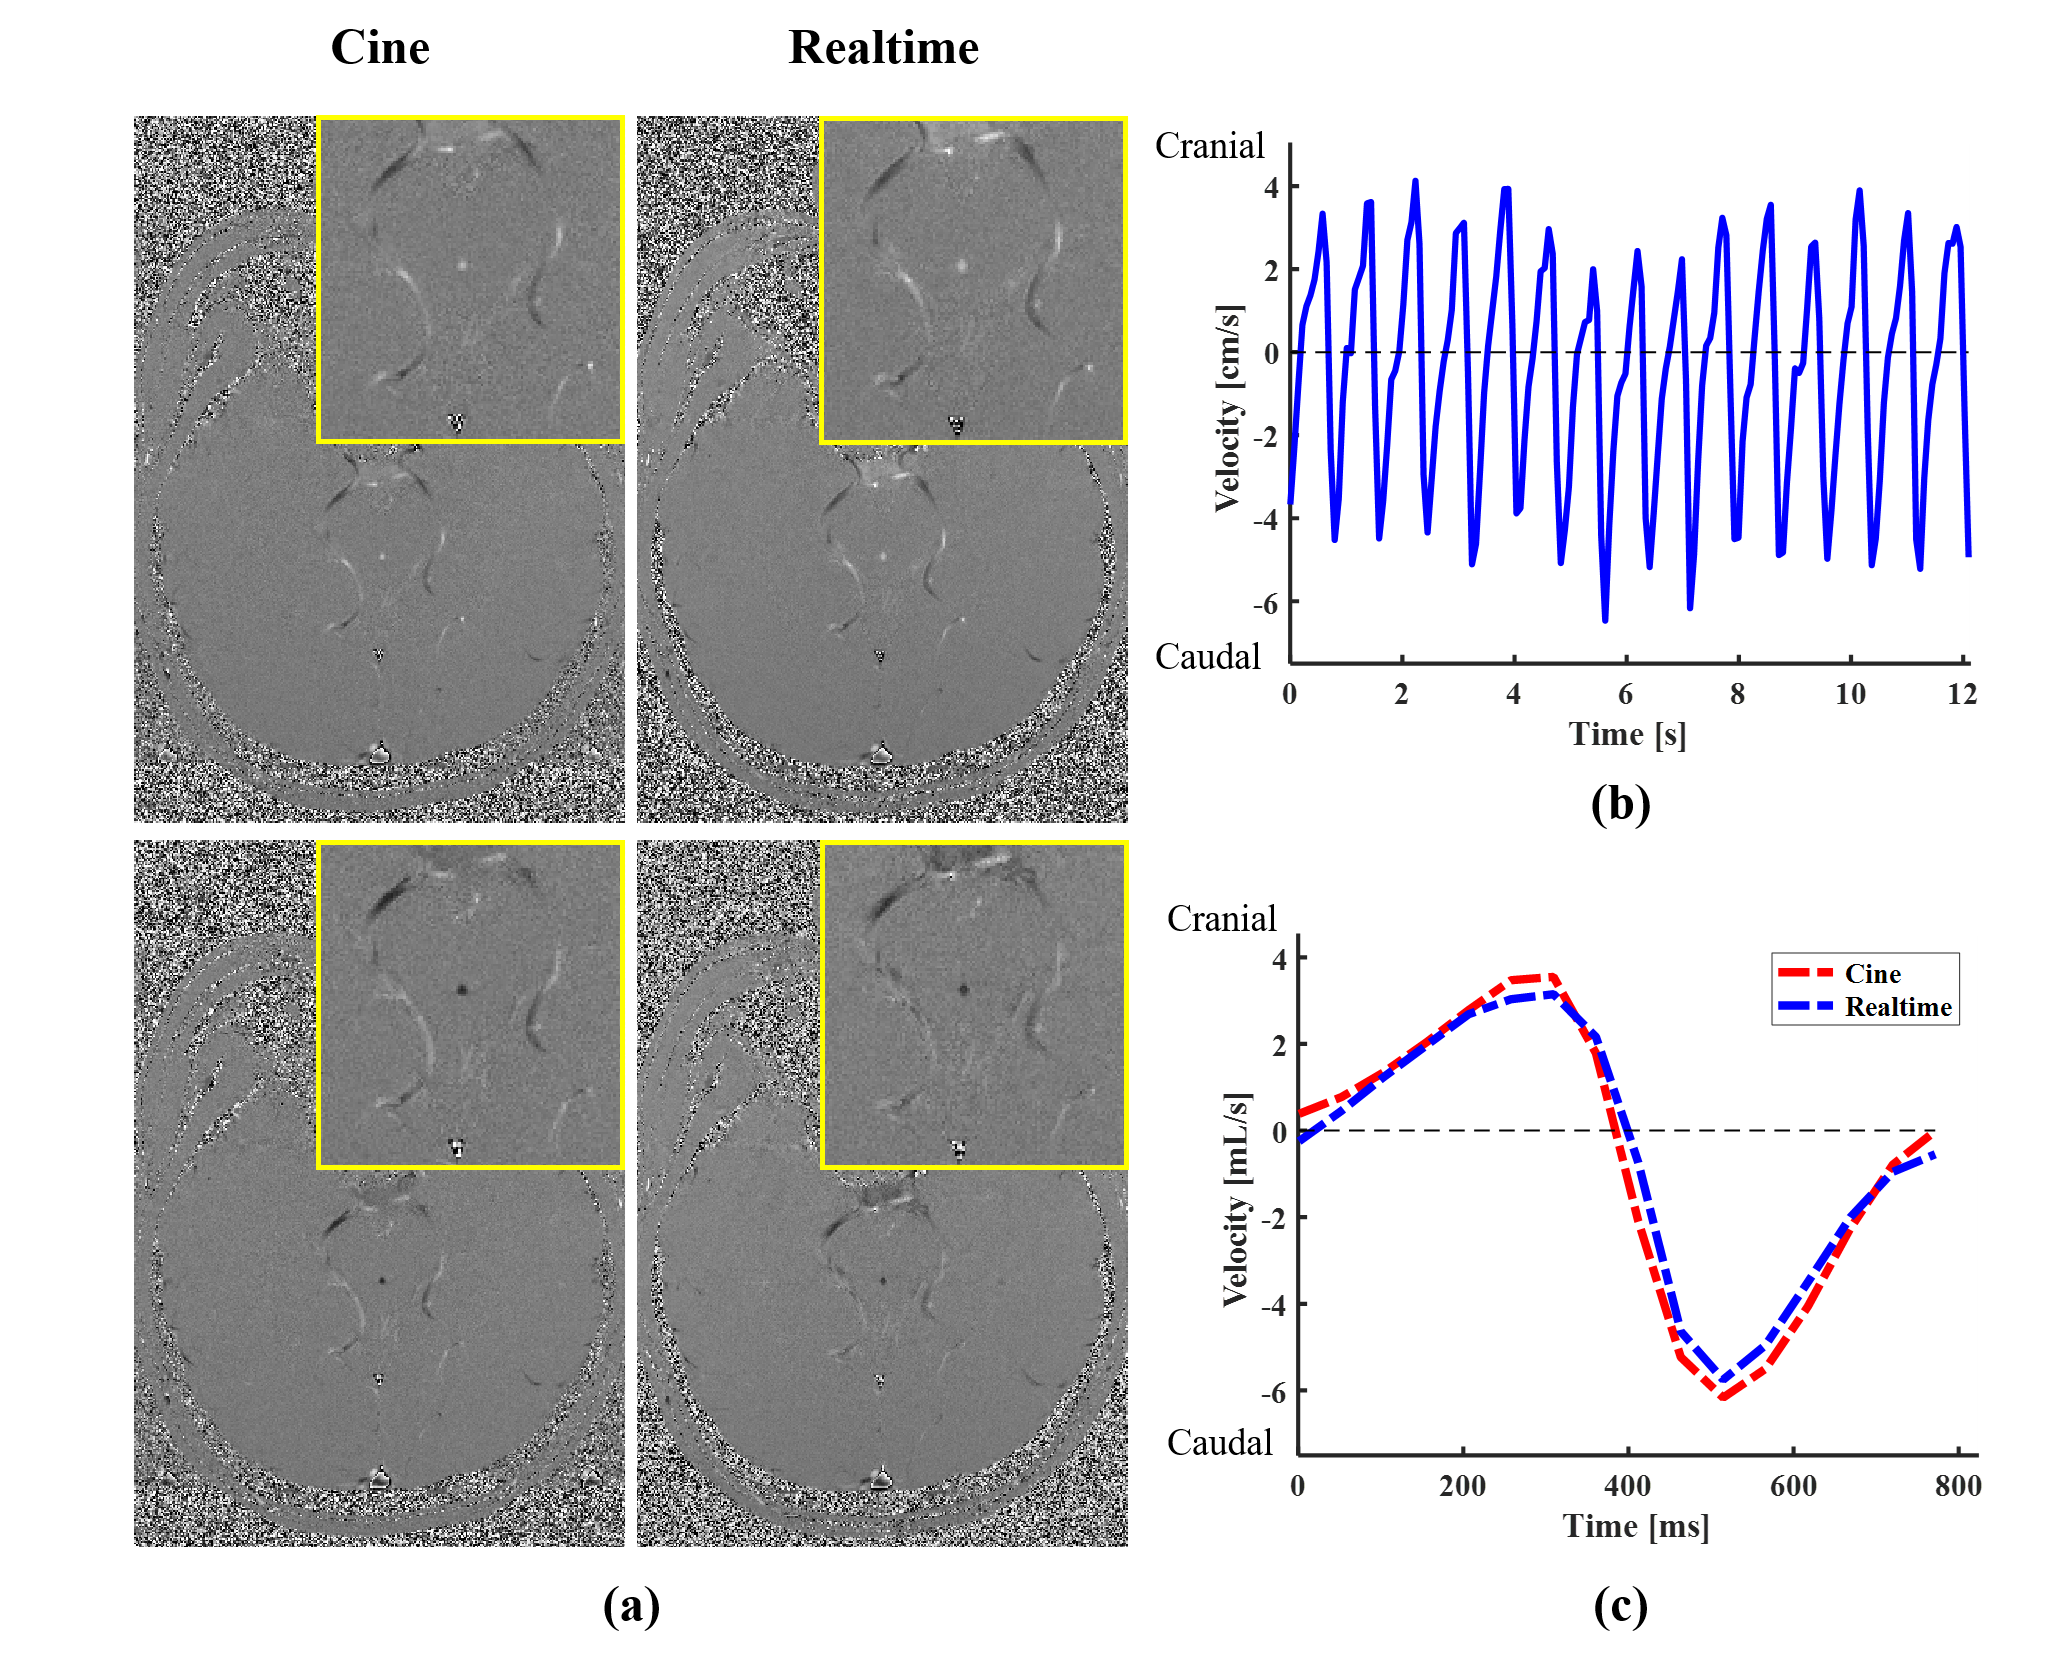
Fig. 3 shows the reconstruction results for a healthy subject. We first compared the velocity maps obtained from the conventional cine imaging method and the proposed real-time flow imaging method, as shown in Fig. 3(a). Here a peak diastolic frame and a peak systolic frame were both included. As can be seen, the velocity maps reconstructed from the real-time flow imaging method provide comparable image quality and velocity-to-noise ratio to those derived from the cine flow imaging method. In addition, we averaged the velocities inside the ROI marked in Fig. 2(c), and plotted the averaged velocity waveform associated with the cerebral aqueduct over 12-second time window for the healthy subject in Fig. 3(b). It can be seen that the real-time flow imaging method is able to resolve beat-by-beat flow velocity variations. Moreover, we averaged the velocity waveform over multiple cardiac cycles into one synthetic cardiac cycle, and then compared it with the one acquired from the conventional cine method. As is shown in Fig. 3(c), the averaged velocity waveform derived from the real-time flow imaging method closely matches that from the cine imaging method. Additionally, we further performed a Bland-Altman analysis of peak systolic velocity, peak diastolic velocity, and net flow from the conventional cine flow imaging method versus those from the real-time flow imaging method for all the six healthy subjects. Fig. 4 shows that the flow quantities from the two flow imaging methods are in good agreement.Discussion and Conclusions
In this work, we have developed and validated a high-resolution real-time PC flow imaging method for evaluating CSF in cerebral aqueduct at 3T. The proposed method well captures the beat-by-beat CSF flow variations, and has excellent correlation with conventional cine PC-MRI. We expect that it will prove useful for studying various CSF-related neurological disorders.Acknowledgements
This work was financially supported by China Postdoctoral Science Foundation (2022M710795).References
[1] Tarasoff-Conway JM, Carare RO, Osorio RS, Glodzik L, Butler T, Fieremans E, Axel L, Rusinek H, Nicholson C, Zlokovic BV, Frangione B, Blennow K, Ménard J, Zetterberg H, Wisniewski T, de Leon MJ. Clearance systems in the brain-implications for Alzheimer disease. Nat Rev Neurol 2015;11(8):457-70.
[2] Simon MJ, Iliff JJ. Regulation of cerebrospinal fluid (CSF) flow in neurodegenerative, neurovascular and neuroinflammatory disease. Biochim Biophys Acta 2016;1862(3):442–451.
[3] Yin LK, Zheng JJ, Zhao L, Hao XZ, Zhang XX, Tian JQ, Zheng K, Yang YM. Reversed aqueductal cerebrospinal fluid net flow in idiopathic normal pressure hydrocephalus. Acta Neurol Scand 2017;136(5):434-439.
[4] Haughton VM, Korosec FR, Medow JE, Dolar MT, Iskandar BJ. Peak systolic and diastolic CSF velocity in the foramen magnum in adult patients with Chiari I malformations and in normal control participants. Am J Neuroradiol 2003;24(2):169–76.
[5] Sakhare AR, Barisano G, Pa J. Assessing test-retest reliability of phase contrast MRI for measuring cerebrospinal fluid and cerebral blood flow dynamics. Magn Reson Med 2019;82(2):658-670.
[6] Joseph AA, Kowallick JT, Merboldt KD, Voit D, Schaetz S, Zhang S, Sohns JM, Lotz J, Frahm J. Real-time flow MRI of the aorta at a resolution of 40 msec. J Magn Reson Imaging 2014;40(1):206-213.
[7] Sun A, Zhao B, Li Y, He Q, Li R, Yuan C. Real-time phase-contrast flow cardiovascular magnetic resonance with low-rank modeling and parallel imaging. J Cardiovasc Magn Reson 2017;19(1):19.
[8] Töger J, Andersen M, Haglund O, Kylkilahti TM, Lundgaard I, Markenroth Bloch K. Real-time imaging of respiratory effects on cerebrospinal fluid flow in small diameter passageways. Magn Reson Med 2022;88(2):770-786.
Figures