1454
TOTAL WHITE MATTER PERIVASCULAR SPACE VOLUME: AN EARLY MARKER FOR DUTCH-TYPE CEREBRAL AMYLOID ANGIOPATHY1Radiology, Leiden University Medical Center, Leiden, Netherlands, 2Leiden University Medical Center, Leiden, Netherlands, 3Neurology, Mass General Research Institute, Boston, MA, United States, 4Neurology, Leiden University Medical Center, Leiden, Netherlands
Synopsis
Keywords: Neurofluids, Neurofluids, Perivascular spaces
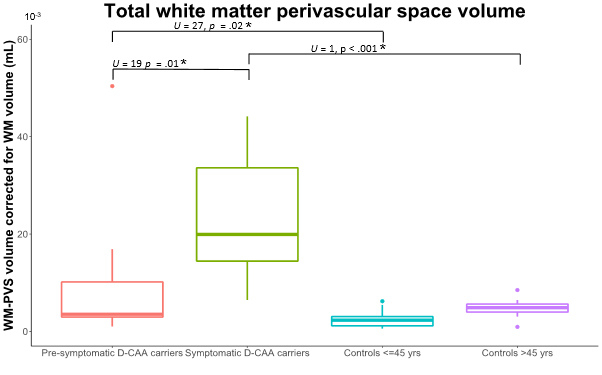
In this study we semi-automatically quantified MRI-visible perivascular space volume in the white matter (WM-PVS) and compared these volumes between (pre-)symptomatic Dutch-type hereditary Cerebral Amyloid Angiopathy (D-CAA) and matched controls. Main findings show that the WM-PVS volume was significantly higher in symptomatic D-CAA (median=19.9mL) compared with both presymptomatic D-CAA (median=3.5mL; U=19, p=.01) and matched controls (median=4.9mL; U=1, p<.001). Presymptomatic D-CAA carriers had a higher WM-PVS volume than the matched controls (median=2.3mL; U=27, p=.02). This indicates that WM-PVS volume, in contrast to the PVS-CSO visual rating scales, may be an early marker for D-CAA.Introduction
Cerebral Amyloid Angiopathy (CAA) is one of the leading etiologies of intracerebral hemorrhages in the elderly1. Dutch-type CAA (D-CAA) is an autosomal dominant hereditary form of CAA that is caused by a genetic mutation on the amyloid precursor protein (APP) gene2. D-CAA can be confirmed through genetic testing, which enables studying the disease in confirmed cases as well as studying the early presymptomatic phase of the disease and raises potential to use D-CAA as a model for sporadic CAA. Visual rating scales and single slice volume quantification of MRI-visible perivascular spaces (PVS) in the centrum semiovale have proven increased presence of PVS in symptomatic D-CAA and sporadic CAA, but not in presymptomatic D-CAA mutation carriers3. So far, severity assessment of PVS in (D-)CAA patients has been limited to visual rating scales based on a single slice at the level of the centrum semiovale, with a ceiling effect at 40 (MRI-visible) PVS4. With the current study we semi-automatically quantified total white matter PVS (WM-PVS) volume and analyzed differences in WM-PVS volume between symptomatic D-CAA patients, presymptomatic D-CAA mutation carriers, and sex- and age-matched controls.Methods
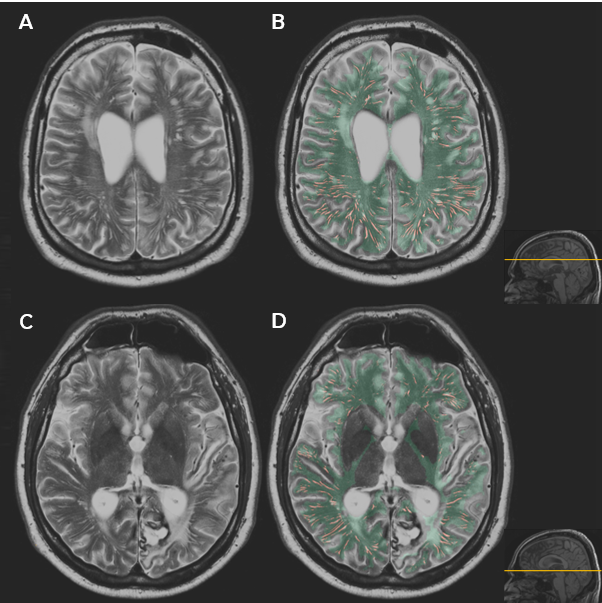
Total WM-PVS volume (mL) was determined using in-house developed software5 based upon the Frangi vesselness filter that is applied on white matter masked multi-slice T2-weighted images (TE/TR 80/4200ms, FA 90°, 40 slices, FOV 224x180x144 mm, slices thickness 3.6 mm, matrix 448x320 voxels, in-plane resolution 0.5x0.56 mm, scan duration ~3 min). For our region of interest (ROI) we excluded non-WM areas from the brain, i.e. cerebellum, brain stem, basal ganglia, and large CSF areas (ventricles, subarachnoid space, large sulci), resulting in a ROI mask covering only the WM of the cerebrum. This ROI was manually adjusted where needed (ARS) and afterwards checked by another assessor (MS) to reduce false positive PVS segmentations. Thresholds for the Frangi vesselness filter were manually determined for each participants, so that the false positive and false negative PVS segmentation was minimized. Thresholds were determined (ARS) and checked by two other assessors (MS and SvR). The relative WM-PVS volume was defined as total WM-PVS volume normalized by the total WM volume in mL per subject. Figure 1 shows an example of the WM ROI throughout the brain and the Frangi vesselness filter segmentation within this ROI. In our analyses we included 12 symptomatic D-CAA mutation carriers (mean 55±5.8yrs, range 45-63yrs, 6/12 were female), 9 presymptomatic D-CAA mutation carriers (mean 34±12.5yrs, range 20-51yrs, 8/9 were female), 12 older controls (mean 57±7.0yrs, range 46-67yrs, 6/12 were female), and 14 young controls (mean 33±7.4yrs, range 20-45yrs, 12/14 were female). Group differences were tested with non-parametric Mann-Whitney U-tests.Results
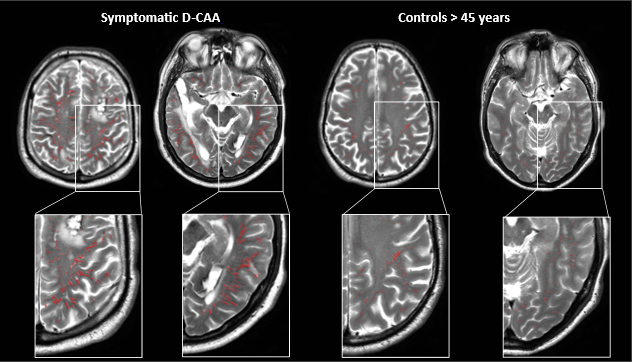
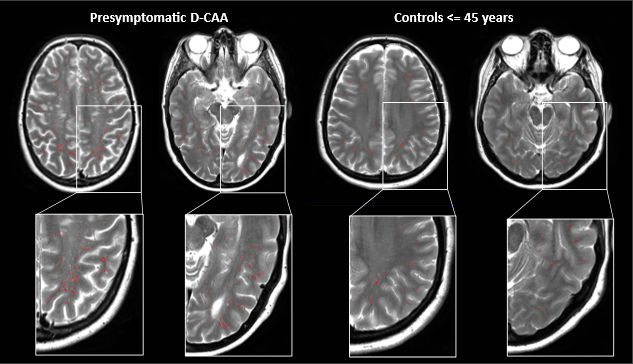
Total relative WM-PVS volume was higher in symptomatic D-CAA patients (median=19.9mL, range=6.5-44.2mL) compared to matched controls (median=4.9mL, range=1.0-8.5; U=1, p<.001) and presymptomatic D-CAA mutation carriers (median=3.5mL, range=1.0-50.4; U=19, p=.01). Also in presymptomatic D-CAA mutation carriers, the total relative WM-PVS volume was higher than in matched controls (median=2.3mL, range=0.6-6.2; U=27, p=.02). Figure 2 and 3 show examples of WM-PVS segmentations in symptomatic D-CAA patients, presymptomatic D-CAA mutation carriers, and matched controls. The outcome measure total relative WM-PVS volume per group is depicted in Figure 4.Discussion and conclusion
We demonstrated that relative WM-PVS volume is increased in (pre-)symptomatic D-CAA carriers compared to age-matched controls. One presymptomatic carrier had a very large WM-PVS volume. However, when excluding this subject, the findings remained significant. Since relative WM-PVS volume was already enlarged in presymptomatic subjects compared to matched controls, we conclude that relative WM-PVS volume as measured by our new software may be considered an early marker of D-CAA, that can tell us something about disease progression. Four-year follow up data is available for this study and this may show whether relative PVS-volume could be a viable outcome marker for future treatment trials.Acknowledgements
M.R. Schipper was funded by the TRACK D-CAA consortium consisting of Biogen, Alnylam, and researchers from Leiden, Boston, and Perth.References
1. Aguilar, M.I. and T.G. Brott, Update in Intracerebral Hemorrhage. The Neurohospitalist, 2011. 1(3): p. 148-159.
2. Bakker, E., et al., DNA diagnosis for hereditary cerebral hemorrhage with amyloidosis (Dutch type). Am J Hum Genet, 1991. 49(3): p. 518-21.
3. Martinez-Ramirez, S., Rooden, S. van, Charidimou, A., Perivascular Spaces Volume in Sporadic and Hereditary (Dutch-type) Cerebral Amyloid Angiopathy. Stroke, 2018. 49(8): p. 1913-1919.
4. Wardlaw, J.M., Smith, E.E. Biessels, G.J., Neuroimaging Standards for Research into Small Vessel Disease and its contribution to Ageing and Neurodegeneration. Lancet Neurol, 2013. 12(8): p. 822-838.
5. MeVisLab homepage, 2009. http://www.mevislab.de
Figures