1450
The Effect of Long-term Exercise Training on Metabolic Responses in Obese Zucker Fatty Diabetic Rats using Phosphorous-31 MRS
Kihwan Kim1, Yuran Zhu1, Raodatullah Abodunrin1, Sonia Kumar 1, Jessica Meng1, Luchen Yu1, Allison McKenzie 1, and Xin Yu1,2
1Biomedical Engineering, Case Western Reserve University, Cleveland, OH, United States, 2Case Center for Imaging Research, Case Western Reserve University, Cleveland, OH, United States
1Biomedical Engineering, Case Western Reserve University, Cleveland, OH, United States, 2Case Center for Imaging Research, Case Western Reserve University, Cleveland, OH, United States
Synopsis
Keywords: Muscle, Diabetes
In this study, metabolic responses to 10-week treadmill exercise on obese Zucker rats were examined using 31P magnetic resonance spectroscopy. Exercise resulted in improvement in glucose tolerance and aerobic capacity (VO2max) while retaining mitochondrial oxidative capacity (MOC) and creatine kinase (CK) activity. Sedentary rats, however, showed poor glucose tolerance and reduced VO2max, which were also marked by significant changes in their MOC and CK activity.Introduction
Exercise has the benefit of improving insulin sensitivity in type 2 diabetes (T2D), as it contributes to mitochondrial biogenesis and improvement in mitochondrial function in skeletal muscle.1,2 Nevertheless, there are reports of T2D patients who have not reaped the benefit of exercise, and the mechanism and predictors behind training responses are still poorly understood.3 31P-Magnetic resonance spectroscopy (31P-MRS) provides a noninvasive method to evaluate high-energy phosphate metabolism in response to exercise training. In this study, we evaluated the effect of exercise on metabolic responses in obese Zucker rat, a rat model of obesity and insulin resistance, before and after 10-week exercise training. Glucose tolerance and aerobic capacity (VO2max) were evaluated to assess changes in whole-body metabolic responses, while 31P-MRS methods were employed to evaluate changes in metabolic responses such as mitochondrial oxidative capacity (MOC) and creatine kinase (CK) activity. Our results revealed that obese rats responded positively to exercise, leading to improved glucose tolerance and VO2max.Method
Experimental protocol: Six- to seven-week old obese Zucker rats were randomly assigned to sedentary or exercise groups (n=9 per group). Rats in the exercise groups were engaged in a 10-week treadmill running program. Pre- and post-training characterizations were performed on all rats, including oral glucose tolerance test (OGTT), measurement of maximal oxygen consumption rate (VO2max), and MRI/MRS evaluation of muscle energetics and fat-water content.MRI/MRS methods: MRI/MRS studies were performed on a 9.4T preclinical scanner. The rats were anesthetized with ~2% isoflurane and placed in a lateral position. One of the hindlimbs was secured in a 31P volume coil. Two needle electrodes were inserted subcutaneously to stimulate the sciatic nerve. An electrical stimulation was applied for 5 min to induce high-intensity muscle contraction. Fat and water content were measured using iterative decomposition of water and fat with echo asymmetry and least-squares estimation (IDEAL) with three asymmetric echo delays (π/6, 5π/6, and 3π/2 radian shift).4 A total of eight slices covering the entire hindlimb were acquired with an in-plane resolution of 0.25 x 0.25 mm2 and a slice thickness of 2 mm.
Dynamic 31P-MRS data were acquired during stimulation-induced muscle contractions. PCr recovery rate, an index of mitochondrial oxidative capacity, was quantified by fitting the PCr recovery curve after the stimulation to a monoexponential model.
CK rate constant (kfCK) was measured by 31P magnetic resonance spectroscopic fingerprinting (31P-MRSF) method described previously.5,6 A total of 30 fingerprints were acquired in 10 min. The fingerprints were averaged and kfCK by matching the averaged fingerprint to a dictionary of simulated fingerprints.
Result
Glucose tolerance in sedentary and exercise rats were compared before and after the training by quantifying the area under the glucose clearance curve (AUC) (Figure 1A). Compared to the baseline, rats in the sedentary group developed significantly impaired glucose clearance after 10 weeks (p < 0.05), suggesting the development of insulin resistance. In contrast, rats in the exercise group did not show decreased capacity in glucose clearance. Sedentary rats also showed a decrease in VO2max (p < 0.05) while those in the exercise group showed preserved VO2max (Figure 1B).Figure 2 shows the results of muscle and fat quantification from IDEAL MRI. Rats in the exercise group exhibited a significant increase in muscle volume while sedentary rats showed a trend of increased muscle volume that did not reach statistical significance (Figure 2 B). Exercise rats displayed a trend in the increase in subcutaneous fat volume but did not reach statistical significance, while sedentary rats exhibited no difference (Figure 2 C). Both sedentary and exercise rats showed a trend of increased fat fraction after 10 weeks but did not reach statistical significance. Further, there was no significant difference in fat fraction between sedentary and exercise rats (Figure 2 D).
Figure 3 shows muscle energetics quantified by 31P-MRS and 31P-MRSF. Sedentary rats displayed ~25% reduction in PCr recovery rate compared to the baseline (0.73 ± 0.15 to 0.55 ± 0.14 min-1, p < 0.05). However, rats in the exercise group only showed a slight reduction (~ 11%) in PCr recovery rate that did not reach statistical significance (0.76 ± 0.22 to 0.67 ± 0.13 min-1, p = 0.4). Finally, sedentary rats also showed a 14% increase in CK rate constant after 10 weeks (0.44 ± 0.05 to 0.50 ± 0.04 s-1, p < 0.05), while the CK rate constant in the exercise group remained unaltered after 10-week training.
Discussion and conclusion
In this study, we investigated the effect of exercise training on energy metabolism and glucose tolerances of obese Zucker rats. Our results show that exercise training can delay the development of metabolic dysfunction, glucose intolerance, as well as the decrease in aerobic capacity.Acknowledgements
This work was supported by a grant from the National Institute of Health (R01 EB23704).References
- Balducci, S. et al. Physical exercise as therapy for type 2 diabetes mellitus: Exercise as Therapy for Type 2 Diabetes. Diabetes Metab. Res. Rev. 30, 13–23 (2014).
- Konopka, A. R. et al. Metformin Blunts Exercise‐Induced Improvements in Skeletal Muscle Mitochondrial Respiration Independent of Changes in Mitochondrial Biogenesis. FASEB J. 32, (2018).
- Stephens, N. A. & Sparks, L. M. Resistance to the Beneficial Effects of Exercise in Type 2 Diabetes: Are Some Individuals Programmed to Fail? J. Clin. Endocrinol. Metab. 100, 43–52 (2015).
- Reeder, S. B. et al. Iterative decomposition of water and fat with echo asymmetry and least-squares estimation (IDEAL): Application with fast spin-echo imaging. Magn. Reson. Med. 54, 636–644 (2005).
- Wang, C. Y. et al. 31 P magnetic resonance fingerprinting for rapid quantification of creatine kinase reaction rate in vivo. NMR Biomed. 30, e3786 (2017).
- Kim, K. et al. Quantification of Creatine Kinase Reaction Rate in Mouse Hindlimb Using Phosphorous-31 Spectroscopic Magnetic Resonance Fingerprinting. NMR Biomed. (2020).
Figures
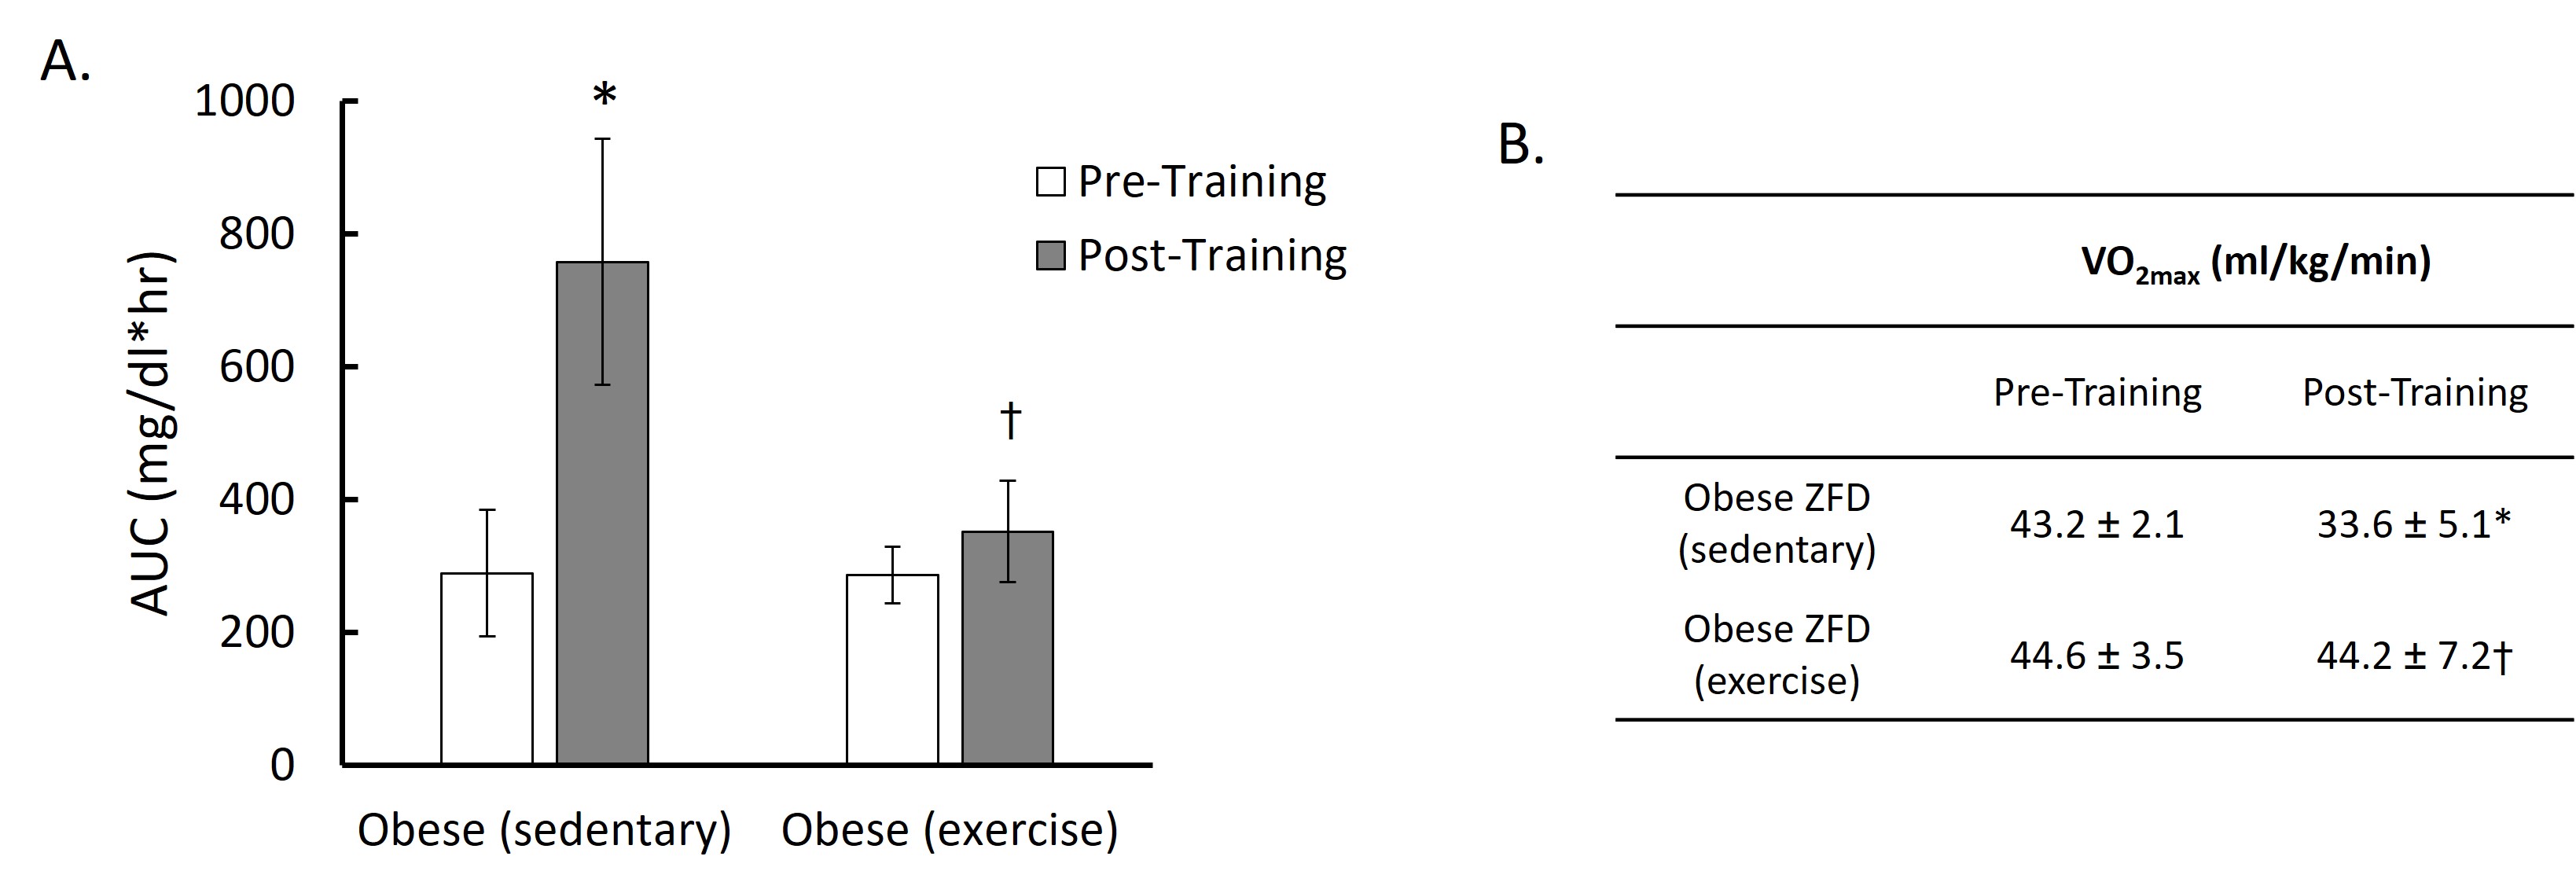
Figure 1. A: Glucose clearance (area under the curve of OGTT plot) of sedentary and exercised obese rats pre- and post- training. B: VO2max of sedentary and exercised obese rats pre- and post-training. (Significant differences: * p < 0.05 vs post-training; † p < 0.05 vs sedentary. Values are mean ± standard deviation).
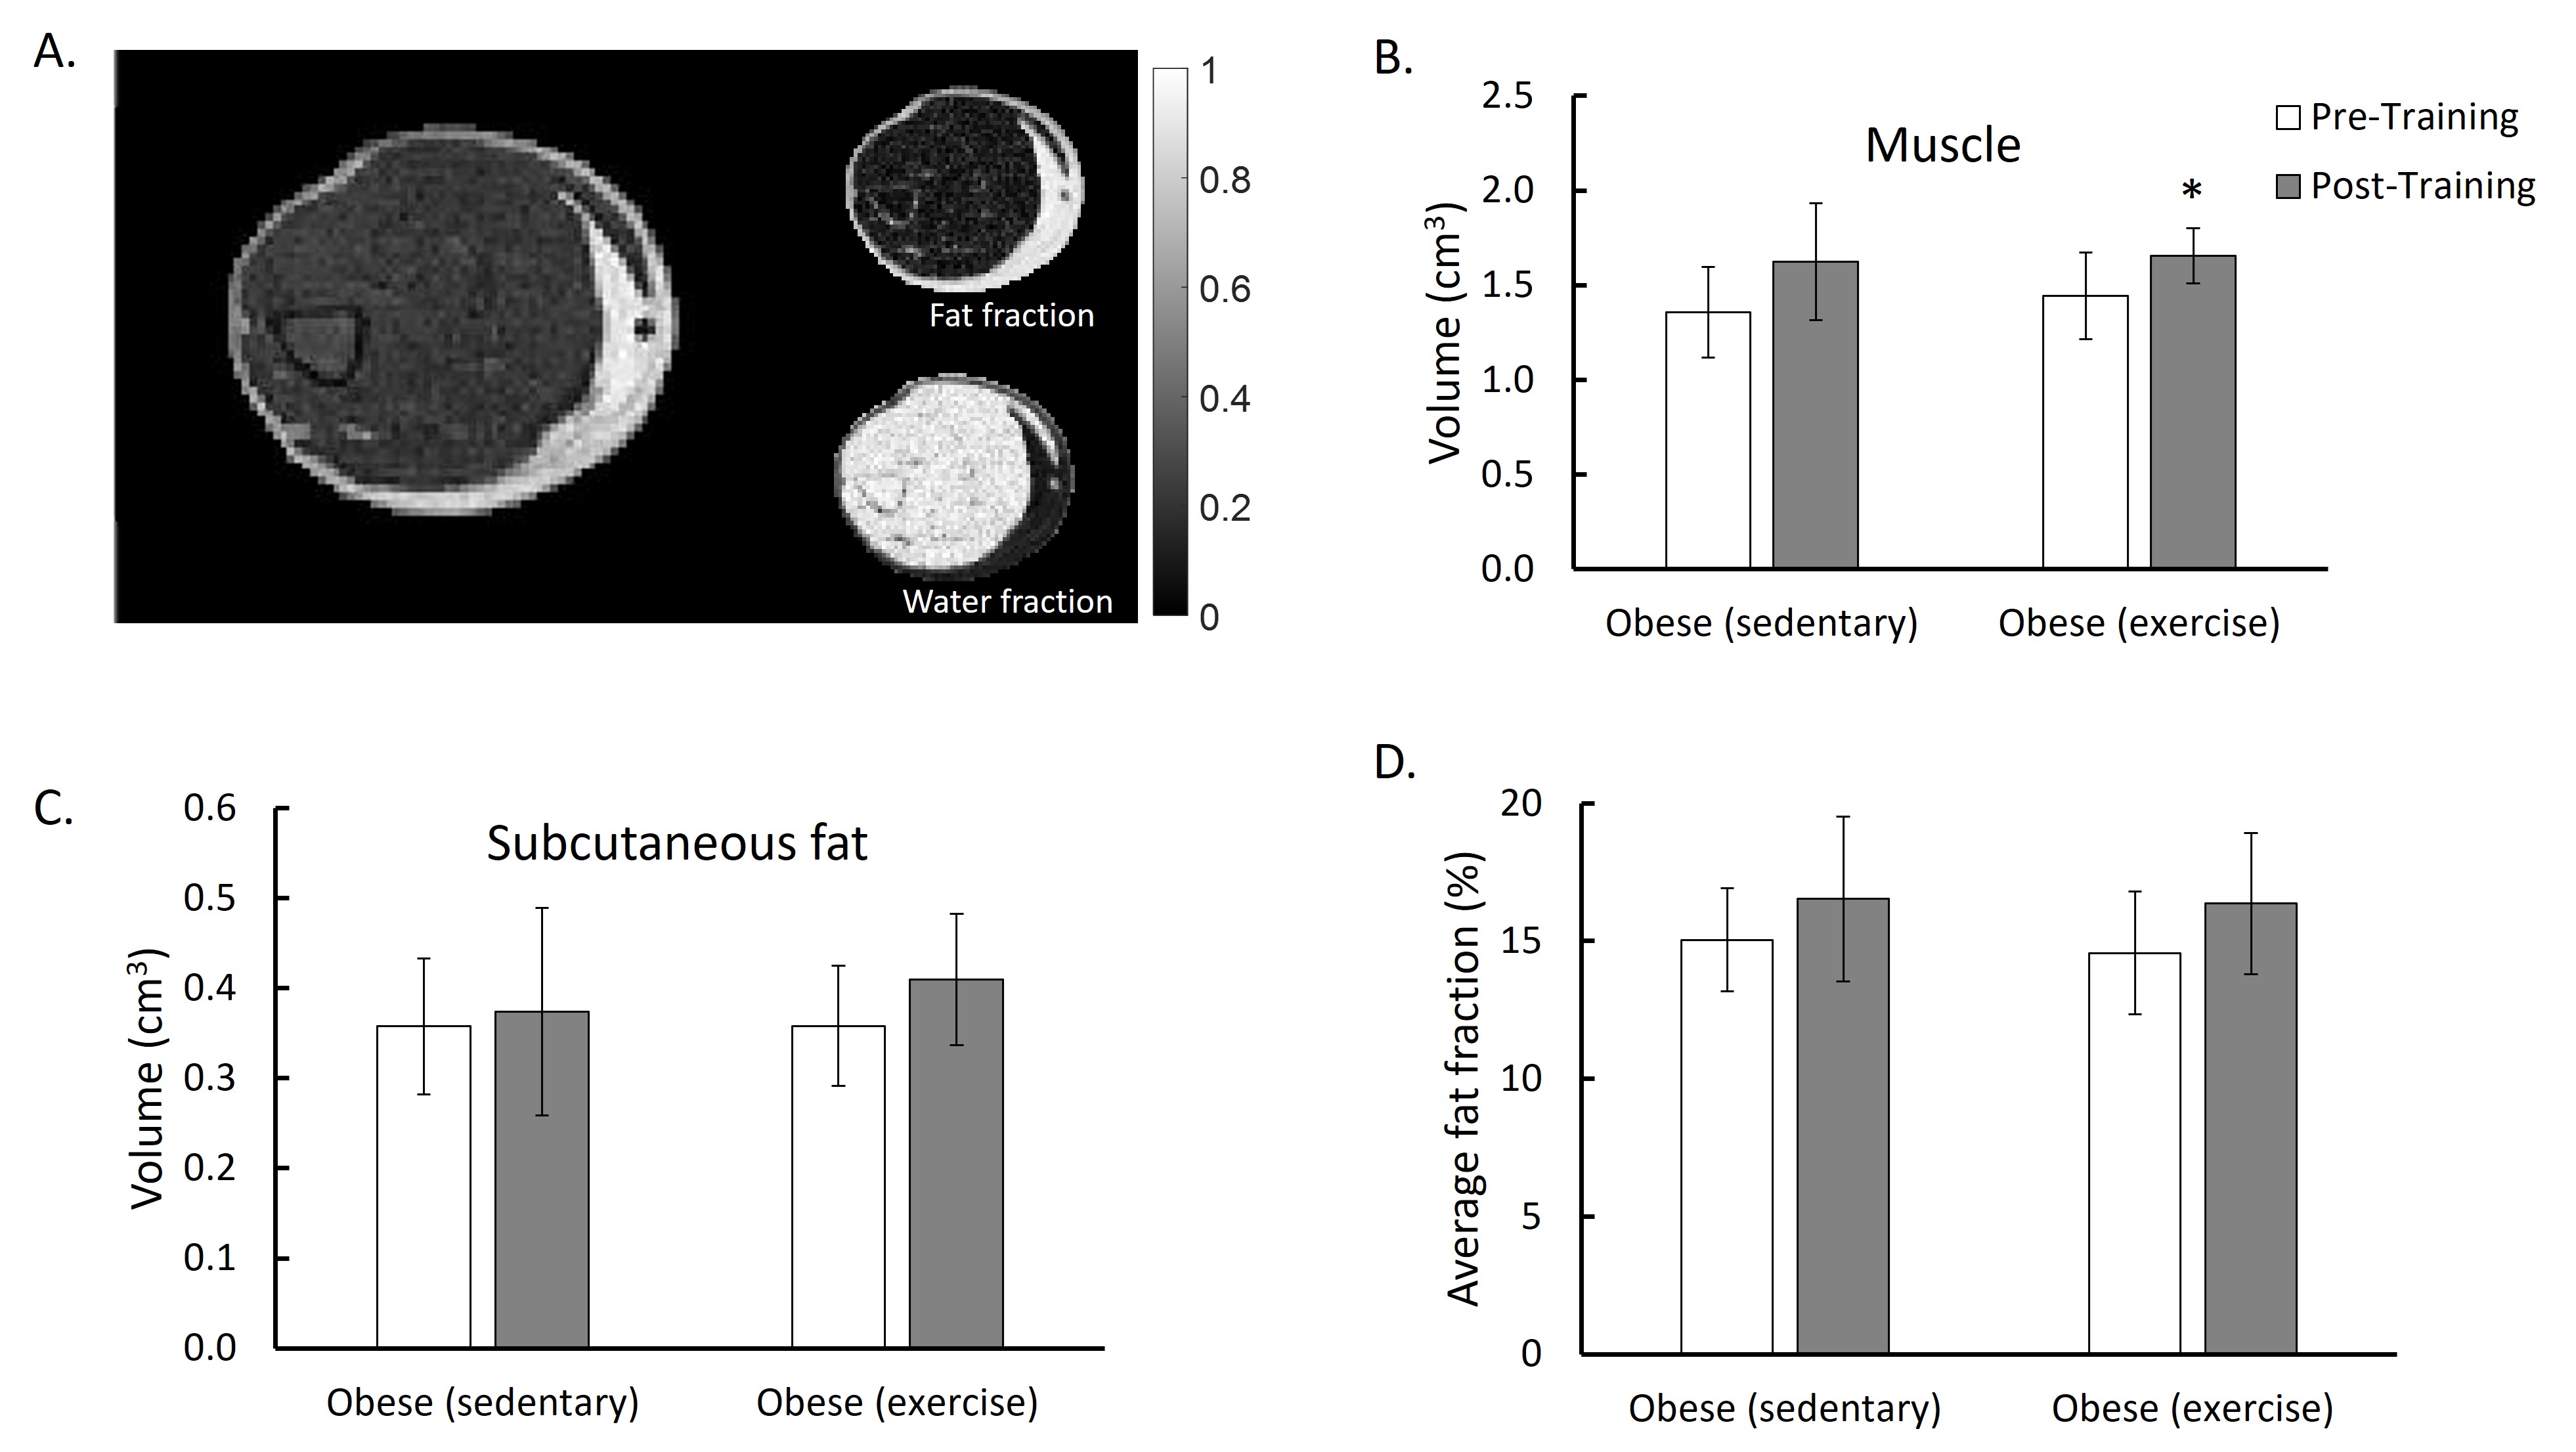
Figure 2. A: Axial image of obese skeletal muscle and the corresponding fat and water fraction images acquired and processed using IDEAL. B & C: muscle and subcutaneous fat volume of sedentary and exercised obese pre- and post-training. D: Average fat fraction values of sedentary and exercised obese (from the muscle component only) pre- and post-training (Significant differences: * p < 0.05 vs post-training. Values are mean ± standard deviation).
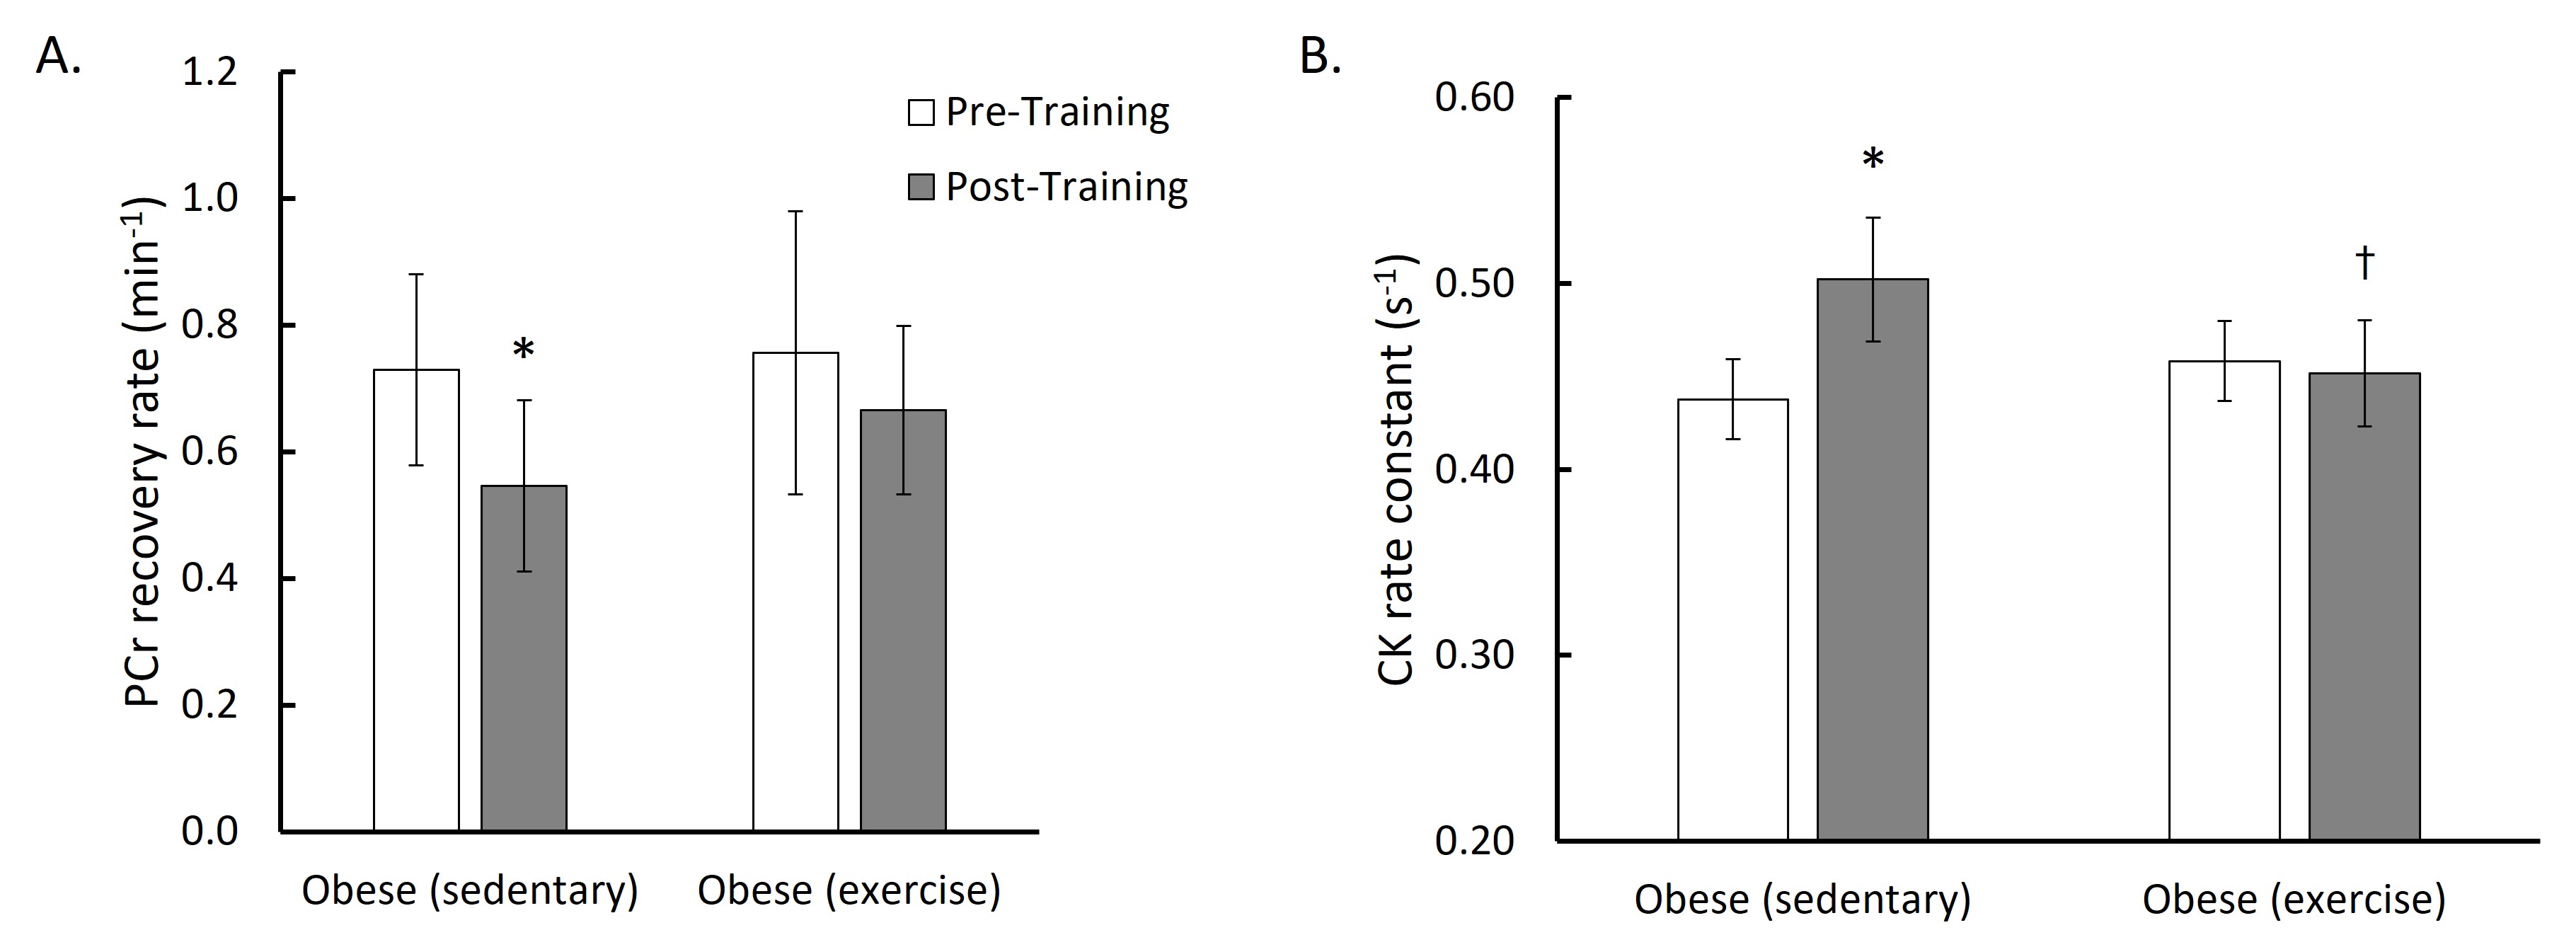
Figure 3. A: PCr recovery rate of sedentary and exercised obese rats pre- and post-training. B: CK rate constant of sedentary and exercised obese rats pre- and post-training. (Significant differences: * p < 0.05 vs post-training; † p < 0.05 vs sedentary. Values are mean ± standard deviation).
DOI: https://doi.org/10.58530/2023/1450