1445
Intelligent automatic slice prescription of scout scans of MSK MRI imaging using surface coil sensitivities1GE HealthCare, Waukesha, WI, United States, 2GE Global Research, Niskayuna, NY, United States, 3GE Healthcare, Bangalore, India
Synopsis
Keywords: MSK, Machine Learning/Artificial Intelligence, Automatic prescription, coil sensitivity map
Large-FOV, low-resolution 3D surface coil sensitivities maps are acquired as part of pre-scan which is typically used to calibrate the hardware of MRI system. In this abstract, we propose to use the coil sensitivity maps to automatically find the region of interest of spine anatomy. This information can be used to position the scout images accurately and automatically and thereby reduce any repeat of the scout scans and increase throughput. Our proposal does not need any additional scan and utilizes the existing information available in the MRI scanner.INTRODUCTION
In off-center imaging anatomies (knee, spine, shoulder etc.), improper scout images are very common, which showed repeated scouts in almost 33-90% of Musculoskeletal (MSK) exams in our internal analysis of data from several clinical sites. MSK exams (shoulder, spine, ankle etc.) are particularly difficult due to inherent variability in positioning and it requires several repeats even for highly skilled technicians to get the correct scout scan for desired region. We build on an earlier technique1 for calibration-based prescription of high-resolution knee images to demonstrate automated scout image planning for MSK exams. We train a deep learning (DL) model using large-FOV (50 cm), low-resolution 3D surface coil sensitivity maps (calibration data), to predict the vertebra column masks to plan spine scout exam.METHODS
Data: Total of 108 coil sensitivity maps from three spine stations (cervical, thoracic, and lumbar) were collected in-house from 48 volunteers with different habitus (IRB approved study). Data was acquired on several 3T GE MRI scanners with different coil combinations (Fig. 1) with at least one high-res image. Sample images are shown in Fig.2 (a), which used following protocol: a. 3plane localizers: Protocol from GE library b. Calibration: 3D EFGRE sagittal, TE/TR=0.5ms/1.4ms, FA=1°, averages=2, 7.5x7.5x15mm3 resolution, matrix:32x32x32. c. High-Res 2D T1w FSE: TE/TR=minTE/600ms, FOV 16X24 for CSpine, 18cmX27cm for T/L Spine, 3.5thk/0.3spacing, 260X190 Matrix, 13 slices for CSpine, 16 slices for T/L Spine; 2DFRFSE T2: TE/TR=140ms/5000ms, FOV16X24 for CSpine, 18cmX27cm for T/L Spine, 3.5thk/0.3spacing, 280X212 Matrix, 13 slices for CSpine, 16 slices for T/L Spine.Ground-truth (GT) generation: High-resolution sagittal T1w/T2w data was used to generate vertebral column mask using an existing inhouse DL framework and were verified by radiologist for accuracy. The vertebral masks from high-res images were processed to obtain smooth concave mask enclosing the vertebra region, which are resampled to in calibration data space to obtain the final GT vertebral column mask for DL training (Fig.2 b). In some cases, spatial coverage differed between calibration and high-resolution data, especially in SI direction. However, since this not a systemic effect across subjects, we hypothesized that DL-training would not be sensitive to few missing regions. DL training: Data was split between train (1248 with augmentation), validation (24 with augmentation), and test-set such that all data from each volunteer were part of same split. DL-architecture: we use 3D U-net architecture2 (3 layers up/down, with input/output size=64x64x64, 16 initial filters, 3x3x3 filter size, 2x2x2 max-pooling, 100 epochs) with DICE as loss and accuracy function. Evaluation: In addition to dice, we used two additional metrics (Fig.5a): (left) Euclidean distance between the center/centroid points of GT and predicted mask, and (Fig5a, right) Shift of the predicted masks from GT in AP/SI directions.RESULTS and DISCUSSION
Fig.3 shows training summary with stable and good validation accuracy of 85.68% DICE. Fig.4 shows examples of model outputs on test-set with different spine stations with good localization of spine anatomy in the body with mean DICE=80.23 (Fig.5c). The DL predictions were stable and accurate across different subject habitus and receiver coil, both of which affects coil sensitivity maps. Mean center and centroid error are less than ~30mm for most (Fig.5c), which are within acceptable limits as it will not change the spine-station being scanned (average vertebrae height is ~8-22mm3,4). AP shift of the predictions are <10mm for most cases, which is acceptable as scout will have much larger FOV (≈400mm). SI shift of the predictions is acceptable for most cases, however some cases had >50mm SI shifts (Fig.5c). We investigated these cases and noticed that both large SI-shift and large center errors are an effect of inadequate GT marking, as these cases have substantially smaller SI coverage in high-resolution image as compared to corresponding calibration images. As our GT-generation only relies on one high-res image, it results into GT-marking to be inaccurately truncated along SI (see Fig.2, Fig.4 for examples). Further, when we examine the DL-prediction on these cases, we notice that it seems to correctly cover the entire spine region in calibration scan (Fig.5b), which further supports our observation that GT-marking was inadequate in these cases.The current approach is limited by small training set of 48 subjects. In future, we will expand data pool to include more subjects, sites and different MSK anatomies. We will also improve our GT-generation strategy to utilize more than one high-res image to obtain entire vertebral column mask and include more prospective evaluation by acquiring scout image with predict mask information. Further, appropriate adjustments may be required in situations where subject moved after calibration data was acquired, as our approach implicitly assumes no subject-motion.CONCLUSION
Our results demonstrate that large FOV, low resolution surface coil sensitive maps can be used to infer the region of interest for spine exam, thereby correctly localizing the station-specific scout images and avoiding need of repeating the scout exams. Our approach does not require any new data to be acquired as surface coil sensitive maps are already acquired in all exams for calibration purposes. Our DL-based framework is generic and the information from the predicted ROI from coil sensitivities can be extended to other automated workflow applications and other off-iso center MSK anatomies.Acknowledgements
No acknowledgement found.References
1. André Maximo et.al. No more localizers: deep learning-based slice prescription directly on calibration scans. In Proceedings of ISMRM 2020.
2. Ronneberger O, Fischer P, Brox T. U-net: Convolutional networks for biomedical image segmentation. In International Conference on Medical image computing and computer-assisted intervention 2015 Oct 5 (pp. 234-241). Springer, Cham.
3. Kunkel, Maria E., et al. "Morphometric analysis of the relationships between intervertebral disc and vertebral body heights: an anatomical and radiographic study of the human thoracic spine." Journal of anatomy 219.3 (2011): 375-387.
4. Gilad, Issachar, and Moshe Nissan. "Sagittal evaluation of elemental geometrical dimensions of human vertebrae." Journal of anatomy 143 (1985): 115.
Figures
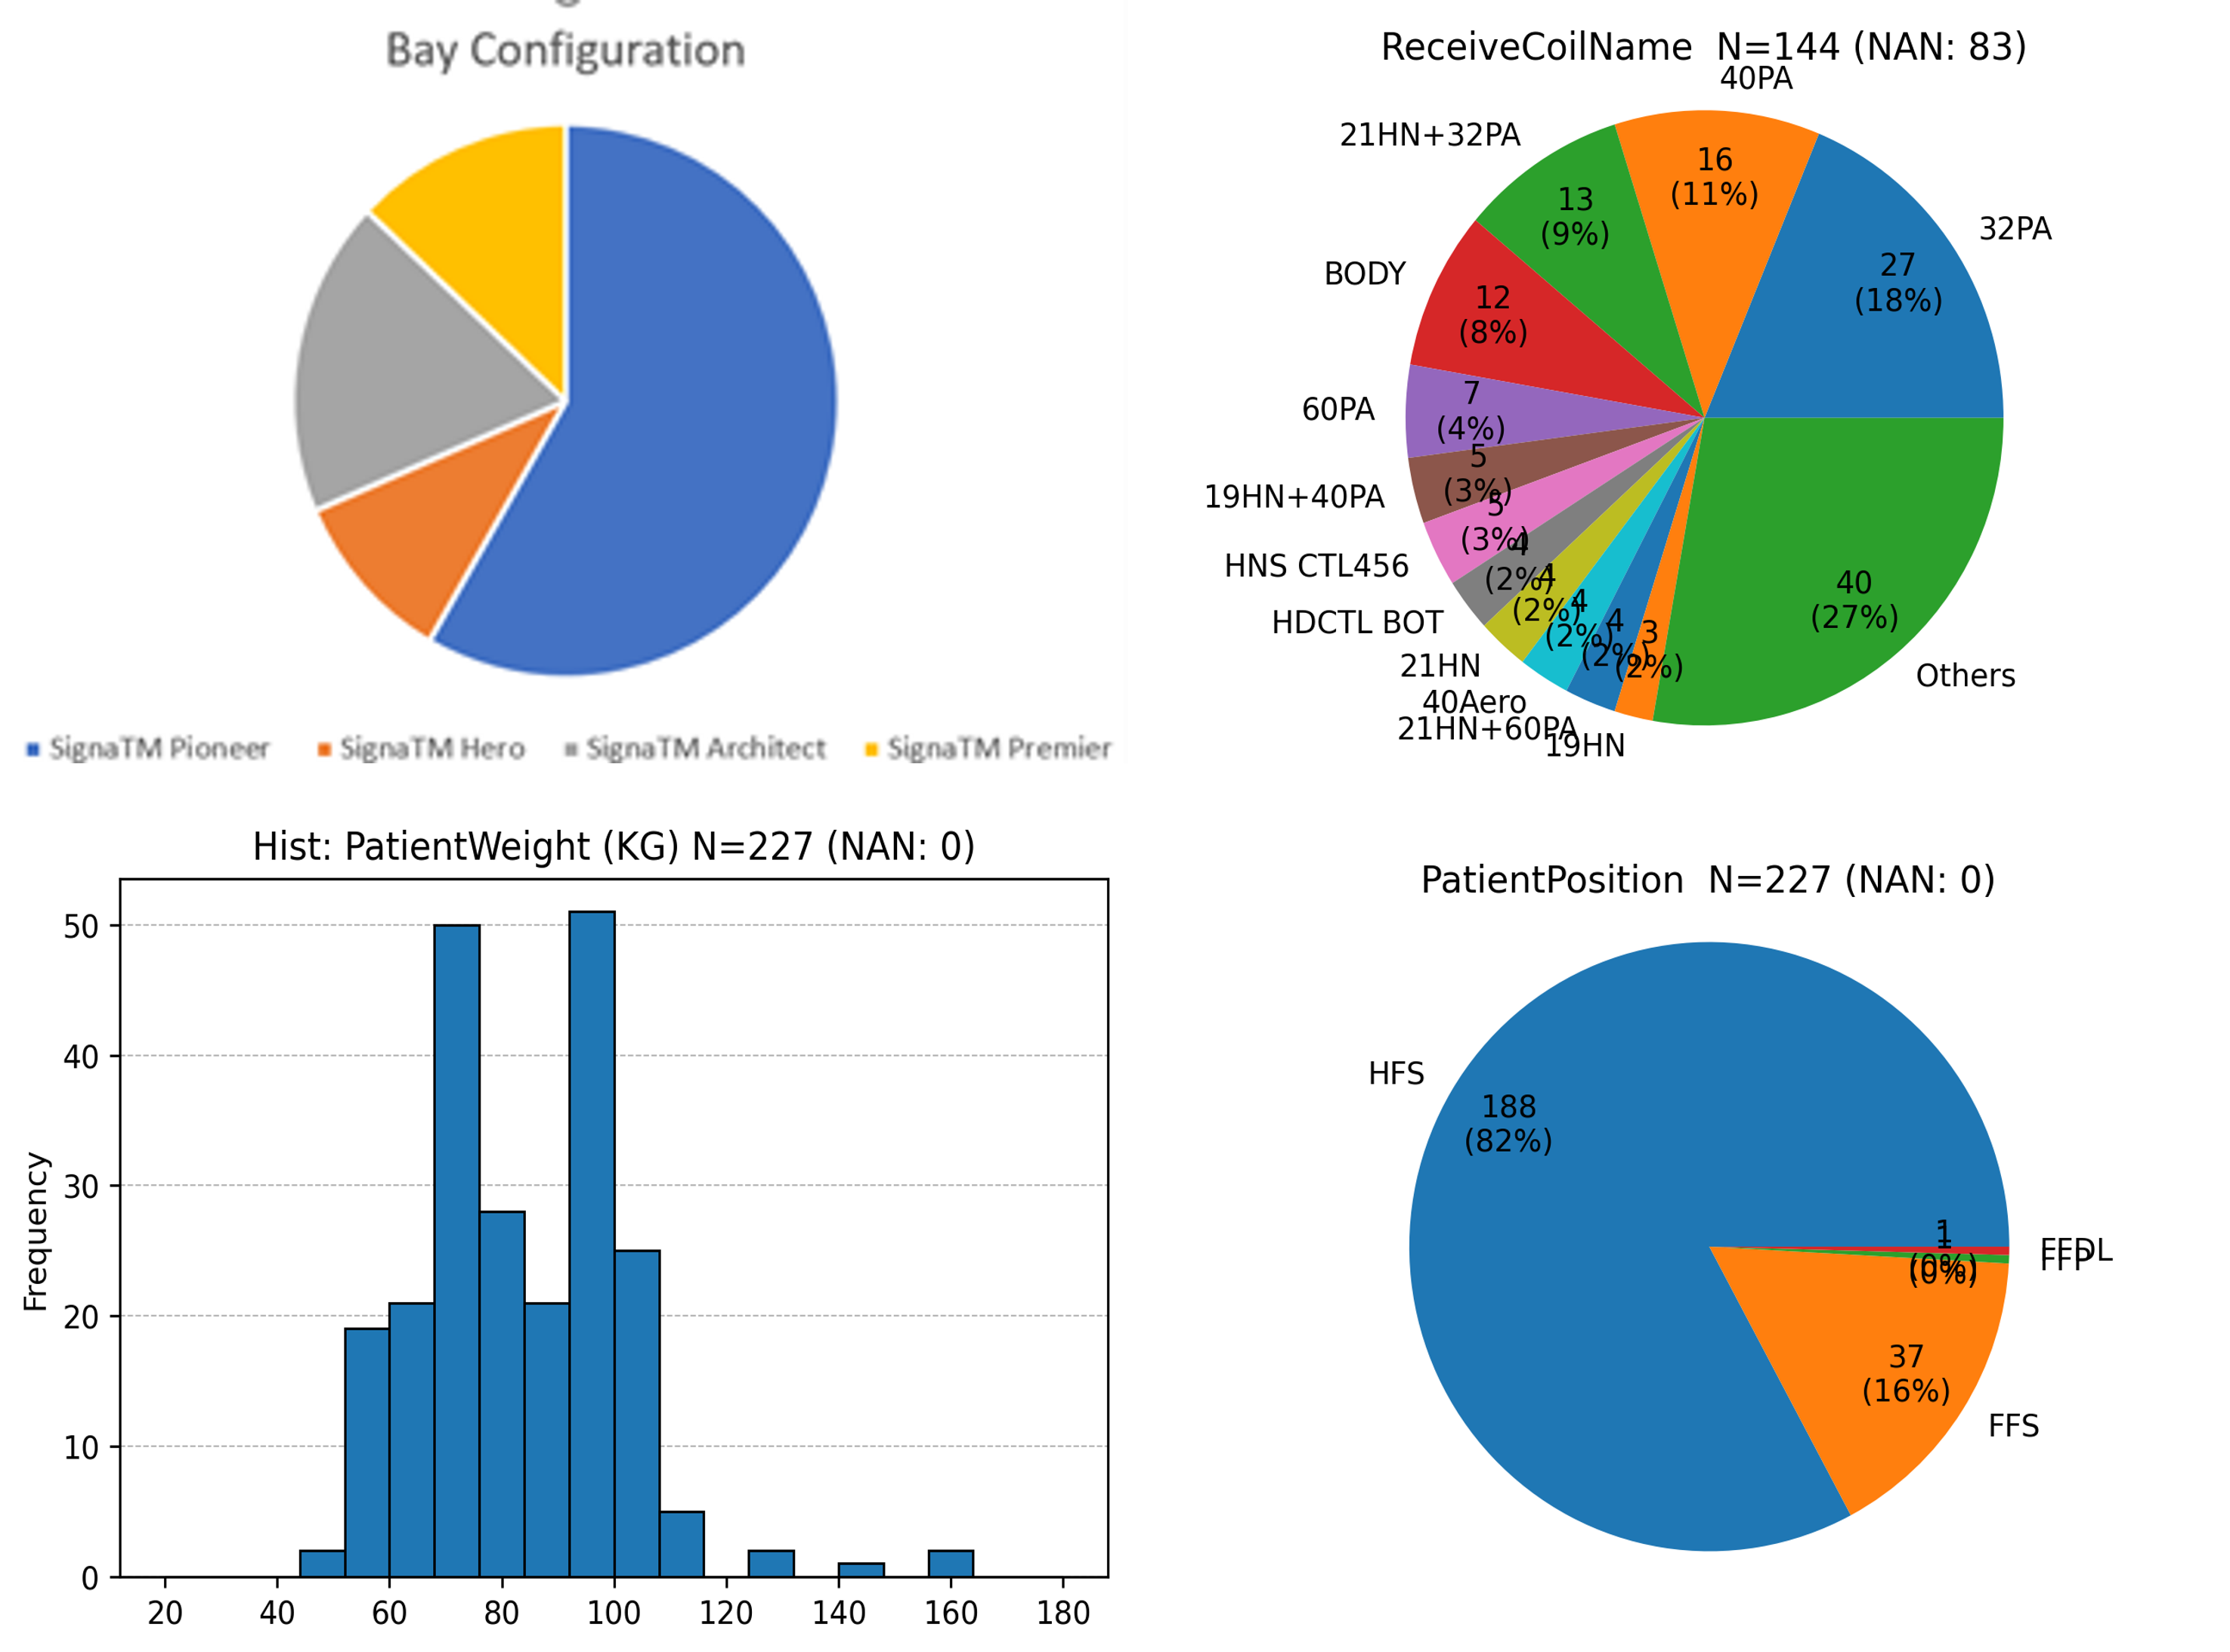
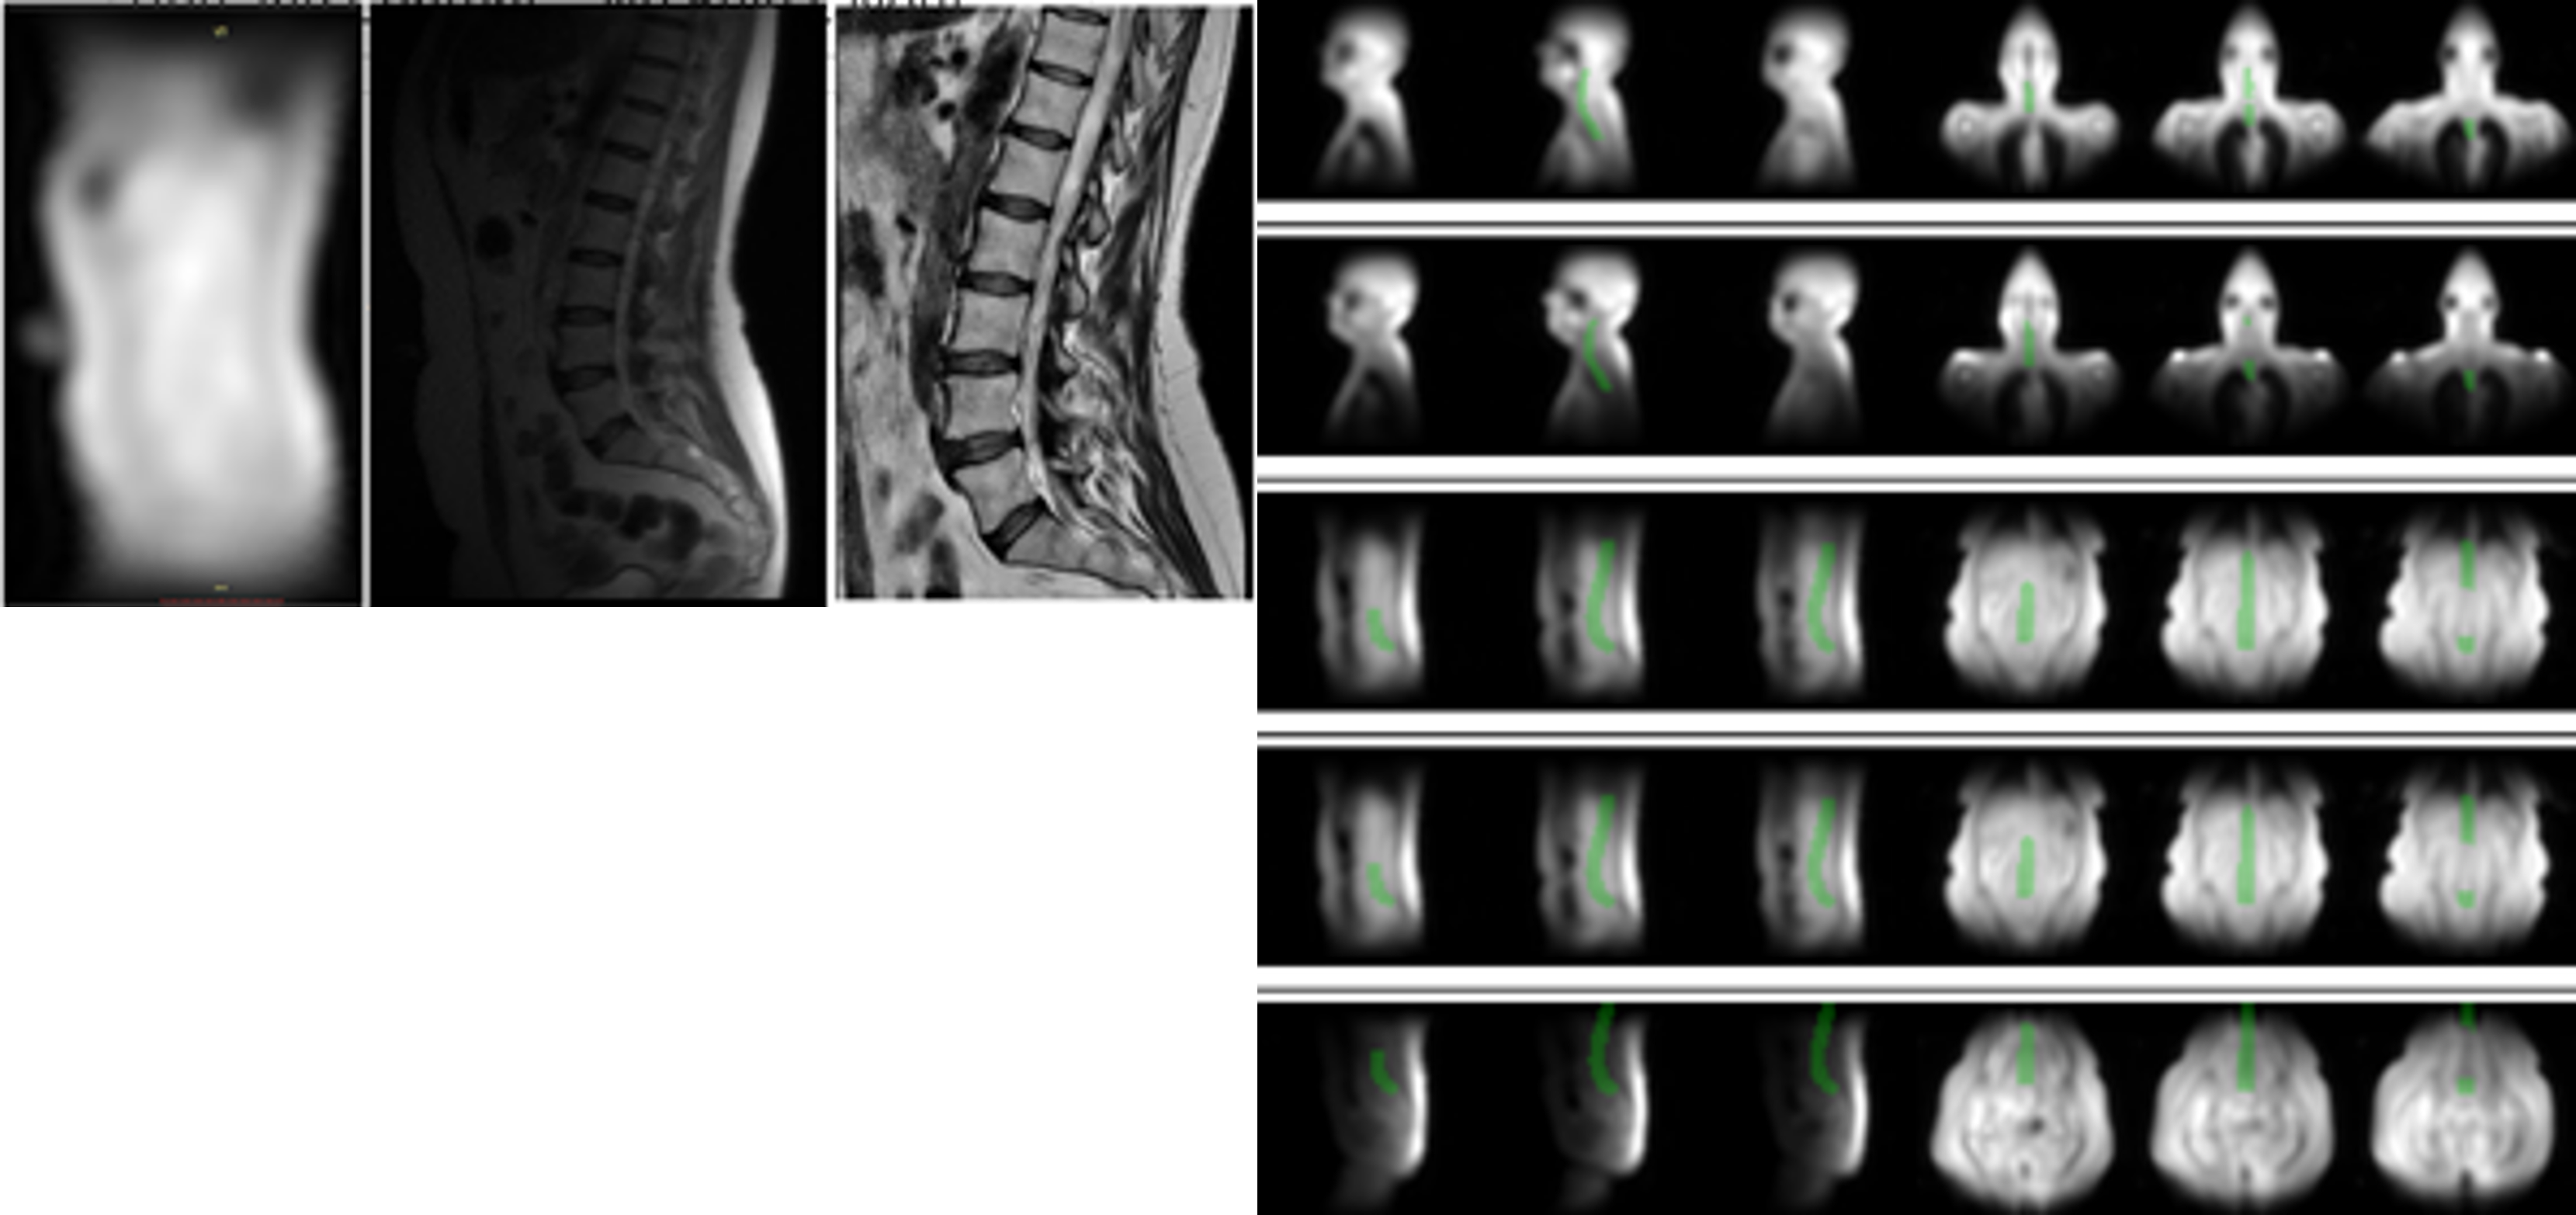
Figure 2(a) shows (left) Coil sensitivities map from calibration scan (middle) Localizer / Scout image (right) High-res Sag T1 FSE for Lumbar Spine
Figure 2(b) shows the generated GT vertebral column mask for the training, overlayed in green on calibration images.
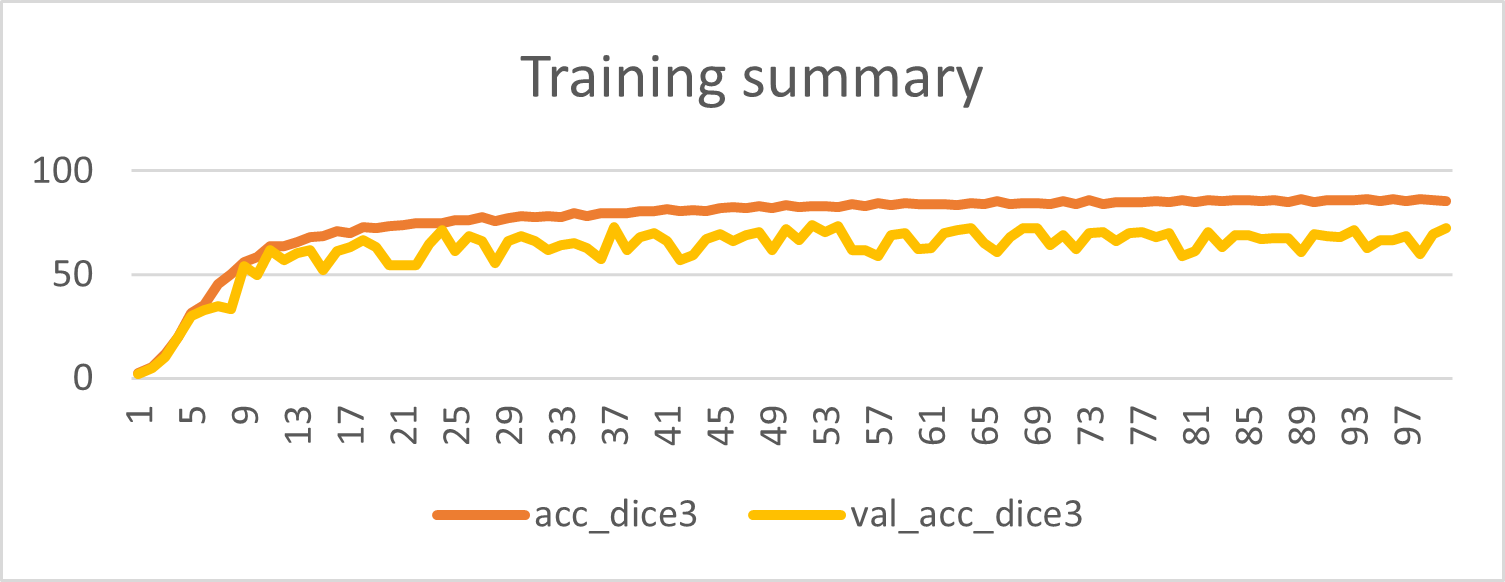
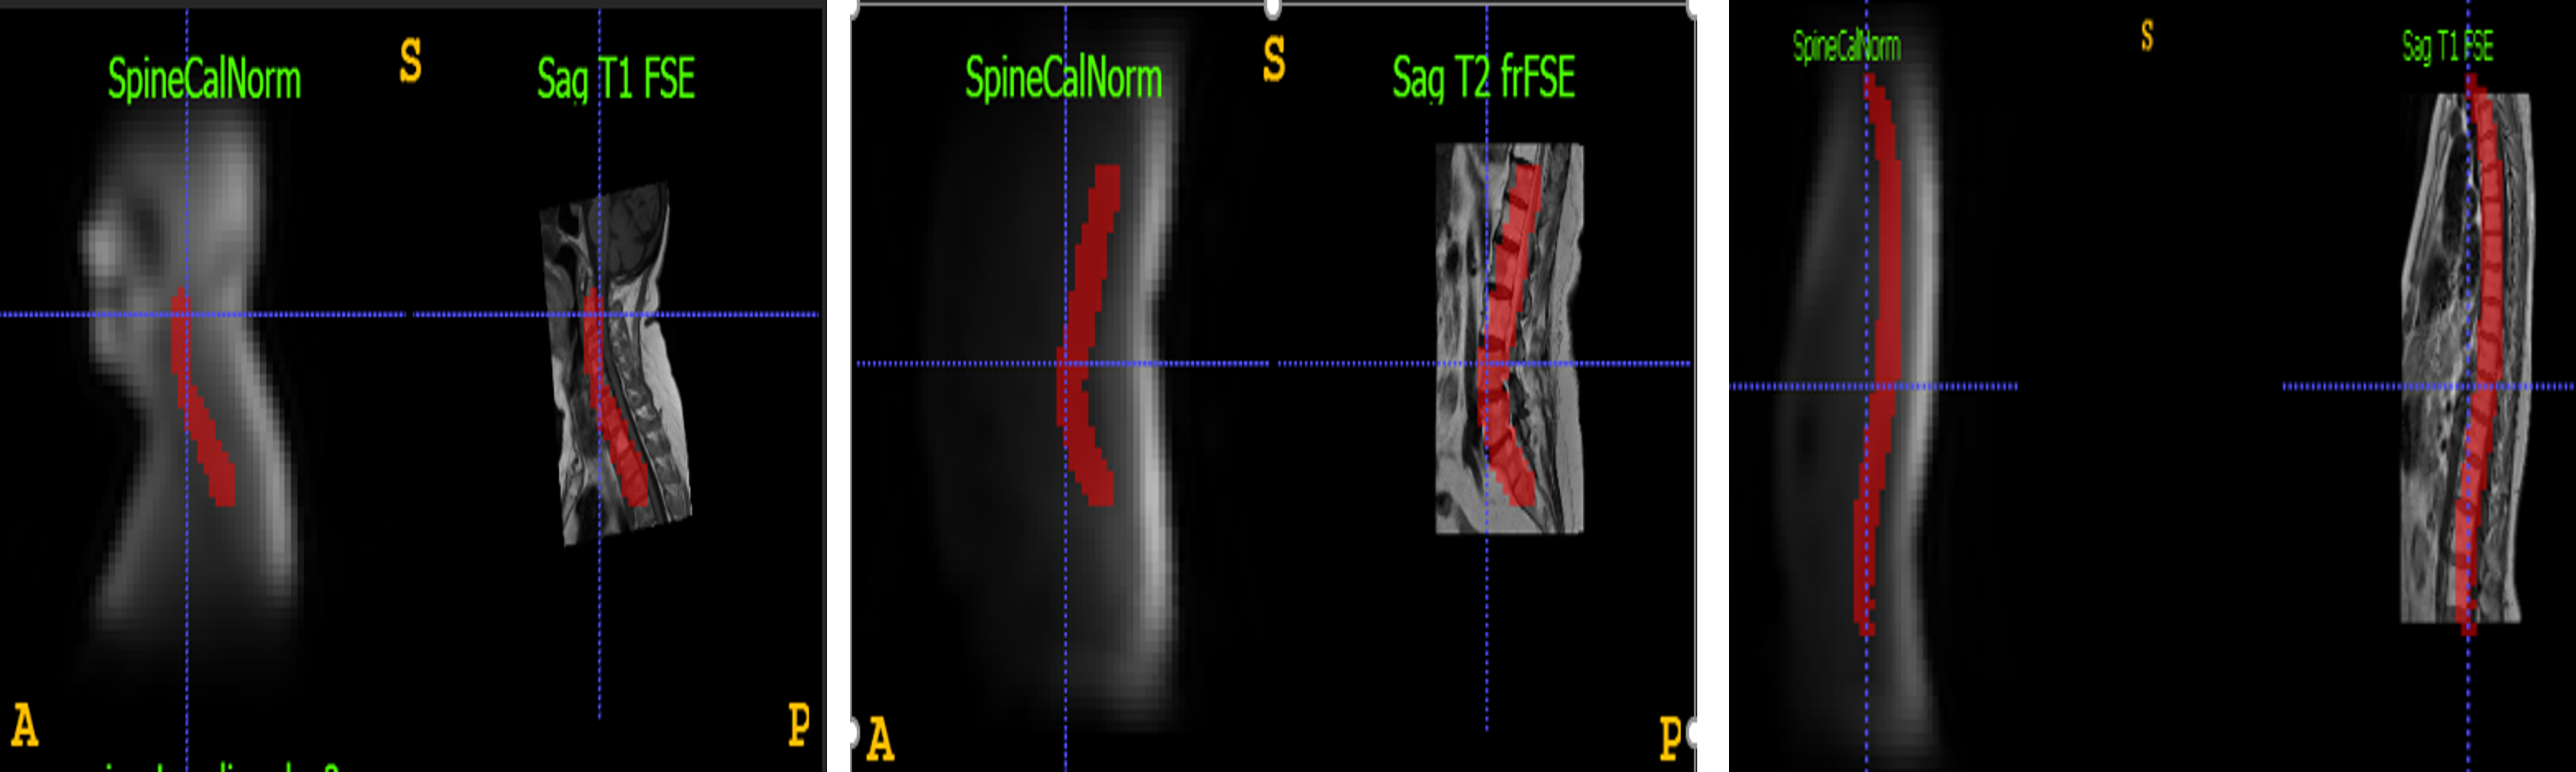
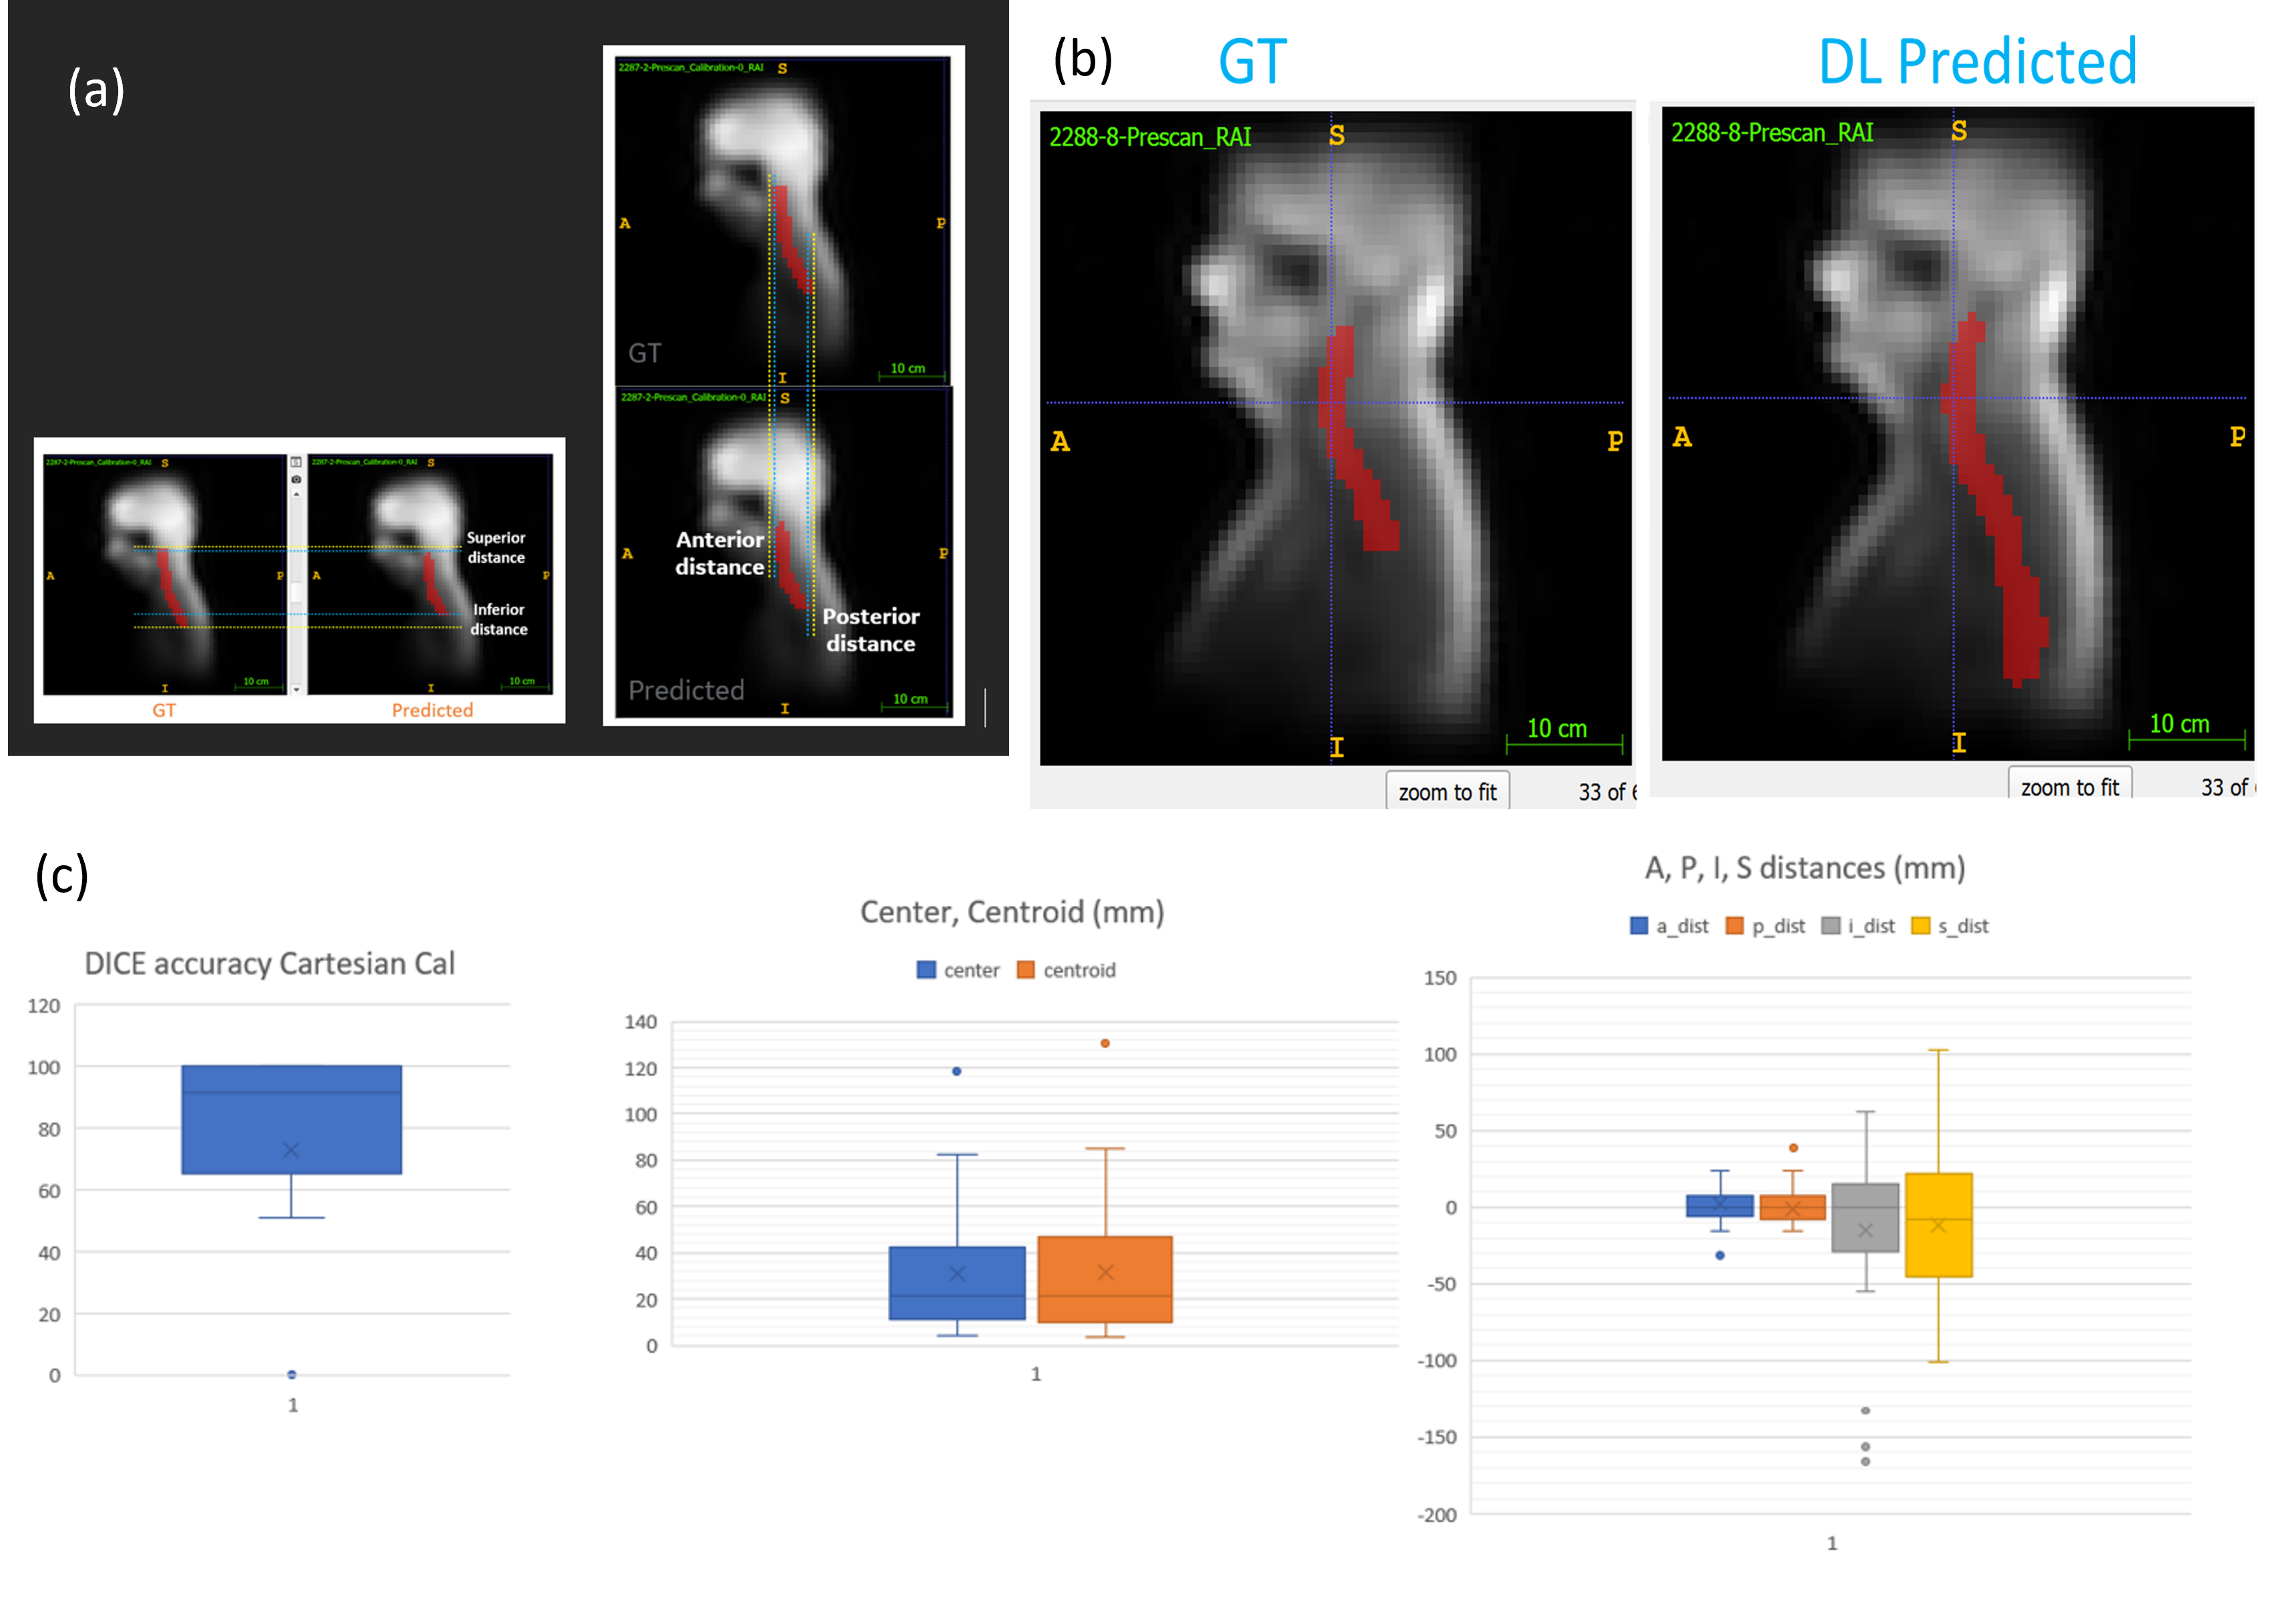
Figure 5 (a) shows the calculation of distance errors and shift in AP and SI directions.
Figure 5(b): shows an example where GT might be limited due to limited SI coverage in high resolution, but DL predicted spine region covers the entire region as expected.
Figure 5 (c) shows the box plots of the DICE and distance errors.