1444
Segmentation and quantification of hand synovitis in rheumatoid arthritis on DCE-MRI-based clustering1Graduate School of Health Sciences, Hokkaido University, Sapporo, Japan, 2Faculty of Health Sciences, Hokkaido University, Sapporo, Japan, 3AIC Yaesu Clinic, Tokyo, Japan
Synopsis
Keywords: Rheumatoid Arthritis, DSC & DCE Perfusion
Volumetry of enhancing pannus can be used as a marker for disease activity in synovial proliferative disorders such as RA. Enhancing pannus quantified by manual outlining as well as semiquantitative visual assessment of synovitis is too time-consuming to be justified in busy clinical practice. Our study showed great potential for automated quantitative segmentation and quantification of enhancing pannus, which would allow for accurate estimation of disease aggressiveness and thus prompt early therapeutic intervention for patients and assessment of treatment efficacy without increasing the burden on physicians.Introduction
Synovitis (inflammation of the synovial membrane) is an early feature of rheumatic diseases. It is considered an essential factor in the chronicity of the disease and the best predictor marker of joint damage.1 Furthermore, synovial volume correlates with joint swelling and tenderness and the rate of erosion progression associated with baseline synovial volume.2 As a consequence, accurate quantification and early detection of synovitis play a critical role in the clinical evaluation and treatment of RA.The synovial membrane (pannus) can be evaluated on MRI using semi-quantitative or quantitative methods. The Outcome Measures in Rheumatology (OMERACT) RA MRI Scoring system (RAMRIS) is a scoring system for semi-quantitative evaluation of synovitis were provided, and this method is now the standard MRI method used in RA clinical trials.3 However, enhancing pannus quantified by semi-quantitative visual assessment is too time-consuming to be justified in busy clinical practice.
In recent years, many researchers focused on using Time-intensity curve (TIC) shape analysis in DCE-MRI to quantify synovitis of RA. Pixel-by-pixel TIC shape analysis is a new DCE-MRI technique to help visualize differently shaped TICs.4 Pixels having TIC shape type 4, characterized as early enhancement followed by washout phase, were regarded as synovitis pixels.5 TIC shape analysis may be an alternative to the gold standard of manual contouring for pannus quantification was demonstrated using pixel-by-pixel TIC shape analysis.4 Unfortunately, this study4 has difficulty eliminating the artery pixels and may cause quantified synovitis of RA inaccurately. The arterial mask subtraction method (AMSM) with mutual information (MI) has been proposed to improve the accuracy of pixel-by-pixel TIC shape analysis in dynamic MRI.5 Although the result was very exciting in this study, this method has not been put into practice because it takes a long time to analyze.
In this study, we proposed an unsupervised classification for automatically segmenting and quantifying enhanced synovial membranes in patients with inflammatory arthritis on DCE-MRI based on TIC curves.
Methods
In this retrospective study, hand DCE-MRIs were recruited from 12 rheumatoid patients (ten females and two males; mean age, 56.8 years). Under expert guidance, two researchers outlined regions of interest (ROIs) on muscle, bone, and synovitis on 3T MRI of the hands and obtained every signal of the corresponding time-intensity curve (TIC) to make the dataset. The ground truth of the enhanced pannus region was manually segmented with care by one experienced MSK radiologist. The radiologist was asked to segment the pannus at the 10th phase when synovial pannus with significant enhancement of DCE-MRI. This study used the corresponding time-intensity curve (TIC) signal to train the classifier. Our training data includes 6865 TIC shapes (muscle:2670, bone:2505, and synovitis:1690). Phase-only correlation (POC) and median filtering for motion correction and noise reduction in DCE-MRI images, respectively. The fuzzy c-means algorithm was used to classify different pixels according to the signal intensity of TIC on DCE-MRI to achieve segmentation of enhanced synovial pannus.The correlation between the number of synovitis pixels obtained by manual outlining and by network quantification was evaluated using Spearman's rank correlation coefficient and Bland-Altman analysis. K-fold cross-validation was performed to verify the performance of our algorithm (k=12). The dice score was used to evaluate enhancing synovial pannus segmentation accuracy.
Results
The number of enhancing pannus pixels measured by our algorithm had a good correlation with the ground truth (r = 0.748, P < .001). Bland-Altman analysis revealed that network measurements were systematically lower by 5.7% compared to manual outlining. Our algorithm demonstrated a mean cross-validation accuracy of 0.99 ± 0.02, a sensitivity of 0.82 ± 0.14, a specificity of 0.99 ± 0.01, a precision of 0.76 ± 0.15, a false positive rate (FPR) of 0.004 ± 0.01, a false negative rate (FNR) of 0.03 ± 0.08 for predicting the enhanced synovial membranes. The mean Dice score was 0.77 ± 0.103 for synovitis segmentation.Discussion
In this study, we performed automated segmentation and quantification of enhanced pannus in rheumatoid hands using a DCE-MRI-based TIC curve analysis. The mean Dice score of our synovitis segmentation algorithm is 0.77, which is acceptable in clinical practice. In addition, pixel-level segmentation allows for identifying tiny synovitis that is difficult to recognize with the naked eye. However, the existing network is ineffective for identifying and segmenting blood vessels because both synovitis and arteries/veins display similar TIC shapes on DCE- MRI. The accuracy of identifying enhanced synovial membranes would be improved if the contamination of vessels could be eliminated. Visual Grading and manual segmentation of synovitis are cumbersome in clinical practice with unstable inter- and intra-observer variability. Our approach is more objective and could significantly reduce the clinicians' workload for optimally managing RA patients.Conclusion
In summary, our study suggests that DCE-MRI TIC shape analysis based on clustering has great potential for automatically segmenting and quantifying enhanced synovial pannus in the hands of RA patients.Acknowledgements
No acknowledgement found.References
1. Carotti M, Galeazzi V, Catucci F, Zappia M, Arrigoni F, Barile A, et al. Clinical utility of eco-color-power Doppler ultrasonography and contrast enhanced magnetic resonance imaging for interpretation and quantification of joint synovitis: a review. Acta Biomed. 2018;89(1-S):48-77.
2. Burke CJ, Alizai H, Beltran LS, Regatte RR. MRI of synovitis and joint fluid. J Magn Reson Imaging. 2019;49(6):1512-27.
3. Ostergaard M, Peterfy CG, Bird P, Gandjbakhch F, Glinatsi D, Eshed I, et al. The OMERACT Rheumatoid Arthritis Magnetic Resonance Imaging (MRI) Scoring System: Updated Recommendations by the OMERACT MRI in Arthritis Working Group. J Rheumatol. 2017;44(11):1706-12.
4. Sakashita T, Kamishima T, Kobayashi Y, Sugimori H, Tang M, Sutherland K, et al. Accurate quantitative assessment of synovitis in rheumatoid arthritis using pixel-by-pixel, time-intensity curve shape analysis. Br J Radiol. 2016;89(1061):20151000.
5. Kobayashi Y, Kamishima T, Sugimori H, Ichikawa S, Noguchi A, Kono M, et al. Quantification of hand synovitis in rheumatoid arthritis: Arterial mask subtraction reinforced with mutual information can improve accuracy of pixel-by-pixel time-intensity curve shape analysis in dynamic MRI. J Magn Reson Imaging. 2018.
Figures
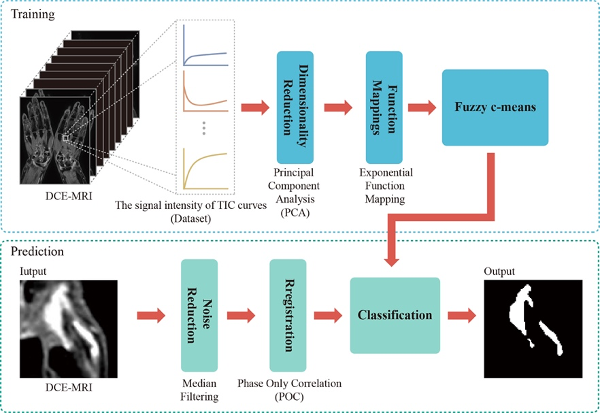
Figure 1. The flowchart of the algorithm.
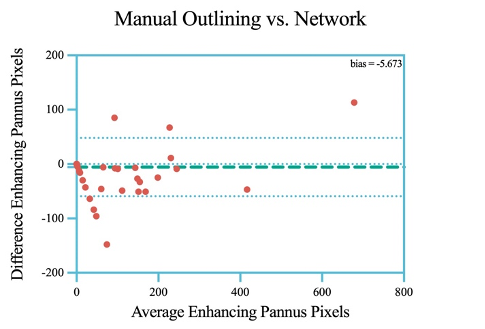
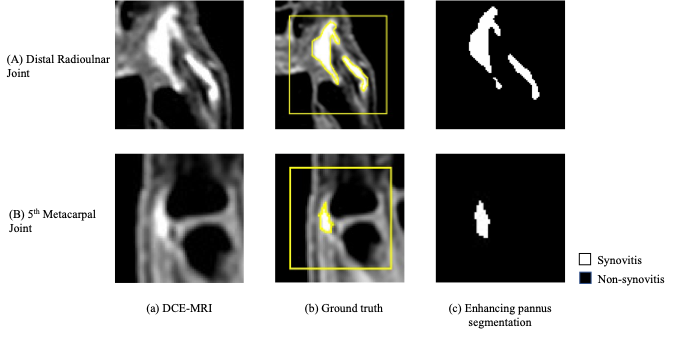
Figure 3. Examples of segmentation of enhancing pannus based on the TIC characteristic curve. (a) Native DCE-MRI Image, (b) ground truth from manual segmentation, (c) Enhancing pannus segmentation obtained from the network. The Dice scores were 0.86 and 0.85 for (A) the distal radioulnar joint and (B) the 5th metacarpal joint, respectively.