1439
Probing muscle recovery following downhill running using precise mapping of MRI’s T2 relaxation times1Department of Biomedical Engineering, Tel Aviv University, Tel Aviv, Israel, 2Department of Epidemiology and Preventive Medicine, School of Public Health and Sylvan Adams Sports Institute, Tel Aviv University, Tel Aviv, Israel, 3Center of AI and Data Science (TAD), Tel Aviv University, Tel Aviv, Israel, 4Sagol School of Neuroscience, Tel Aviv University, Tel Aviv, Israel, 5Center for Advanced Imaging Innovation and Research (CAI2R), New-York University Langone Medical Center, New York, NY, United States
Synopsis
Keywords: Muscle, Skeletal
Post-exercise recovery rate is vital for planning training protocols, maintaining high-level performance, and preventing injuries. Notwithstanding the advancement of noninvasive imaging, there is still a lack in efficient tools for monitoring muscle state and post-exercise due to the relatively small changes in the muscles’ microarchitecture, and the high variability in recovery rate between and within participants. Here we utilized the echo-modulation-curve (EMC) algorithm, a highly accurate and precise tool for mapping T2 relaxation times, to track muscle damage and recovery following exercise. Results show that this approach provides new insights into the microstructural processes that occur following exercise.
INTRODUCTION
Accurate follow-up of muscle damage and recovery can assist in detecting pre-symptomatic muscle damage, designing safe exercise plans, and preventing overtraining1. Many studies explored efficient ways to facilitate recovery and to shed light on individual recovery mechanisms following exercise-induced muscle damage (EIMD)2–4. These studies notwithstanding, the variability in recovery rate between and within participants remains uncertain, raising the need for more in-depth and accurate tools for tracking muscle state.Several studies used MRI's T2 relaxation time as a marker for muscle damage. Traditionally, these studies estimated T2 values by fitting multi-echo spin-echo (MESE) data to an exponentially decaying signal model5–8, and reported relatively minor changes of 2 ms and blow in T2 values of the lower limb muscles. High precision T2 mapping is therefore essential for estimating changes post-exercise. This may reveal subtle changes that are visually undiscernible, and allow to isolate and investigate secondary mechanisms that affect the T2 relaxation curves in MESE protocols, e.g., magnetization transfer and molecular diffusion9–13.
In this study we used the echo-modulation-curve (EMC) quantitative T2 mapping technique14 to investigate muscle recovery following intensive downhill running (DHR) exercise on a cohort of 24 amateur male athletes. The EMC technique provides precise and platform-independent T2 values, and is therefore well-suited for identifying the relatively small changes, expected following exercise. To estimate muscle state, T2 values were measured at different regions in the thigh and compared across three time points: at baseline (BL, i.e., before the exercise protocol), one hour after (1H), and 48-hours after (48H) DHR.
METHODS
Study population: Twenty-four healthy active men volunteered to participate in the study after signing informed consent and under IRB approval #0345–19. Participants age and weight were 34.8 ± 9 years old and 76 ± 11 kg respectably. All participants trained at least four times a week and regularly competed in long-distance running and triathlon events.Downhill running (DHR) protocol: The DHR protocol consisted of a 5 min warm-up at 0% grade while speed was increased every 30 seconds until a target HR of 65% of maximum heart rate (HRmax) was reached. Following the warm-up, the slope of the treadmill was reduced to −10% (minus 10%) for 55 min with the running speed adjusted throughout the test so that each participant’s HR remained at 65% HRmax.
MRI scans were performed on a Siemens Prisma 3T scanner. A six-channel receiver coil was placed on the distal quarter of the right thigh, and 13 axial slices were scanned. Quantitative T2-mapping was performed using a 2D MESE pulse sequence for a series of increasing TE values [TR/TE/echo-spacing = 3200/10/10 ms, echo train length (ETL) = 14, acquisition bandwidth = 200 Hz/Pixel, matrix size 160x160x16, FOV 220x220 mm2, slice thickness = 4 mm, slice-gap = 12 mm, and ×2 GRAPPA acceleration].
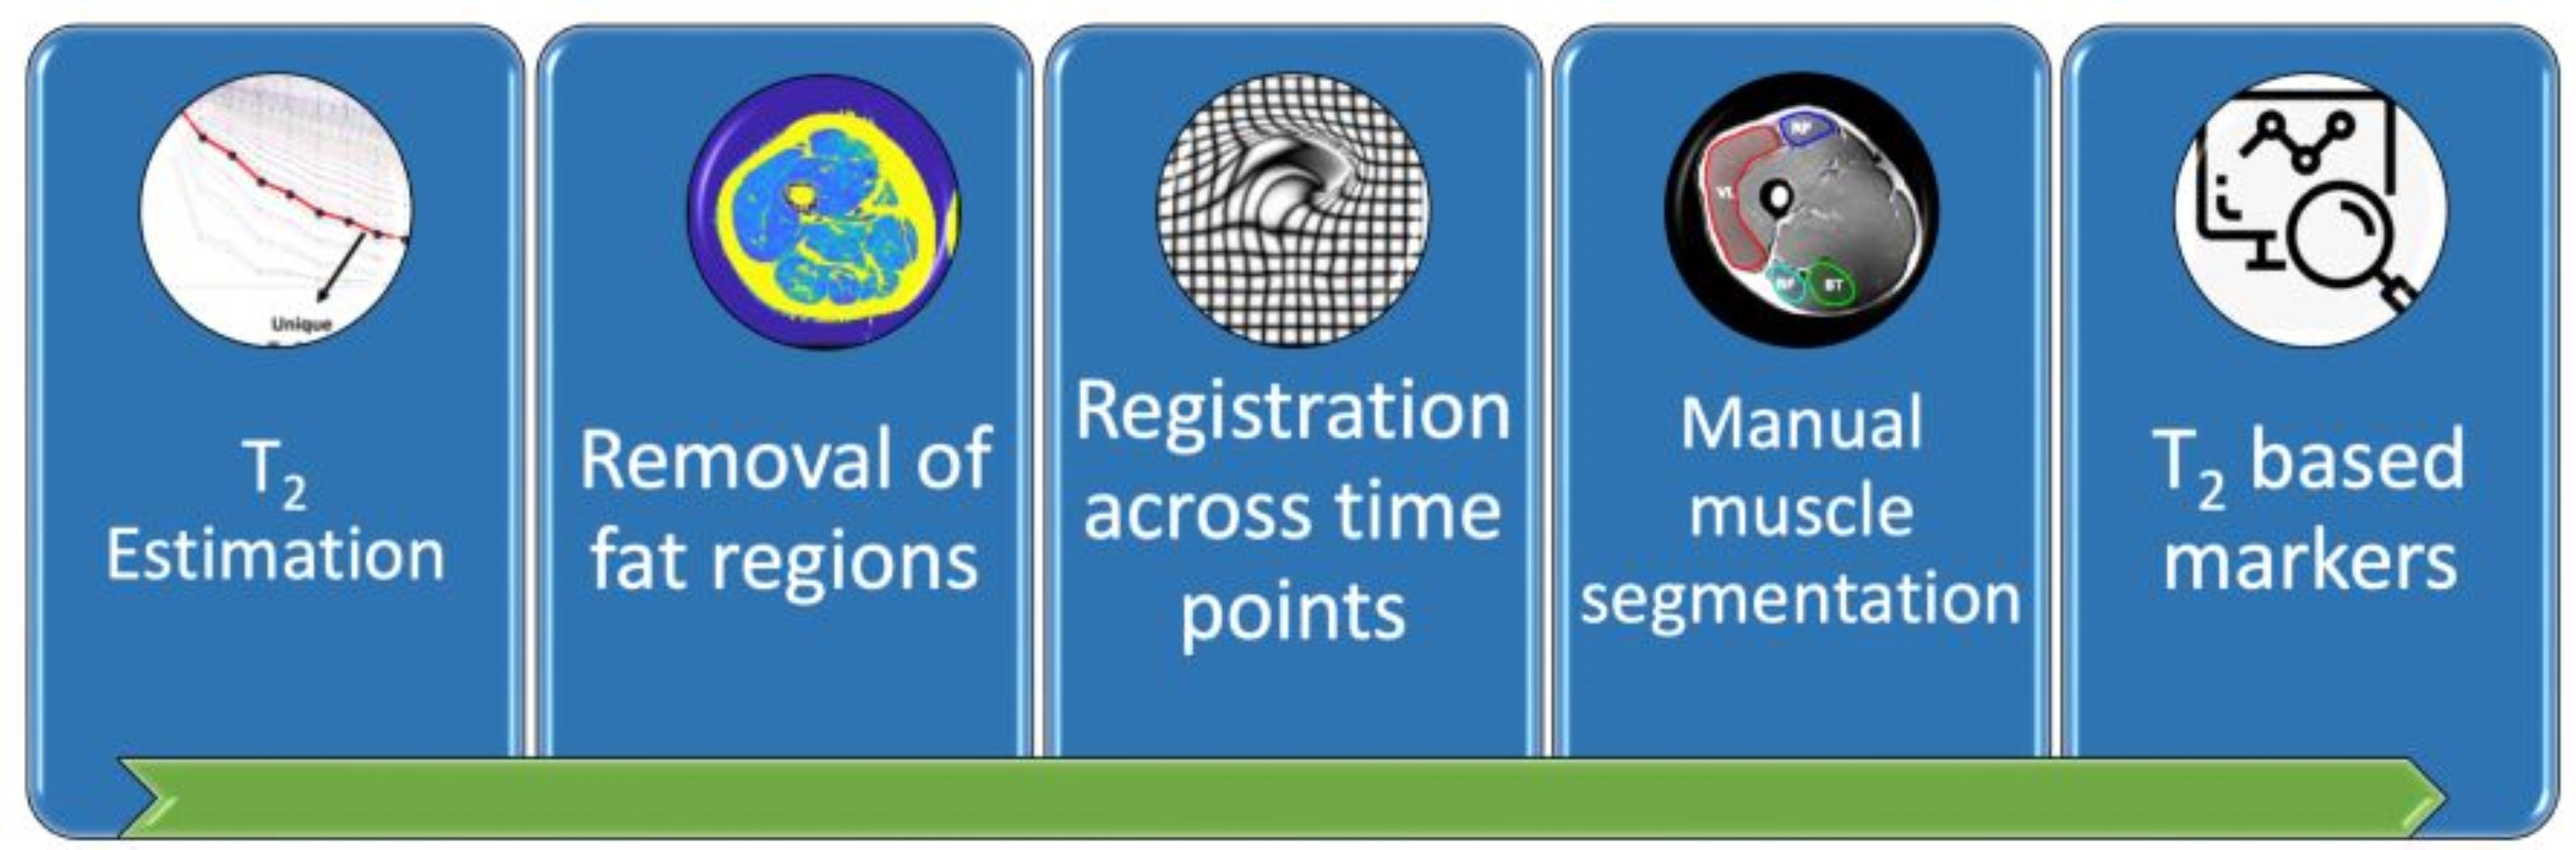
Data processing pipeline is illustrated in Fig. 1. T2 values were estimated using the EMC algorithm15. Image registration was then performed between the three time points using ANTS16. Next, voxels with T2 > 50 ms were tagged as fat tissue and removed from the calculation17. Manual segmentation of selected muscles was performed for each subject and time point, on three representative slices selected by a physiologist. Two pairs of muscles regions-of-interest (ROIs) were segmented: vastus lateralis (VL) and rector femoris (RF) constituting the anterior compartment of the thigh primary mover muscles; and biceps femoris (BF) and semitendinosus (ST) constituting the posterior compartment of the thigh muscles. Lastly, mean and standard deviation (SD) of T2 values were calculated for each ROI.
Statistical analysis: Two-tailed paired sample t-test was used to investigate whether T2 values changed between time points. Multiple comparisons correction was done using the Benjamini-Hochberg method (BH)18,19.
RESULTS
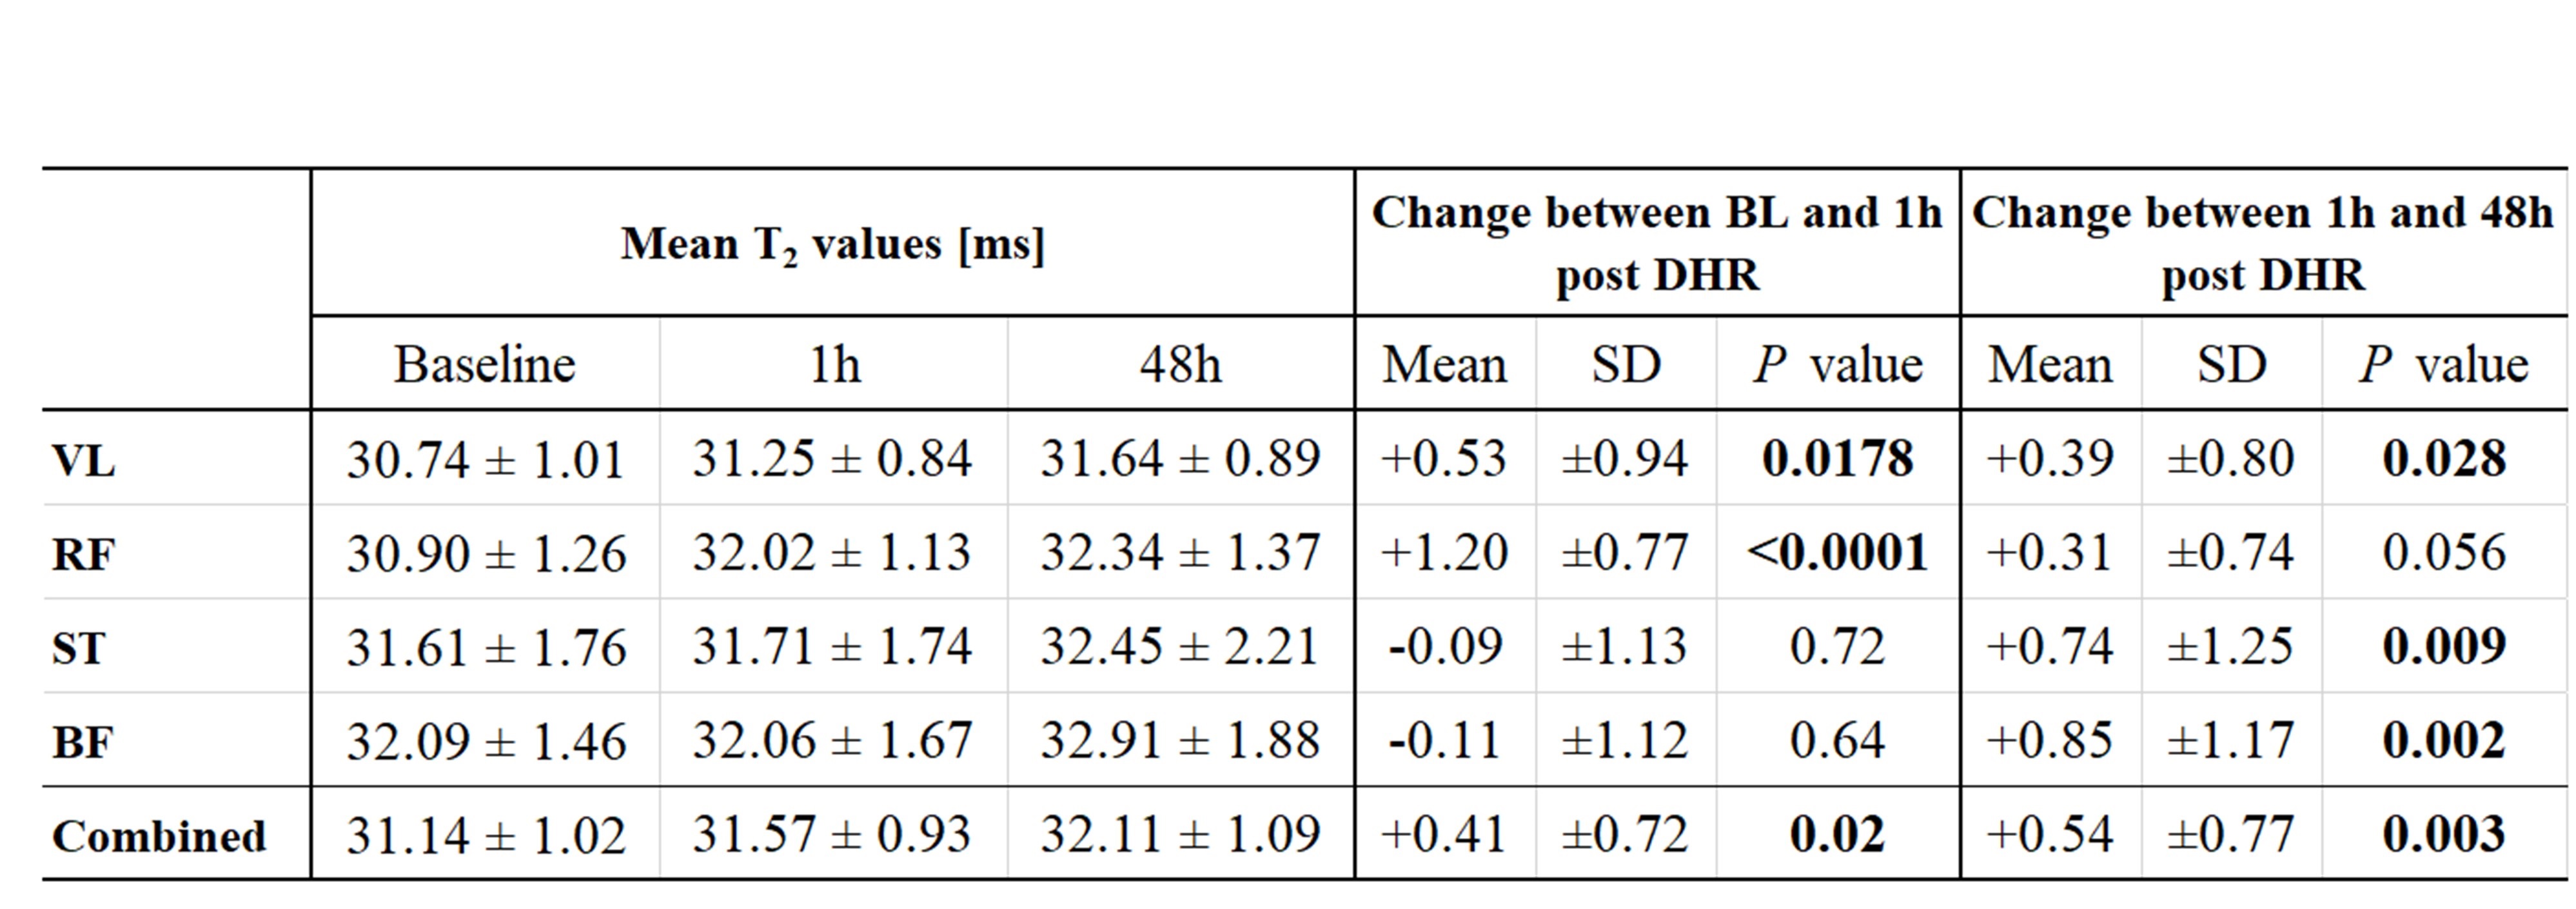
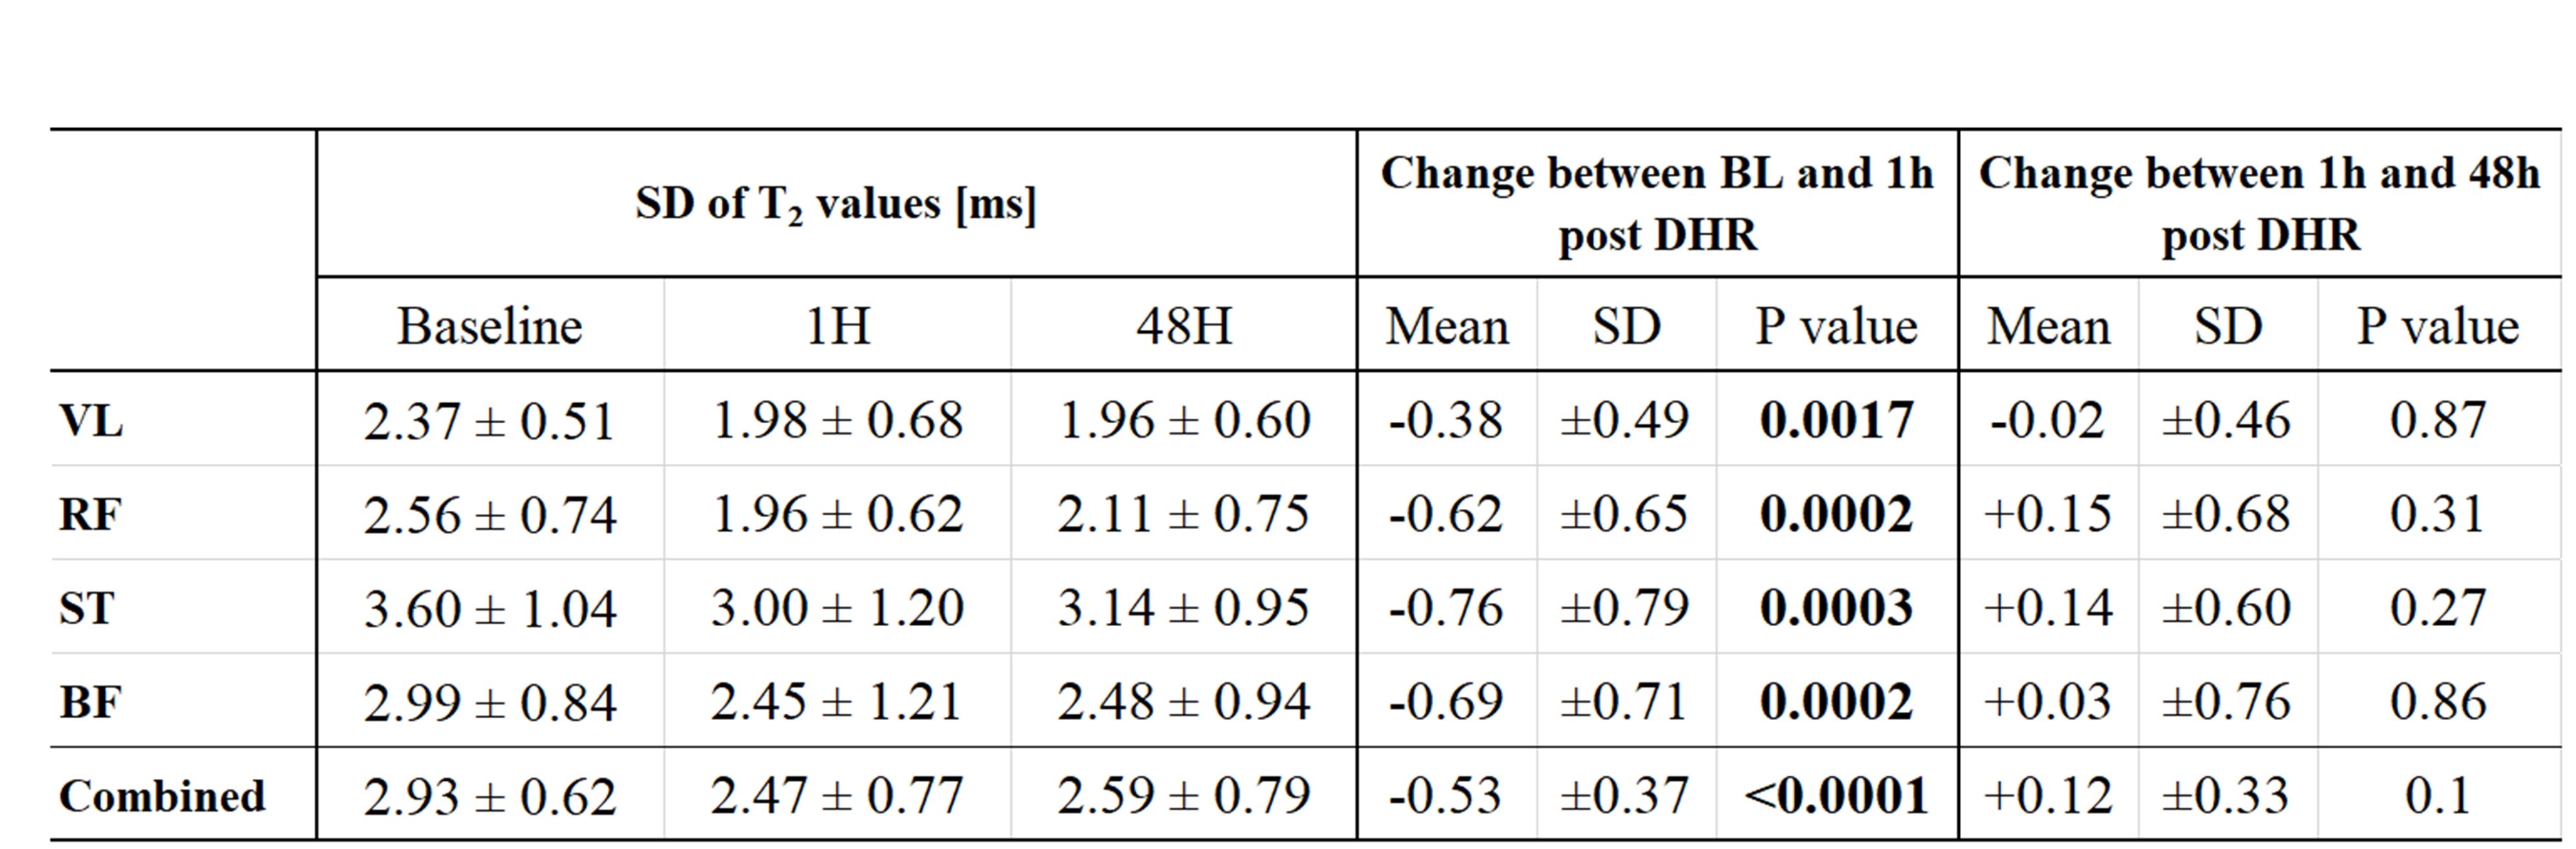
Table 1 lists the mean T2 values for each of the assayed muscles (VL, RF, BF, and ST). Statistically significant changes were found in the mean T2 values for the primary movers (VL and RF muscles) between baseline and 1h post DHR protocol. Differences became significant for the second pair of muscles, ST and BF, at the third time point – presumably due to a secondary effect related to a systemic response to DHR protocol.Analysis of intra-ROI SD of T2 values is presented in Table 2. SD values decreased immediately post-exercise for all tested muscles (BL vs. 1h) reflecting an overall decrease in the tissue’s heterogeneity. No considerable change was observed between 1h and 48h indicating that the change in tissue heterogeneity occurs at short time scales (right after the exercise) and does not fully recover after 48h.
DISCUSSION
The EMC algorithm14,15 offers high precision mapping of T2 values, we allowing to identify significant changes in the mean and SD of T2 relaxation times after EIMD. To the best of our knowledge, our study is the first to analyze changes in muscle heterogeneity (i.e., SD) following aerobic-based EIMD. These changes reflect microstructural muscle damage and may enhance subsequent studies geared towards understanding exercise damage and recovery processes. Precise mapping of muscle T2 values may moreover provide valuable information for planning personalized training plans, rehabilitation activities, and understanding skeletal muscle pathophysiology.Acknowledgements
This work was supported by AFM Téléthon Grant #23604, and by the Tel Aviv University Center for AI and Data Science (TAD, 590957).References
1. Kellmann M, Bertollo M, Bosquet L, et al. Recovery and performance in sport: Consensus statement. Int J Sports Physiol Perform. 2018;13(2):240-245.
2. Shin MS, Sung YH. Effects of massage on muscular strength and proprioception after exercise-induced muscle damage. 2015;29(8):2255-2260.
3. Howatson G, Van Someren KA. The Prevention and Treatment of Exercise-Induced Muscle Damage. Sport Med. 2008;38(6):483-503.
4. Bleakley CM, Davison GW. Cryotherapy and inflammation: evidence beyond the cardinal signs. Phys Ther Rev. 2010;15(6):430-435.
5. Takahashi H, Kuno S, Miyamoto T, et al. Changes in magnetic resonance images in human skeletal muscle after eccentric exercise. Eur J Appl Physiol. 1994;69(5):408-413.
6. Maeo S, Ando Y, Kanehisa H, Kawakami Y. Localization of damage in the human leg muscles induced by downhill running. Sci Rep. 2017;7(1):1-11. http://dx.doi.org/10.1038/s41598-017-06129-8
7. Keller S, Yamamura J, Sedlacik J, et al. Diffusion tensor imaging combined with T2 mapping to quantify changes in the skeletal muscle associated with training and endurance exercise in competitive triathletes. Eur Radiol. 2020;30(5):2830-2842.
8. Varghese J, Scandling D, Joshi R, et al. Rapid Assessment of Quantitative T1, T2, and T2* in Lower Extremity Muscles in Response to Maximal Treadmill Exercise Juliet. NMR Biomed. 2015;28(1):998-1008.
9. Solomon C, Blumenfeld-Katzir T, Salti M, et al. Quantitative Estimation of Visual Sensitivity to Early Pathological Changes in T2 Weighted Images. In: Proceedings of the 28th Annual Meeting of the Intr. Soc. Magn. Reson. Med. , Virtual Conference. #3168; 2020. https://www.ismrm.org/20/program_files/DP08-01.htm
10. Shepherd TM, Kirov II, Charlson E, et al. New rapid, accurate T2 quantification detects pathology in normal-appearing brain regions of relapsing-remitting MS patients. NeuroImage Clin. 2017;14:363-370. http://dx.doi.org/10.1016/j.nicl.2017.01.029
11. Bnaiahu N, Omer N, Wilczynski E, Levy S, Blumenfeld-Katzir T, Ben-Eliezer N. Correcting for imaging gradients–related bias of T2 relaxation times at high-resolution MRI. Magn Reson Med. Published online 2022. doi:10.1002/mrm.29319
12. Radunsky D, Blumenfeld-Katzir T, Volovyk O, et al. Analysis of magnetization transfer (MT) influence on quantitative mapping of T2 relaxation time. Magn Reson Med. 2019;82(1):145-158.
13. Hagiwara A, Kamagata K, Shimoji K, et al. White matter abnormalities in multiple sclerosis evaluated by quantitative synthetic MRI, diffusion tensor imaging, and neurite orientation dispersion and density imaging. Am J Neuroradiol. 2019;40(10):1642-1648.
14. Ben-Eliezer N, Sodickson DK, Block KT. Rapid and accurate T2 mapping from multi-spin-echo data using bloch-simulation-based reconstruction. Magn Reson Med. 2015;73(2):809-817.
15. Radunsky D, Stern N, Nassar J, Tsarfaty G, Blumenfeld-Katzir T, Ben-Eliezer N. Quantitative platform for accurate and reproducible assessment of transverse (T2) relaxation time. NMR Biomed. 2021;34(8):1-14.
16. Avants B, Tustison N, Johnson H. Advanced Normalization Tools (ANTS). Insight J. 2009;2(365):1-35.
17. Azzabou N, Loureiro de Sousa P, Caldas E, Carlier PG. Validation of a generic approach to muscle water T2 determination at 3T in fat-infiltrated skeletal muscle. J Magn Reson Imaging. 2015;41(3):645-653.
18. Benjamini Y, Hochberg Y. Controlling the False Discovery Rate : A Practical and Powerful Approach to Multiple Testing. J R Stat Soc. 1995;57(1):289-300.
19. Heiss R, Hotfiel T, Kellermann M, et al. Effect of compression garments on the development of edema and soreness in delayed-onset muscle soreness (DOMS). J Sport Sci Med. 2018;17(3):392-401.
Figures