1432
Accelerated 3D Stack-of-Spiral Cardiac Quantitative Susceptibility Mapping: Noninvasive Measurement of Heart Oxygenation in a Breath-Hold1Biomedical Engineering, Cornell University, Ithaca, NY, United States, 2Radiology, Weill Cornell Medicine, New York, NY, United States, 3Medicine, Weill Cornell Medicine, New York, NY, United States
Synopsis
Keywords: Heart, Oxygenation
A breath-holding non-cardiac gated 3D stack-of-spiral data acquisition scheme was developed to continuously sample the data for cardiac quantitative susceptibility mapping. Compared to the previously proposed navigator-based prospective Cartesian acquisition, the accelerated spiral sequence can be done within 20 seconds breath-holds, leading to over a 20-fold reduction in scan time. The spiral QSM as well as the navigator QSM were performed on cohorts of healthy volunteers and COVID-19 survivors, showing well aligned quantification results on the differential blood oxygenation between the right and left heart.Introduction
Cardiac Quantitative Susceptibility Mapping (QSM)1 has been developed to non-invasively measure the differential blood oxygen saturation (ΔSaO2) between the right and left heart. The novel cardiac magnetic resonance imaging technique utilizes the susceptibility contrast derived from deoxygenated blood pool. Previously, a prospective data sampling strategy based on free-breathing 1D diaphragmatic navigator and ECG triggered 3D Cartesian multi-echo gradient echo acquisition was proposed to acquire the multi-echo gradient echo data needed for QSM2. However, this method requires a complicated scanning setup and suffers from low scanning efficiency, depending on the subject’s respiratory and cardiac movements. To speed up the acquisition, a breath-holding non-cardiac gated 3D stack-of-spiral scheme is used in this study to continuously sample the data for cardiac QSM by exploiting the high efficiency and motion robustness of non-Cartesian acquisition, and the ΔSaO2 quantification is compared with the navigator method.Methods
The accelerated cardiac QSM data acquisition used a 3D spoiled multi-echo stack-of-spiral sequence. A variable density spiral trajectory was designed to have a 2-fold oversampling ratio in the center of k-space with the edges undersampled by the factor of 0.7, to achieve a fully sampled k-space with 36 leaves, based on the given gradient strength and slew rate limit.3 The multi-echo signal was sampled along the same spiral leaf in each repetition time and across all slice encodes before moving on to the consecutive golden-angle rotated leaf. Scan time was 20sec using a breath-hold covering the whole heart in the axial plane with the following imaging parameters: number of spiral leaves Nl = 36, each spiral leaf readout points Nsp = 1096, readout bandwidth ±125kHz, flip angle FA = 12º, number of echoes Ne = 3, TE1/TR/ΔTE = 0.4/17.8/5.9msec, reconstructed matrix size 256×256×24, image resolution 1.8×1.8×5mm3. A reference free induction decay (FID) signal at each kz encoding was acquired at the beginning of the scan for off resonance correction.4 The spiral QSM sequence was performed on a 3T scanner (GE750) on healthy volunteers as well as on a 3T clinical scanner (GE PET/MR) on COVID-19 survivors. For comparison, Cartesian navigator QSM (“NAV”) was acquired at the same time on all the subjects on axial plane, with the following parameters: readout bandwidth ±83.33kHz, flip angle FA = 15º, number of echoes Ne = 5, TE1/TR/ΔTE = 1.4/18.7/3.4msec, reconstructed matrix size 256×256×24, image resolution 1.8×1.8×5mm3. A GRAPPA factor of 2 was implemented in NAV QSM to reduce scan time. All subjects provided consent for this IRB approved protocol.The acquired spiral raw k-space phase data were first demodulated along the readout direction by the estimated field from reference FID on a slice-by-slice fashion for the purpose of off resonance correction. Gridding was applied on the fully sampled spiral to reconstruct the multi-echo complex images.3 Next, the field map was fitted from the multi-echo complex data and unwrapped by graph-cut based method5, with iterative decomposition of water and fat with echo asymmetry and least squares estimation (IDEAL)6 for water fat separation. Then total field inversion (TFI+0)2,7,8 together with regularization of blood pool susceptibility variation was performed:
$$y^*=arg\min_y ||w(f-DPy)||^2_2 + \lambda ||M_G\triangledown Py||_1 + \sum_i \lambda_i ||M_iP(y-\overline{y}^i)||^2_2$$
The first term imposes data fidelity on the dipole field convolution; the second and third term introduce l-1 regularization and additional blood pool uniformity regularization inside each heart chamber region, segmented from the combined-echo magnitude, respectively. ΔSaO2 is estimated from the difference between the mean susceptibility in right/left ventricle blood pools scaled by hematocrit. ΔSaO2 estimated from spiral QSM were compared with the navigator QSM by Deming regression and Bland Altman plots. Image reconstruction was performed using in-house C++ program. QSM reconstruction were conducted on MATLAB R2020b. Statistical analysis was performed using R 4.2.1.
Results
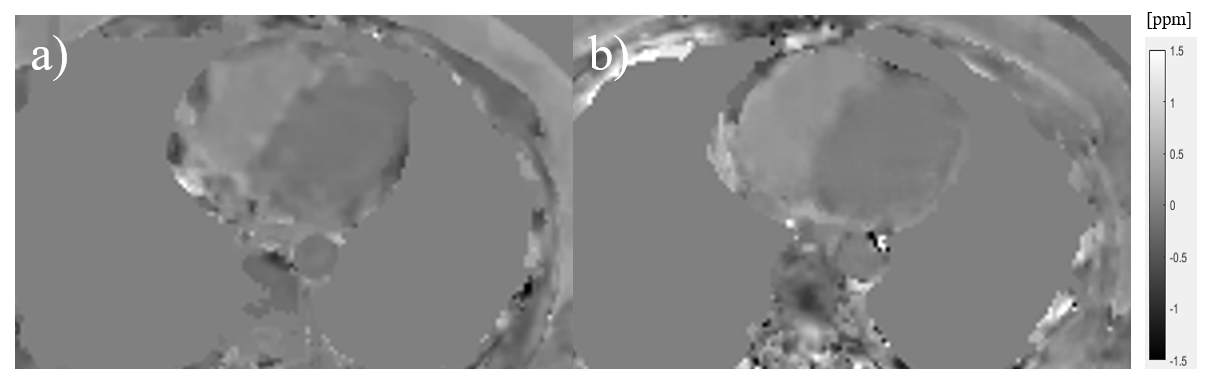
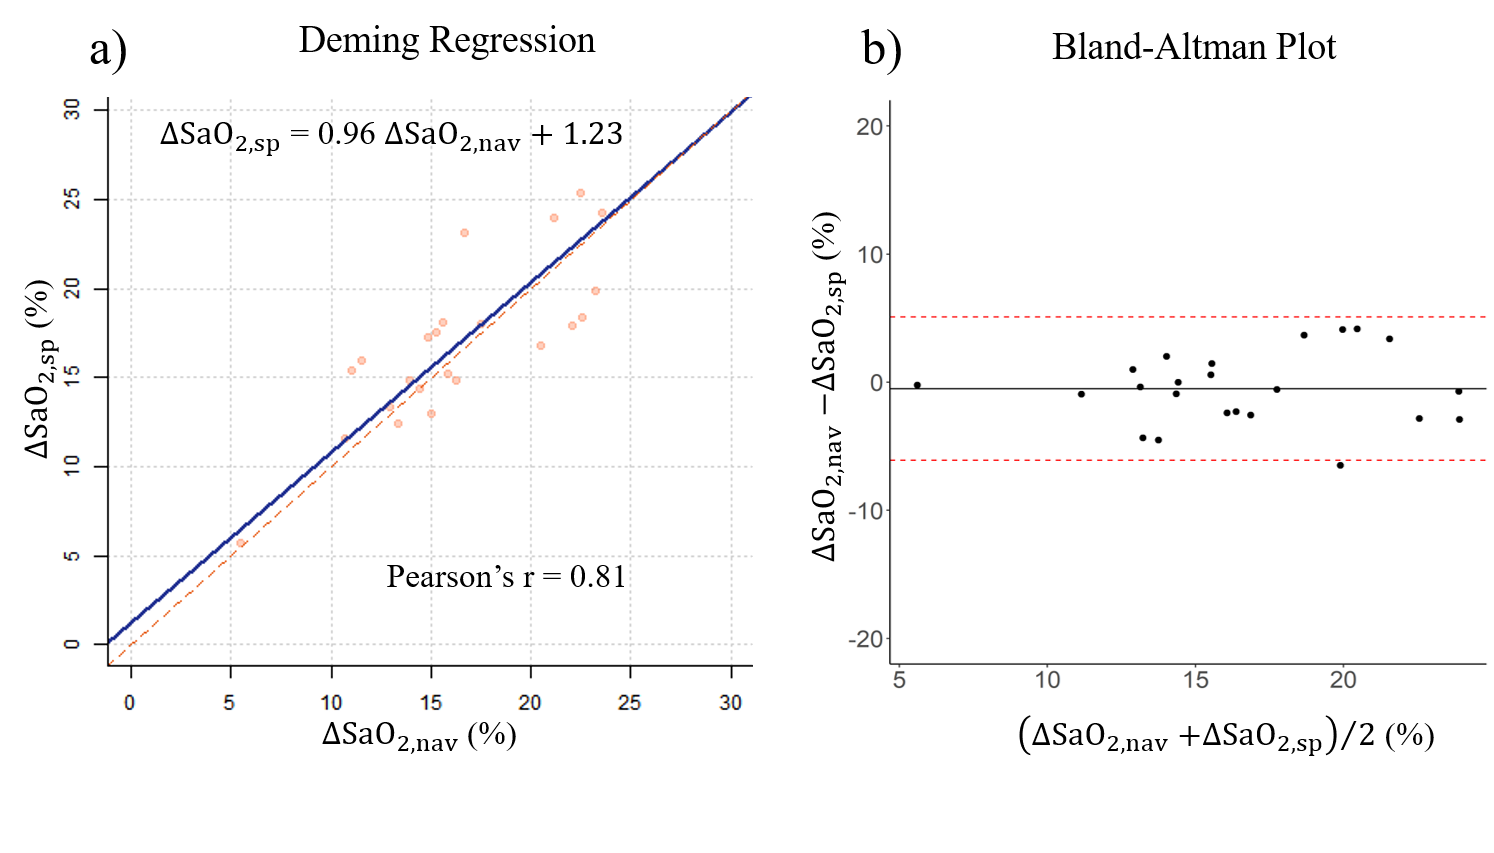
9 healthy volunteers as well as 14 COVID-19 survivors (age: 44±19, 52% male, N=23) underwent both spiral QSM and Cartesian NAV cardiac QSM all successfully. The Cartesian NAV acquisition time was 412±110sec, with navigator efficiency 37.7±8.8%. Spiral QSM reduced it within 20sec, over a factor of 20. Among all the subjects, the ΔSaO2 from spiral was 16.84±4.53%, compared to 16.43±4.70% for reference NAV acquisition.Figure 1 shows a representative case with the reconstructed QSM from reference NAV and spiral acquisition. Method comparison analysis (Figure 2) shows that spiral QSM has consistent quantification on ΔSaO2, compared with Cartesian NAV (ΔSaO2,sp = 0.96ΔSaO2,nav + 1.23 (%), Pearson’s r = 0.81).
Discussion
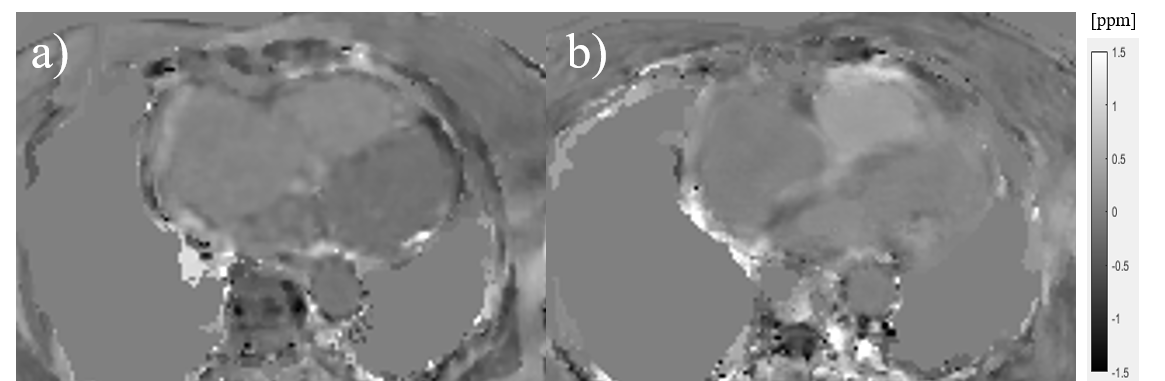
The proposed non-gated spiral cardiac QSM accelerated the scan within 20sec breath-holds, while achieving a consistent ΔSaO2 quantification compared to Cartesian NAV method. Validation of the proposed spiral QSM by comparing with right heart catheterization (RHC) is needed. Figure 3 shows such a comparison in one pulmonary hypertension patient (ΔSaO2 value: 28% RHC vs 22.5% NAV vs 26.8% spiral). Future work will introduce retrospective motion compensation/correction to overcome motion-induced blurring.Conclusion
The accelerated stack-of-spiral cardiac QSM reduced the scan time over a factor of 20 compared to the prospective navigator method with consistent ΔSaO2 quantification.Acknowledgements
No acknowledgement found.References
[1] Wen, Y., et al. "Cardiac quantitative susceptibility mapping (QSM) for heart chamber oxygenation." Magn. Reson. Med 79.3 (2018): 1545-1552.
[2] Wen, Y., et al. (2019). Free breathing three-dimensional cardiac quantitative susceptibility mapping for differential cardiac chamber blood oxygenation - initial validation in patients with cardiovascular disease inclusive of direct comparison to invasive catheterization. J Cardiovasc Magn Reson, 21(1), 70. https://doi.org/10.1186/s12968-019-0579-7
[3] Xu, B., et al. (2013), Fast 3D contrast enhanced MRI of the liver using temporal resolution acceleration with constrained evolution reconstruction. Magn Reson Med, 69: 370-381. https://doi.org/10.1002/mrm.24253
[4] Eskreis-Winkler, Sarah, et al. (2012) "Time-Efficient Approximate Inhomogeneity Correction Algorithm for 3D Spiral Contrast Enhanced Imaging of the Liver." 20th ISMRM 2012 Melbourne
[5] Reeder, Scott B., et al. (2005) "Iterative decomposition of water and fat with echo asymmetry and least‐squares estimation (IDEAL): application with fast spin‐echo imaging." Magn. Reson. Med., 54.3: 636-644.
[6] Dong, J., et al. (2015). Simultaneous phase unwrapping and removal of chemical shift (SPURS) using graph cuts: application in quantitative susceptibility mapping. IEEE Trans Med Imaging, 34(2), 531–540.
[7] Liu, Z, et al. (2017) "Preconditioned total field inversion (TFI) method for quantitative susceptibility mapping." Magn. Reson. Med., 78.1: 303-315.
[8] Liu, Z., et al. (2018), MEDI+0: Morphology enabled dipole inversion with automatic uniform cerebrospinal fluid zero reference for quantitative susceptibility mapping. Magn. Reson. Med., 79: 2795-2803. https://doi.org/10.1002/mrm.26946
Figures