1430
Accuracy, Precision, and Reproducibility of 3D Whole Heart Simultaneous T1 and T2 Mapping Based on Multi-parametric SAVA: A Comparison Study1Center for Biomedical Imaging Research, Department of Biomedical Engineering, Tsinghua University, Beijing, China, 2School of Medical Technology, Beijing Institute of Technology, Beijing, China, 3Department of Radiology, Case Western Reserve University, Cleveland, OH, United States
Synopsis
Keywords: Myocardium, Tissue Characterization
MR parametric mapping including T1 and T2 enabled quantitative evaluation of changes of myocardium. We previously proposed a time-efficient technique for 3D free-breathing simultaneous T1 and T2 mapping based on multi-parametric SAturation recovery and Variable flip Angle (mSAVA). This study evaluated the accuracy, precision, and reproducibility of mSAVA in comparison with conventional 2D sequences. mSAVA achieved good accuracy, between that of MOLLI and SASHA, and better precision and reproducibility than SASHA for T1 measurements. T2 measured by mSAVA had better precision and reproducibility than both GraSE and bSSFP T2. mSAVA offers a promising option for myocardial tissue characterization.
INTRODUCTION
CMR is one of the most important techniques for myocardial tissue characterization (1–3). MR parametric mapping, including T1 and T2, has enabled quantitative evaluation of changes of myocardium at a variety of pathologies, spanning local and diffuse disease (3). Several sequences have been proposed and adopted in clinic, such as modified Look-Locker inversion recovery (MOLLI) and saturation recovery single-shot acquisition (SASHA) for T1 mapping (4,5), as well as gradient spin echo (GraSE) and T2-prepared balanced Steady-State Free Precession (bSSFP T2) for T2 mapping (6,7). However, these conventional 2D sequences have reduced spatial coverage over the whole heart, typically limited to 3 short axis slices, and multi-parametric measurements require separate scans. We have proposed a 3D free-breathing joint T1 and T2 mapping sequence based on multi-parametric SAturation recovery and Variable flip Angle (mSAVA), which has been proved to be a time-efficient technique for whole heart imaging (8). The purpose of this study is to evaluate the accuracy, precision, and reproducibility of mSAVA for 3D myocardium T1 and T2 mapping. The performance was compared to conventional 2D sequences.METHODS
Pulse sequenceThe proposed mSAVA sequence acquires four 3D volumes with ECG trigger and respiratory navigator. The first volume is sampled without preparation pulses for the equilibrium longitudinal magnetization using a flip angle of 2° (9). The following three volumes are prepared by saturation with different delay times (TMAX/2, TMAX3/4 and TMAX) and T2 preparation with different echo times (0, 25 and 45 ms) to induce hybrid T1 and T2 weighting, where TMAX was the maximal available delay time in one cardiac cycle. T1 and T2 are jointly calculated from the four volumes using a dictionary matching method (8).
In-vivo experiments
The study was approved by the local IRB. Written informed consent was obtained from all subjects. Six normal human subjects (3 males, 24 ± 3 years) were recruited and scanned twice by mSAVA, MOLLI, SASHA, GraSE and bSSFP T2 (Figure 1) on a 3.0T MR scanner (Ingenia CX, Philips Healthcare, Best, Netherlands). Imaging parameters for mSAVA were: FOV 300×300×92mm3, voxel size 1.5×1.5×8mm3 reconstructed to 1.5×1.5×4 mm3, TR/TE 4.3ms/1.35ms, 35 readouts per diastolic interval. Prescribed scan time was 4 mins. Conventional 2D sequences acquired a single mid-level short axis slice. Imaging parameters were: FOV 300×300mm2, voxel size 2×2×10mm3. MOLLI was performed using 5s(3s)3s scheme. SASHA acquired ten images with saturation recovery time ranging from 130 ms to maximum time available in one heartbeat. bSSFP T2 acquired three images using T2 preparation of 0, 25, 45 ms with four idle heartbeats between imaging. Other common parameters were TR/TE/flip angle 2.1ms/0.97ms/35°, SENSE factor 2. GraSE used nine echo times ranging from 8.8 to 79.6ms, TR 1 heartbeat, EPI factor 7.
Data analysis
Myocardium T1 and T2 of each subject were measured via septal ROI for all techniques. The related slice at the middle slab from the 3D mSAVA scan was selected for comparison with 2D sequences. Mean, coefficient of variation (standard deviation divided by mean), the absolute difference of mean, and intraclass correlation coefficient (ICC) were calculated to evaluate the accuracy, precision, and reproducibility of each sequence, respectively. Bland-Altman analyses were performed to evaluate the differences between scans.
RESULTS
All the subjects finished the experiments successfully. The representative T1 and T2 maps from one subject are shown in Figure 2. The image quality of mSAVA was comparable to MOLLI and better than SASHA for T1. T2 maping with mSAVA was comparable to bSSFP T2 and better than GraSE. As shown in Figure 3, mean T1 measured by mSAVA was between MOLLI and SASHA. The coefficient of variation of T1 measured by mSAVA was slightly higher than MOLLI and lower than SASHA. The T1 absolute difference of mSAVA was comparable with MOLLI and lower than SASHA with a higher ICC (0.964 vs. 0.915 vs. 0.698). Mean T2 measured by the three sequences were comparable. T2 coefficient of variation of mSAVA was comparable with bSSFP T2 and lower than GraSE. The T2 absolute difference of mSAVA was lower than GraSE and bSSFP T2 with a higher ICC (0.956 vs. 0.716 vs. 0.662). Details were summarized in Table 1. Bland-Altman analysis showed that the mSAVA had a lower variance than 2D sequences for both T1 and T2 measurements (Figure 4).DISCUSSION
For T1 measurements, MOLLI was known to prone to underestimate but very precise, while SASHA was accurate but less precise (10,11). The results indicated that the accuracy of mSAVA was between MOLLI and SASHA. The precision and reproducibility of mSAVA were comparable to MOLLI. For T2 measurements, the accuracy of the three sequences were comparable, while mSAVA performed better on precision and reproducibility than both GraSE and bSSFP T2. The good performance made mSAVA promising in clinical application.CONCLUSION
mSAVA performed with good accuracy, precision and reproducibility for simultaneous whole heart T1 and T2 mapping.Acknowledgements
No acknowledgement found.References
1. Karamitsos TD, Arvanitaki A, Karvounis H, Neubauer S, Ferreira VM. Myocardial Tissue Characterization and Fibrosis by Imaging. J Am Coll Cardiol Img 2020;13:1221–1234 doi: 10.1016/j.jcmg.2019.06.030.
2. Guo R, Weingärtner S, Šiurytė P, et al. Emerging Techniques in Cardiac Magnetic Resonance Imaging. J. Magn. Reson. Imaging 2022;55:1043–1059 doi: 10.1002/jmri.27848.
3. Messroghli DR, Moon JC, Ferreira VM, et al. Clinical recommendations for cardiovascular magnetic resonance mapping of T1, T2, T2 and extracellular volume: A consensus statement by the Society for Cardiovascular Magnetic Resonance (SCMR) endorsed by the European Association for Cardiovascular Imagin. J. Cardiovasc. Magn. Reson. 2017;19:1–24 doi: 10.1186/s12968-017-0389-8.
4. Messroghli DR, Radjenovic A, Kozerke S, Higgins DM, Sivananthan MU, Ridgway JP. Modified Look-Locker inversion recovery (MOLLI) for high-resolutionT1 mapping of the heart. Magn. Reson. Med. 2004;52:141–146 doi: 10.1002/mrm.20110.
5. Chow K, Flewitt JA, Green JD, Pagano JJ, Friedrich MG, Thompson RB. Saturation recovery single-shot acquisition (SASHA) for myocardial T 1 mapping. Magn. Reson. Med. 2014;71:2082–2095 doi: 10.1002/mrm.24878.
6. Sprinkart AM, Luetkens JA, Träber F, et al. Gradient Spin Echo (GraSE) imaging for fast myocardial T2 mapping. J. Cardiovasc. Magn. Reson. 2015;17:12 doi: 10.1186/s12968-015-0127-z.
7. Giri S, Chung Y-C, Merchant A, et al. T2 quantification for improved detection of myocardial edema. J. Cardiovasc. Magn. Reson. 2009;11:56 doi: 10.1186/1532-429X-11-56.
8. Si D, Guo R, Liu B, Herzka DA, Ding H. 3D free-breathing simultaneous whole heart T 1 and T 2 mapping based on SAturation Recovery and Variable flip Angle ( SAVA ). In Proceedings of the 30th Annual Meeting of ISMRM 2022.
9. Guo R, Si D, Chen Z, et al. SAturation‐recovery and Variable‐flip‐Angle–based three‐dimensional free‐breathing cardiovascular magnetic resonance T 1 mapping at 3 T. NMR Biomed. 2022;35:e4755 doi: 10.1002/nbm.4755.
10. Kellman P, Hansen MS. T1-mapping in the heart: accuracy and precision. J. Cardiovasc. Magn. Reson. 2014;16:2 doi: 10.1186/1532-429X-16-2.
11. Roujol S, Weingärtner S, Foppa M, et al. Accuracy, Precision, and Reproducibility of Four T1 Mapping Sequences: A Head-to-Head Comparison of MOLLI, ShMOLLI, SASHA, and SAPPHIRE. Radiology 2014;272:683–689 doi: 10.1148/radiol.14140296.
Figures
Figure 2. Representative T1 and T2 maps of a normal human subject acquired by mSAVA, MOLLI, SASHA, GraSE and bSSFP T2 in the two scans.
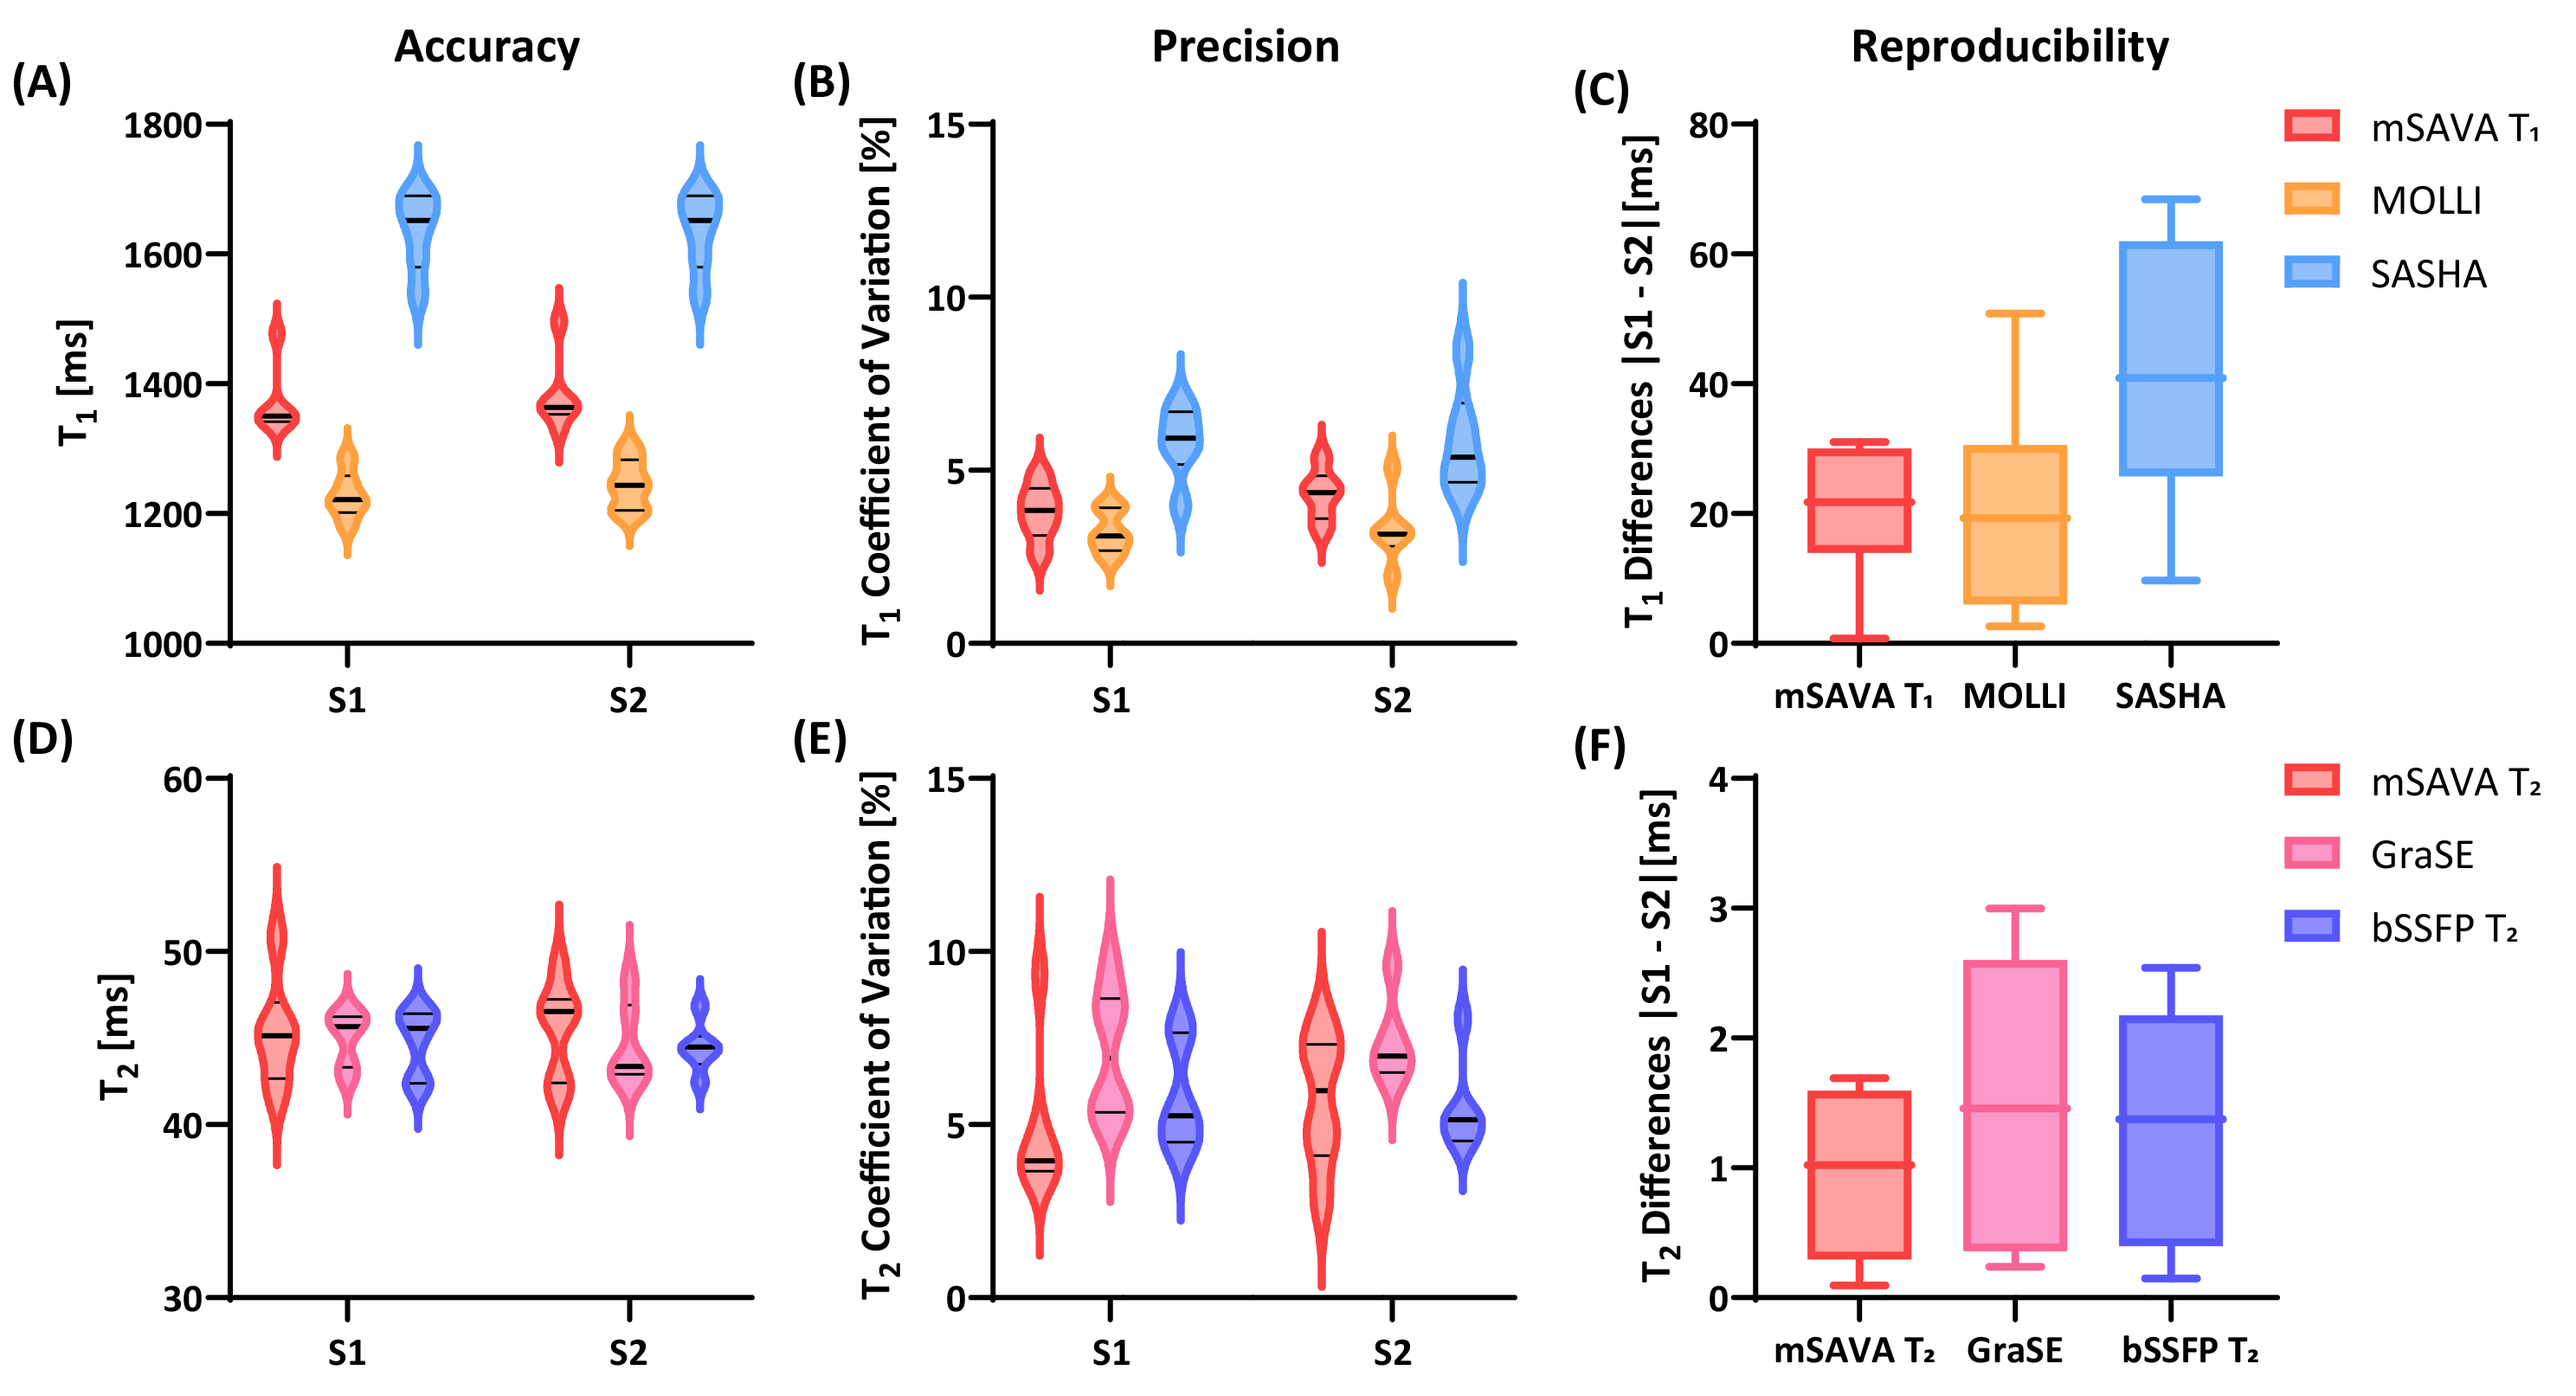
Figure 3. Mean value, coefficient of variation and the absolute difference of T1 (A-C) and T2 (D-F) measured by different sequences in the two scans. S1: Scan #1, S2: Scan #2.