1429
3D whole-heart joint T1/T1ρ/T2 mapping and water-fat imaging for contrast-agent free myocardial tissue characterization at 1.5T1School of Biomedical Engineering and Imaging Sciences, King's College London, London, United Kingdom, 2MR Research Collaborations, Siemens Healthcare Limited, Camberley, United Kingdom, 3Institute for Biological and Medical Engineering, Pontificia Universidad Catolica de Chile, Santiago, Chile, 4School of Engineering, Pontificia Universidad Catolica de Chile, Santiago, Chile
Synopsis
Keywords: Myocardium, Tissue Characterization
Native T1 and T1ρ mapping has shown promising results for the detection of focal and diffuse myocardial fibrosis without the need of contrast agents, whereas T2 mapping enables characterisation of inflammation and edema. However, conventional myocardial maps are acquired in sequential 2D breath-hold scans with limited heart coverage. Here, we propose a novel free-breathing, 3D joint T1/T1ρ/T2 mapping sequence with Dixon encoding to provide whole-heart T1, T1ρ and T2 maps and co-registered water/fat volumes with isotropic spatial resolution for comprehensive contrast-agent free myocardial tissue characterization. Preliminary results demonstrate good agreement with reference values in phantoms and promising results in-vivo.Introduction
Native T1 and T1ρ mapping has shown promising results for the detection of focal and diffuse myocardial fibrosis without the need of contrast agents1,2, whereas there is cumulating evidence of the importance of T2 mapping in quantifying myocardial inflammation and edema3. Furthermore, characterization of fibrofatty infiltration of the myocardium has been shown to be clinically relevant4. However, conventional myocardial maps are acquired in sequential 2D breath-hold scans with limited heart coverage. 3D whole-heart joint mapping sequences may improve accuracy and protocol efficiency, avoid misregistration over sequentially acquired sequences and provide anatomical images for further diagnosis5. Moreover, segmentation and analysis should be greatly simplified and improved as contours can be shared between contrasts. Moving towards this goal, a 3D joint T1/T1ρ mapping sequence for contrast-agent free myocardial tissue characterisation has recently been proposed6. Here, we extend this sequence to additionally provide T2 mapping and propose a novel free-breathing, 3D whole-heart joint T1/T1ρ/T2 mapping sequence with Dixon encoding to provide non-contrast enhanced 3D T1, T1ρ and T2 maps and co-registered water and fat volumes with isotropic resolution for comprehensive myocardial tissue characterization and simultaneous evaluation of the cardiac and coronary anatomy in a single scan of ~7 min.Methods
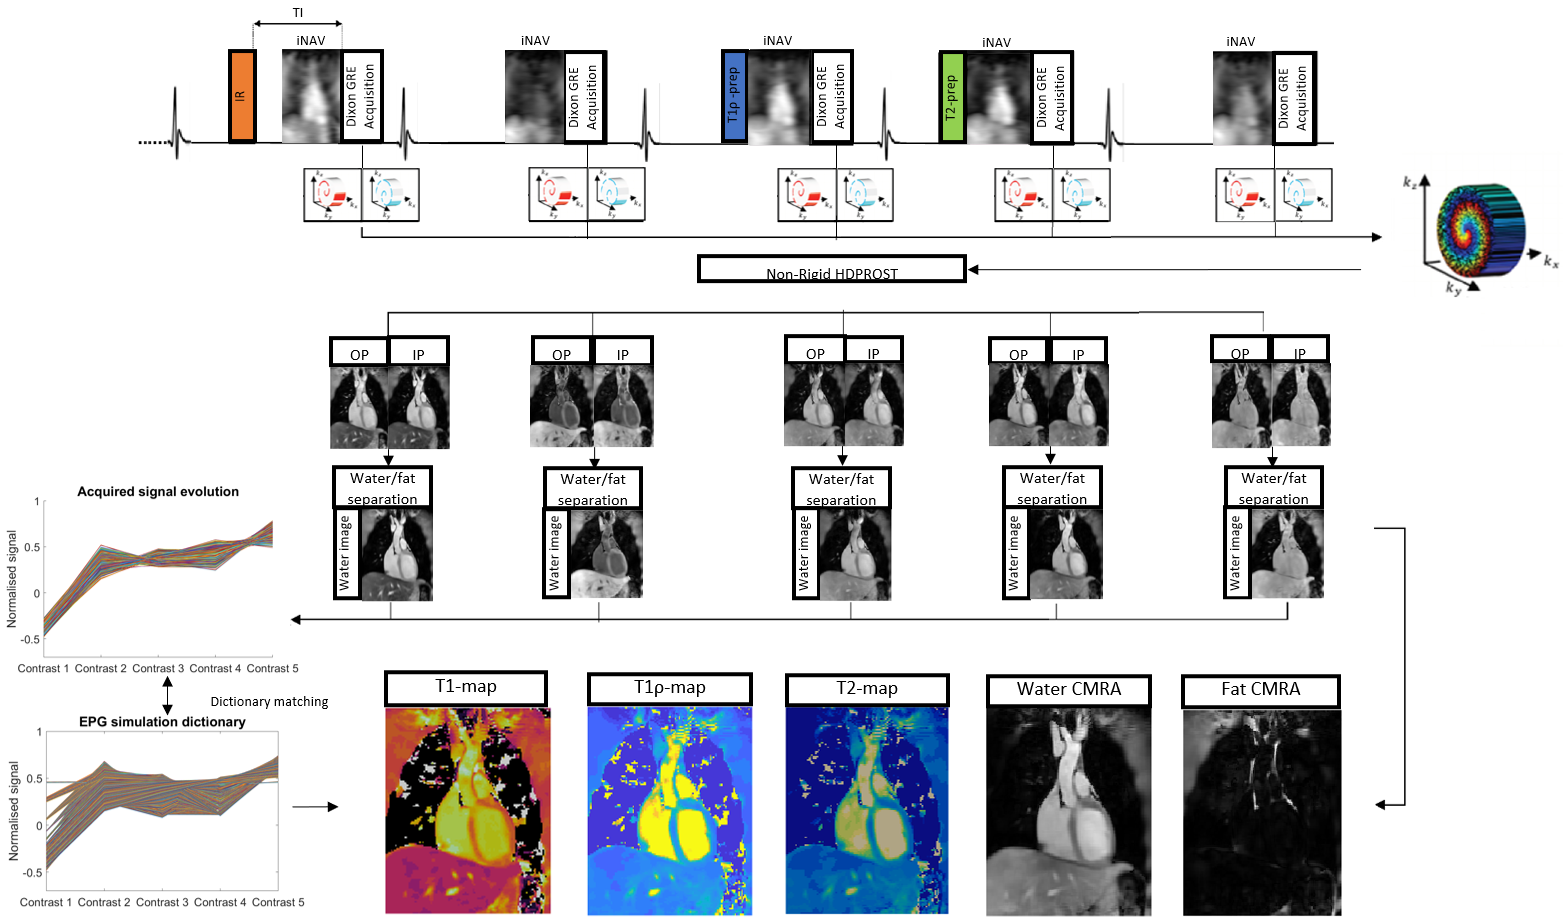
The proposed ECG-triggered 3D joint T1/T1ρ/T2 research sequence (Fig. 1) consists of a repeating set of preparation modules over 5 heartbeats (HBs): IR preparation (TI=250 ms), no preparation, T1ρ preparation (spin-lock duration(TSL)/amplitude(fSL) =40 ms/400 Hz), T2 preparation (duration 40ms), and no preparation. A 2-point bipolar Dixon gradient echo read-out is used (TE1/TE2/TR=2.38/4.76/6.71ms, flip angle=8o, bandwidth=453 Hz/pixel, spatial resolution=2mm isotropic) in every HB. To accelerate the acquisition, a variable-density 3D Cartesian trajectory with spiral profile order (VD-CASPR) and golden angle step7 is used within contrasts, along with a second golden-angle between contrasts, to acquire 6x undersampled data per contrast. 2D image navigators (iNAVs)8 are acquired prior to each spiral interleaf and used to perform beat-to-beat translational Right-Left (RL)/Foot-Head (FH) respiratory motion estimation and correction, as well as to bin the 3D data into 4 respiratory bins for estimation of bin-to-bin 3D non-rigid motion9. The 10 3D image contrasts (out-of-phase (OP) and in-phase (IP) echoes for each HB) are reconstructed using non-rigid motion corrected HD-PROST, with patch-based multi-dimensional low-rank regularisation10. Water and fat HB images are subsequently estimated from the reconstructed IP/OP HB images11. An EPG simulation12 of the sequence was implemented using the mean RR interval and acquisition window per subject yielding a dictionary with Np~37.3k T1/T2/T1ρ parameter combinations (constrained to satisfy T1ρ≥T2). Dictionary matching was performed by maximising the inner-product of the dictionary and water HB images computed voxel-by-voxel.Data was acquired on a 1.5T MR scanner (MAGNETOM Aera, Siemens Healthcare, Erlangen, Germany) with an 18-channel body coil and 32-channel spine coil on phantoms with varying simulated heart rate (HR) and on 5 healthy subjects in comparison to conventional mapping techniques.
Results
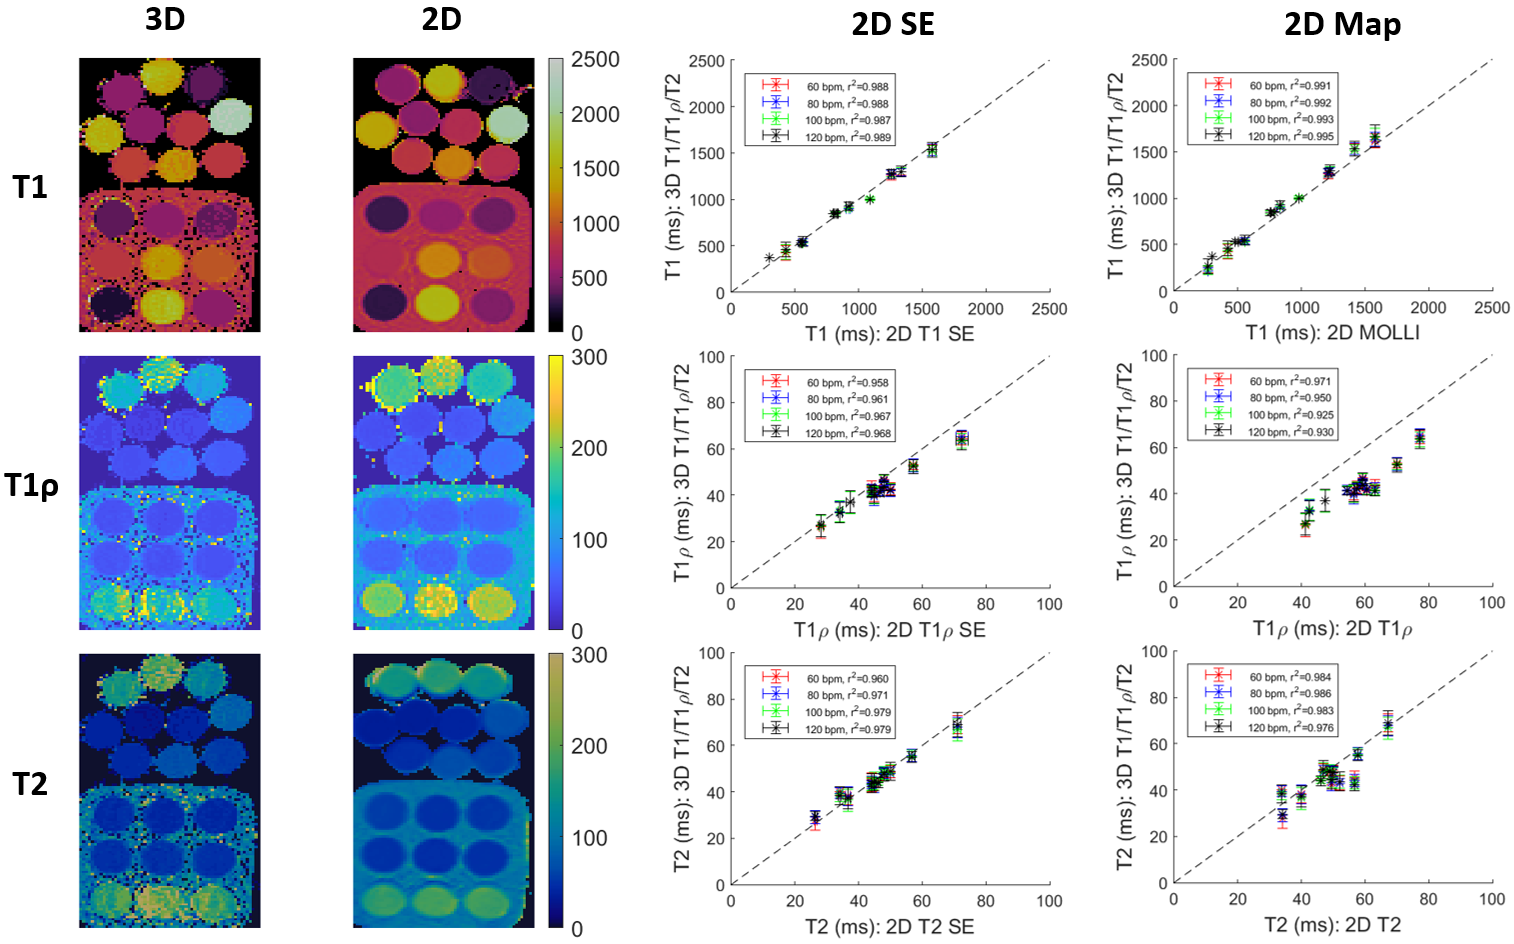
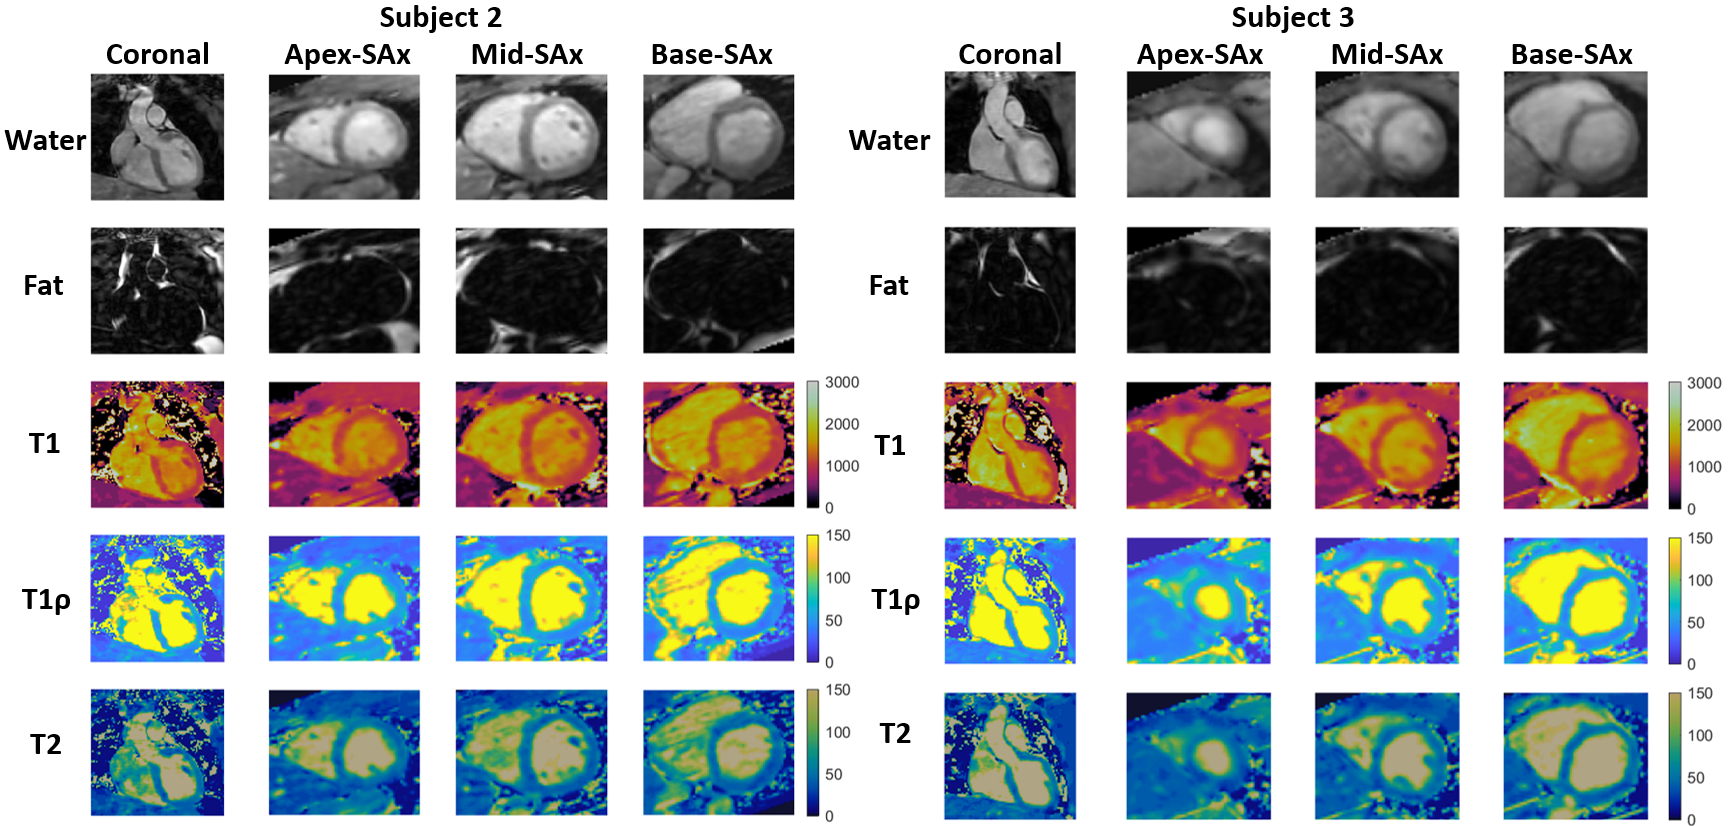
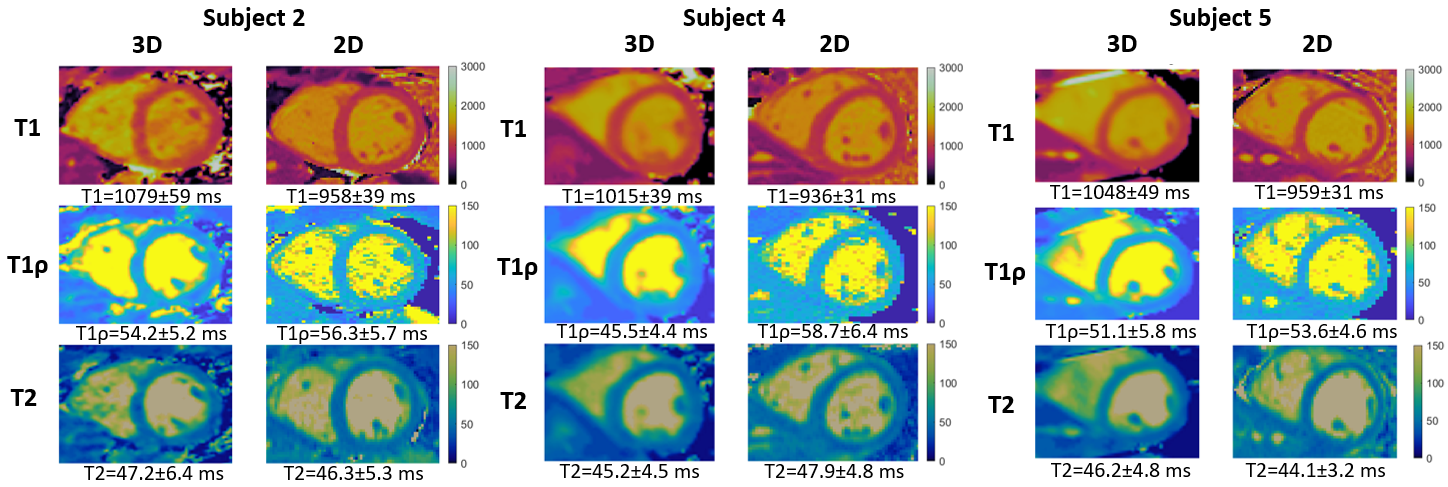
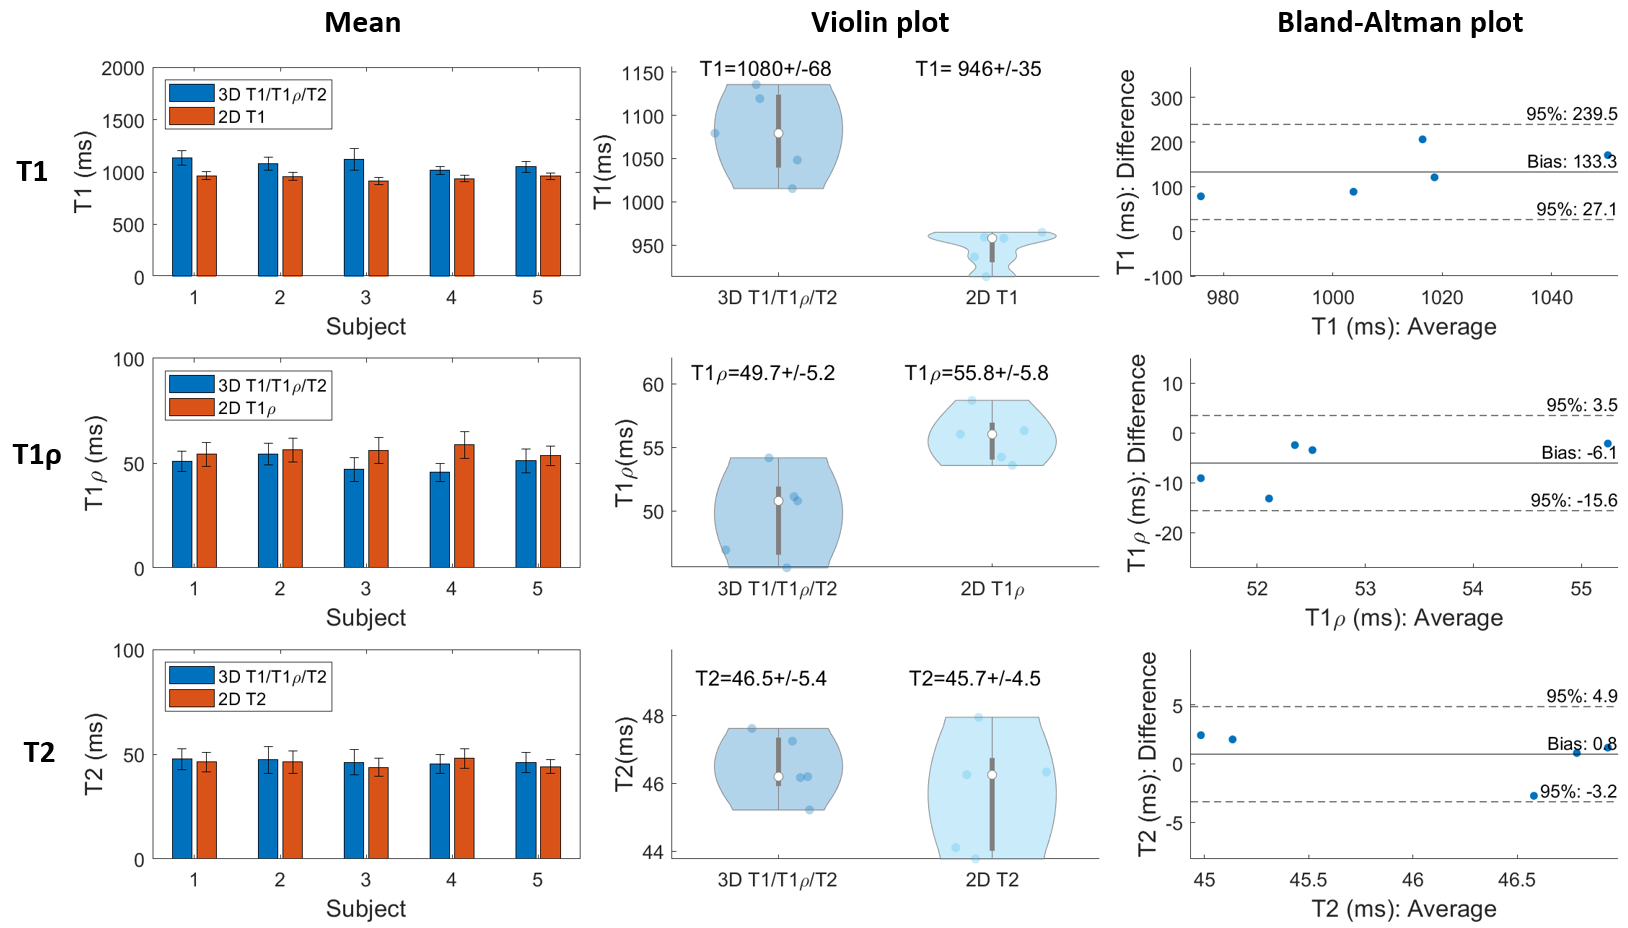
Phantom experiments show good agreement between estimated T1, T1ρ and T2 values and those from 2D spin-echo (SE) measurements, 2D MOLLI13, 2D T1ρ14 and 2D T23 over the range of T1, T1ρ and T2 values typical for myocardium, blood, and scar values (Fig. 2). In-vivo experiments on 5 healthy subjects (HR=65+/-9 bpm) with an acquisition window (124+/-16 ms) chosen at mid-diastole resulted in a total scan-time of 7.3+/-0.8 mins. Different views of the 3D volume of Water (4th HB), Fat (4th HB), T1, T1ρ and T2 maps in 2 representative subjects are shown in Fig. 3. Mid-ventricular short-axis (SAX) views of the proposed 3D T1/T1ρ/T2 maps, 2D MOLLI, 2D T1ρ and 2D T2 for 3 subjects are shown in Fig. 4. For all subjects, the myocardium of a mid-SAX slice was segmented for the proposed 3D T1/T1ρ/T2 mapping, as well as 2D MOLLI, 2D T1ρ and 2D T2 reference sequences. Fig. 5 illustrates a comparison of mid-SAX septal myocardium values between the proposed and reference sequences across all healthy subjects. For T1, mean septal values for the proposed 3D T1/T1ρ/T2 sequence (1080±68 ms) are higher than for 2D MOLLI (946±35 ms). This bias could be explained by the known underestimation of T1 by MOLLI15. For T1ρ, mean septal values across subjects for the proposed 3D T1/T1ρ/T2 sequence (49.7±5.2 ms) are lower than 2D T1ρ (55.8±5.8 ms). For T2, mean septal values for the proposed 3D T1/T1ρ/T2 sequence (46.5±5.4 ms) are similar to 2D T2 (45.7±4.5 ms).Conclusions
Preliminary 3D joint T1/T1ρ/T2 mapping and water-fat imaging results demonstrate good agreement with reference values in phantoms and promising results in-vivo. Further work will include acquisition of a larger cohort of healthy subjects, as well as patients with suspected cardiovascular disease.Acknowledgements
This work was supported by the following grants: (1) EPSRC P/V044087/1; (2) BHF programme grant RG/20/1/34802, (3) Wellcome/EPSRC Centre for Medical Engineering (WT 203148/Z/16/Z), (4) Millennium Institute for Intelligent Healthcare Engineering ICN2021_004, (5) FONDECYT 1210637 and 1210638, (6) IMPACT, Center of Interventional Medicine for Precision and Advanced Cellular Therapy, ANID FB210024.References
1. Witschey W R T, Zsido G A, Koomalsingh K, et al. In vivo chronic myocardial infarction characterization by spin locked cardiovascular magnetic resonance. J Cardiovasc Magn Reson. 2012;14(1):37.
2. Liu X. et al. Native T1 mapping for characterization of acute and chronic myocardial infarction in swine: Comparison with contrast-enhanced MRI. J Magn Reson Imaging. 2018; 47(5):1406-1414
3. Giri S, Chung Y-X, Merchant A et al. T2 quantification for improved detection of myocardial edema. J Cardiovasc Magn Reson. 2009;11:56.
4. Kellman P, Hernando D, Shah S, et al. Multiecho dixon fat and water separation method for detecting fibrofatty infiltration in the myocardium. Magn Reson Med. 2008;61(1):215-221.
5. Milotta G, Bustin A, Jaubert O, et al. 3D whole-heart isotropic-resolution motion-compensated joint T1/T2 mapping and water/fat imaging. Magn Reson Med. 2020;84:3009-3026.
6. Crabb M G, Kunze K P, Velasco C et al. 3D joint T1/T1ρ mapping and water-fat imaging for contrast-agent free myocardial tissue characterisation Proc. ISMRM-ESMRMB & SMRT Annual Meeting, Program No.: 1004, 2022.
7. Prieto C, Doneva M, Usman M, et al. Highly efficient respiratory motion compensated free-breathing coronary MRA using golden-step Cartesian acquisition. J Magn Reson Imaging. 2015;41(3):738–746.
8. Henningsson M, Koken P, Stehning C, et al. Whole-heart coronary MR angiography with 2D self-navigated image reconstruction. Magn Reson Med. 2012;67(2):437–445.
9. Cruz G, Atkinson D, Henningsson M, et al. Highly efficient nonrigid motion-corrected 3D whole-heart coronary vessel wall imaging. Magn Reson Med. 2017;77(5):1894-1908.
10. Bustin A, Cruz G, Jaubert O, et al. High-dimensionality undersampled patch-based reconstruction (HD-PROST) for accelerated multi-contrast MRI. Magn Reson Med. 2019;81(6):3705-3719.
11. Liu J, Peters D C, Drangova M. Method of B0 mapping with magnitude-based correction for bipolar two-point Dixon cardiac MRI. Magn Reson Med. 2016;78(5):1862-1869.
12. Weigel M. Extended phase graphs: Dephasing, RF pulses, and echoes – Pure and simple. J Magn Reson Imaging. 2015;41(2):266-295.
13. Messroghli D R, Radjenovic A, Kozerke A, et al. Modified Look-Locker Inversion Recovery (MOLLI) for High-Resolution T1 Mapping of the Heart. Magn Reson Med. 2004;52(1):141-146.
14. Qi H, Bustin A, Kuestner T, et al. Respiratory motion-compensated high-resolution 3D whole-heart T1ρ mapping. J Cardiovasc Magn Reson. 2020;22:12.
15. Kellman P, Hansen M S. T1-mapping in the heart: Accuracy and precision. J Cardiovasc Magn Reson. 2014;16(2)
Figures