1426
An Optimized RF Coil for Sensitive 31P Magnetic Resonance Spectroscopic Imaging of the Human Brain and Cerebellum at 7T.1Department of Biomedical Engineering, McGill University, Montreal, QC, Canada, 2McConnell Brain Imaging Centre, Montreal Neurological Institute and Hospital, Montreal, QC, Canada, 3Department of Neurology and Neurosurgery, McGill University, Montreal, QC, Canada, 4Siemens Healthcare Limited, Montreal, QC, Canada
Synopsis
Keywords: High-Field MRI, RF Arrays & Systems
An optimized RF coil was constructed for 7T, Phosphorus (31P) Magnetic Resonance Spectroscopic Imaging (MRSI) of the whole brain including the cerebellum. The cerebellum is a region not well covered by most existing 31P coils. The design consisted of an optimized 16-rung high-pass birdcage transmit coil and a 24-channel phased array receive coil affixed to a custom head-shaped former. The coil provided high sensitivity to 31P signals across the whole brain and brainstem. In vivo 31P 3D CSI experiments showed high quality spectra with regional PCr SNR values near the cerebellum comparable to values near the brain centre.Introduction
Phosphorus(31P) Magnetic Resonance Spectroscopic Imaging (MRSI) provides a non-invasive means of quantifying cerebral energetics in the human brain1,2. Here we present a novel 31P coil with an optimized birdcage transmit design and conformal, phased array receive design for high quality, whole-brain 7T MRSI. The coil offers complete coverage of the brain including the cerebellum and brainstem – regions not well covered by most existing 31P coils3–5.Methods
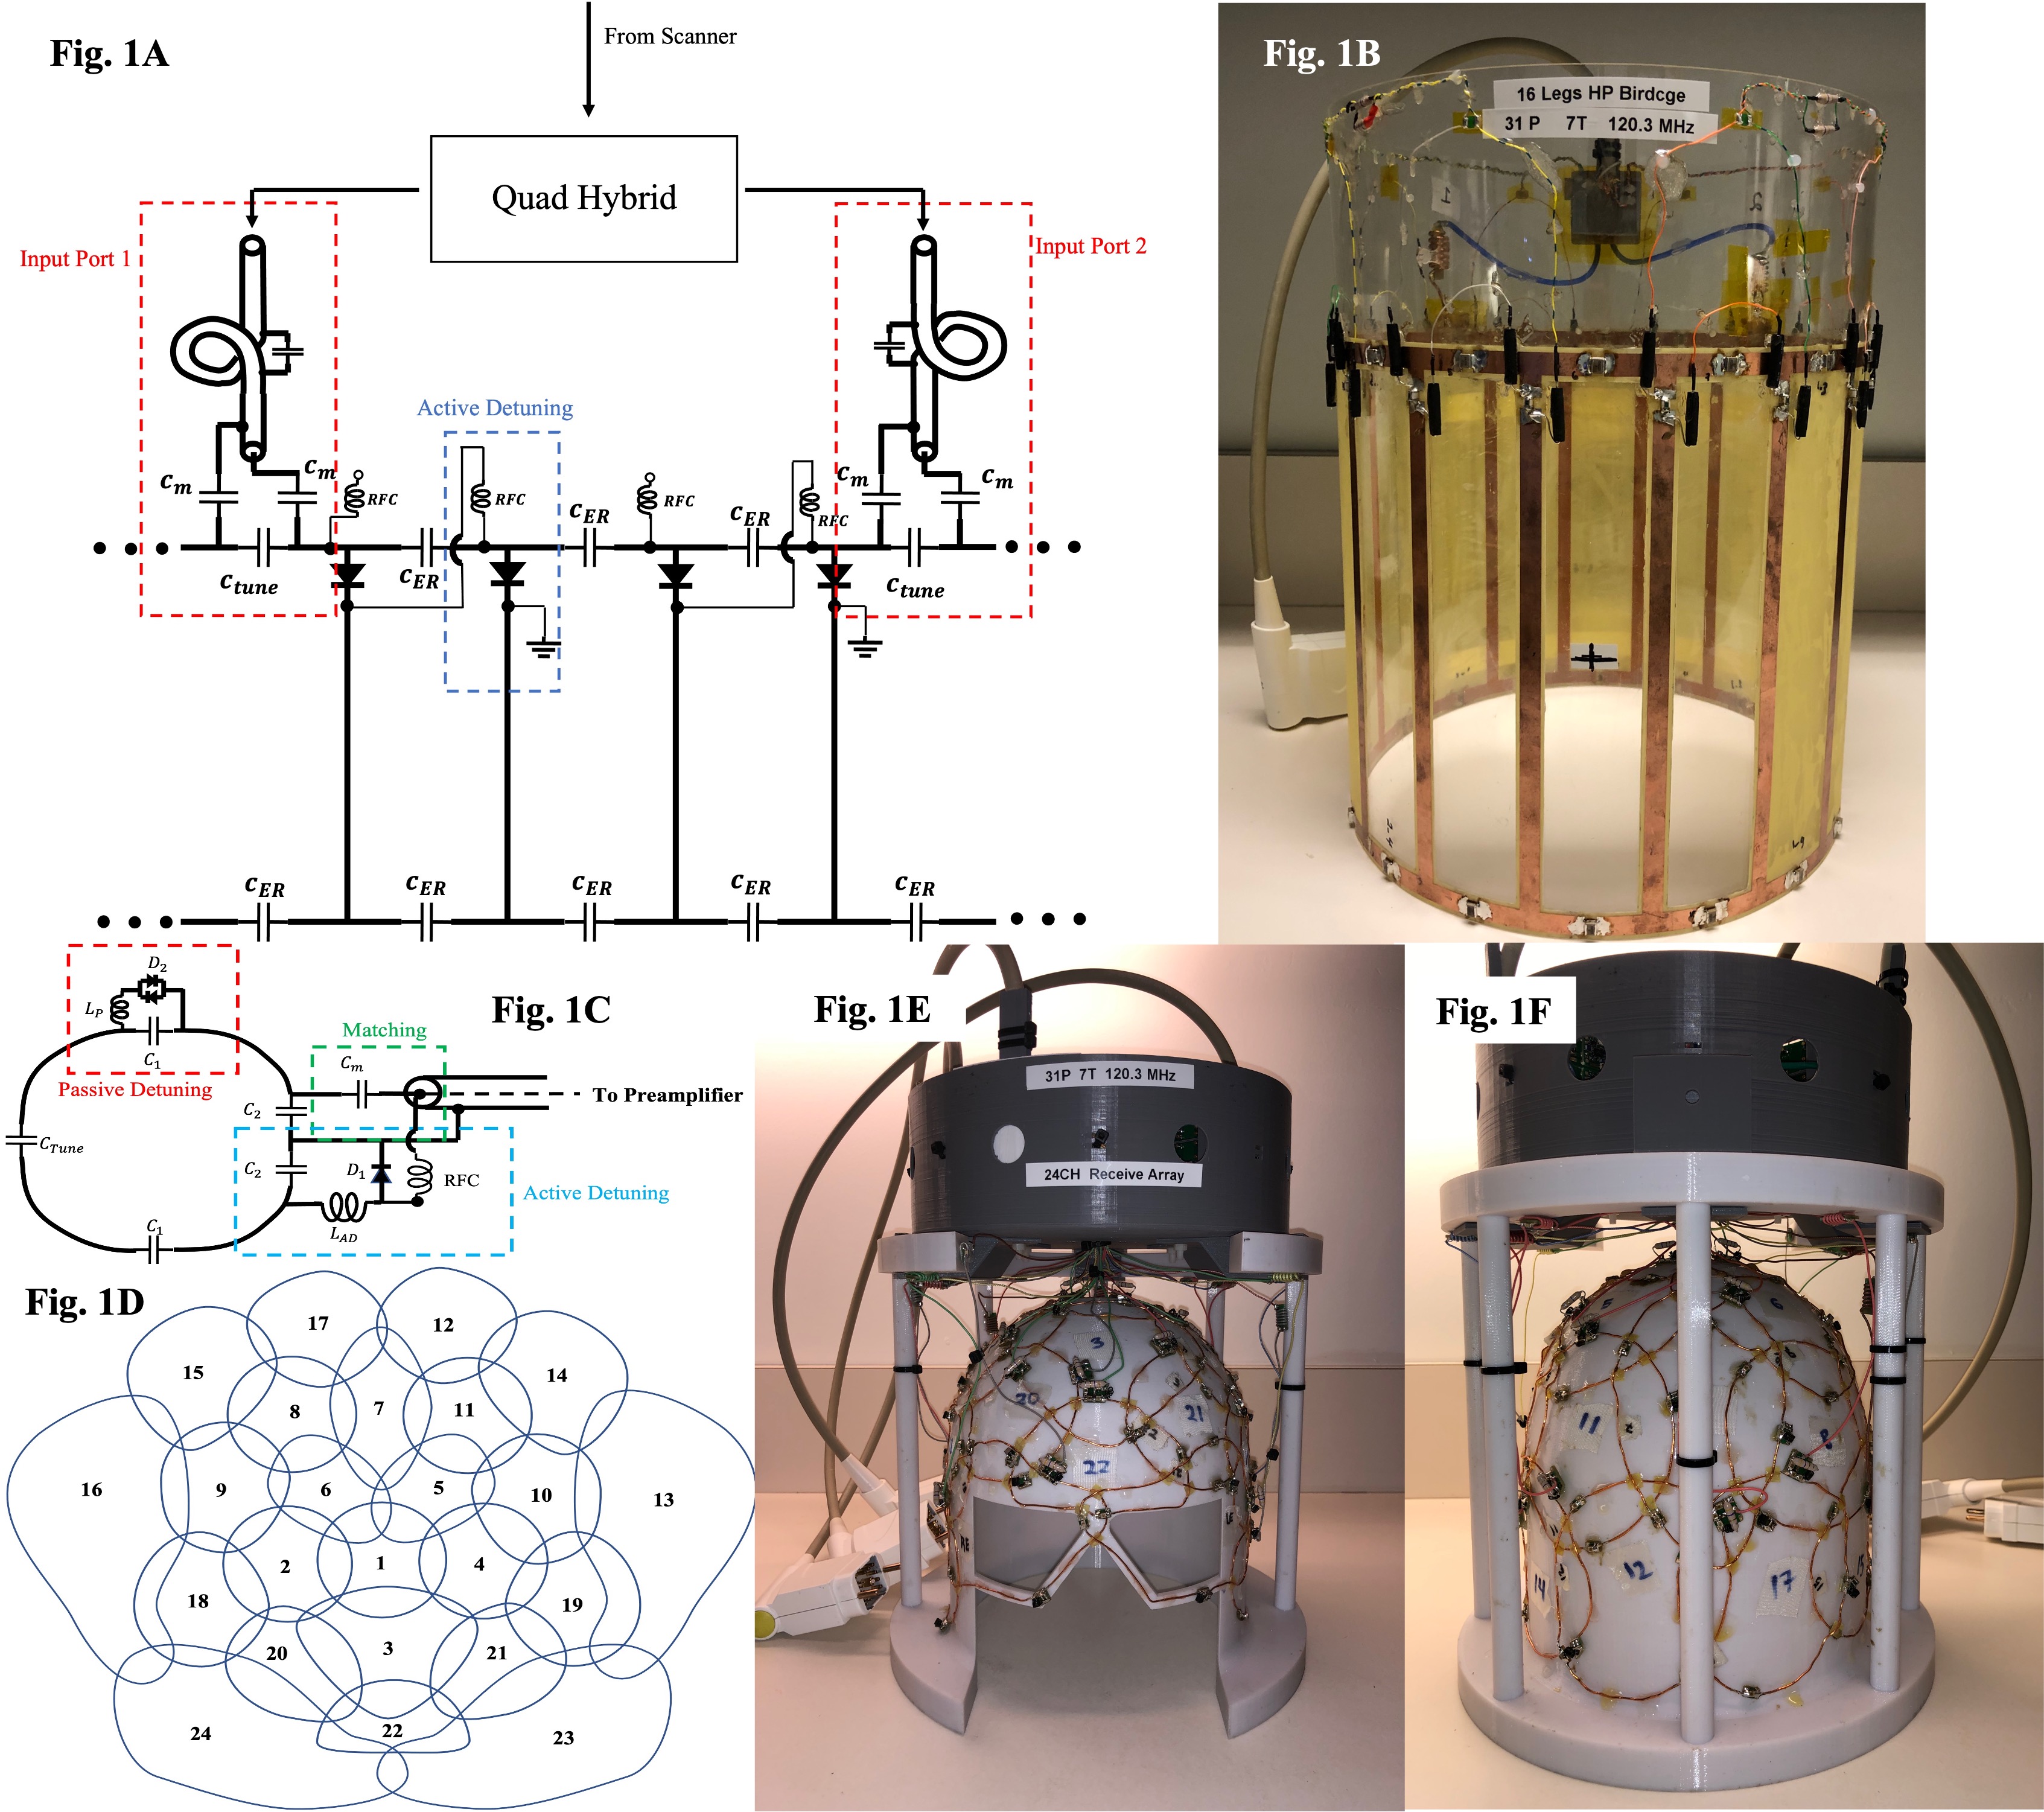
Coil Design: The 31P coil consists of an actively detunable volume transmit(Tx) resonator and 24-channel receive(Rx) array. The volume resonator was designed as a 16-rung, high-pass birdcage(BC) with a 30cm inner diameter and 26cm length. The length and inner diameter of the BC coil allow uniform excitation of 31P signals in the human brain, cerebellum, and brainstem. The BC legs include PIN-diodes to actively detune the BC coil during signal acquisition. Two high power cable traps were used between the quadrature hybrid and each BC port to attenuate common-mode currents.The Rx coil consisted of a 24-element phased array6 with varying loop shapes and sizes (8.5-12.5cm diameter), built onto a 3D printed adult head former (Figure 1). The Rx loops were arranged to provide coverage extending from the top of the head, around the eyes and down to the base of the head. Each Rx loop was built with an active and passive detuning circuit for effective detuning during excitation. Cable traps were included before and after each preamplifier to attenuate common-mode currents.
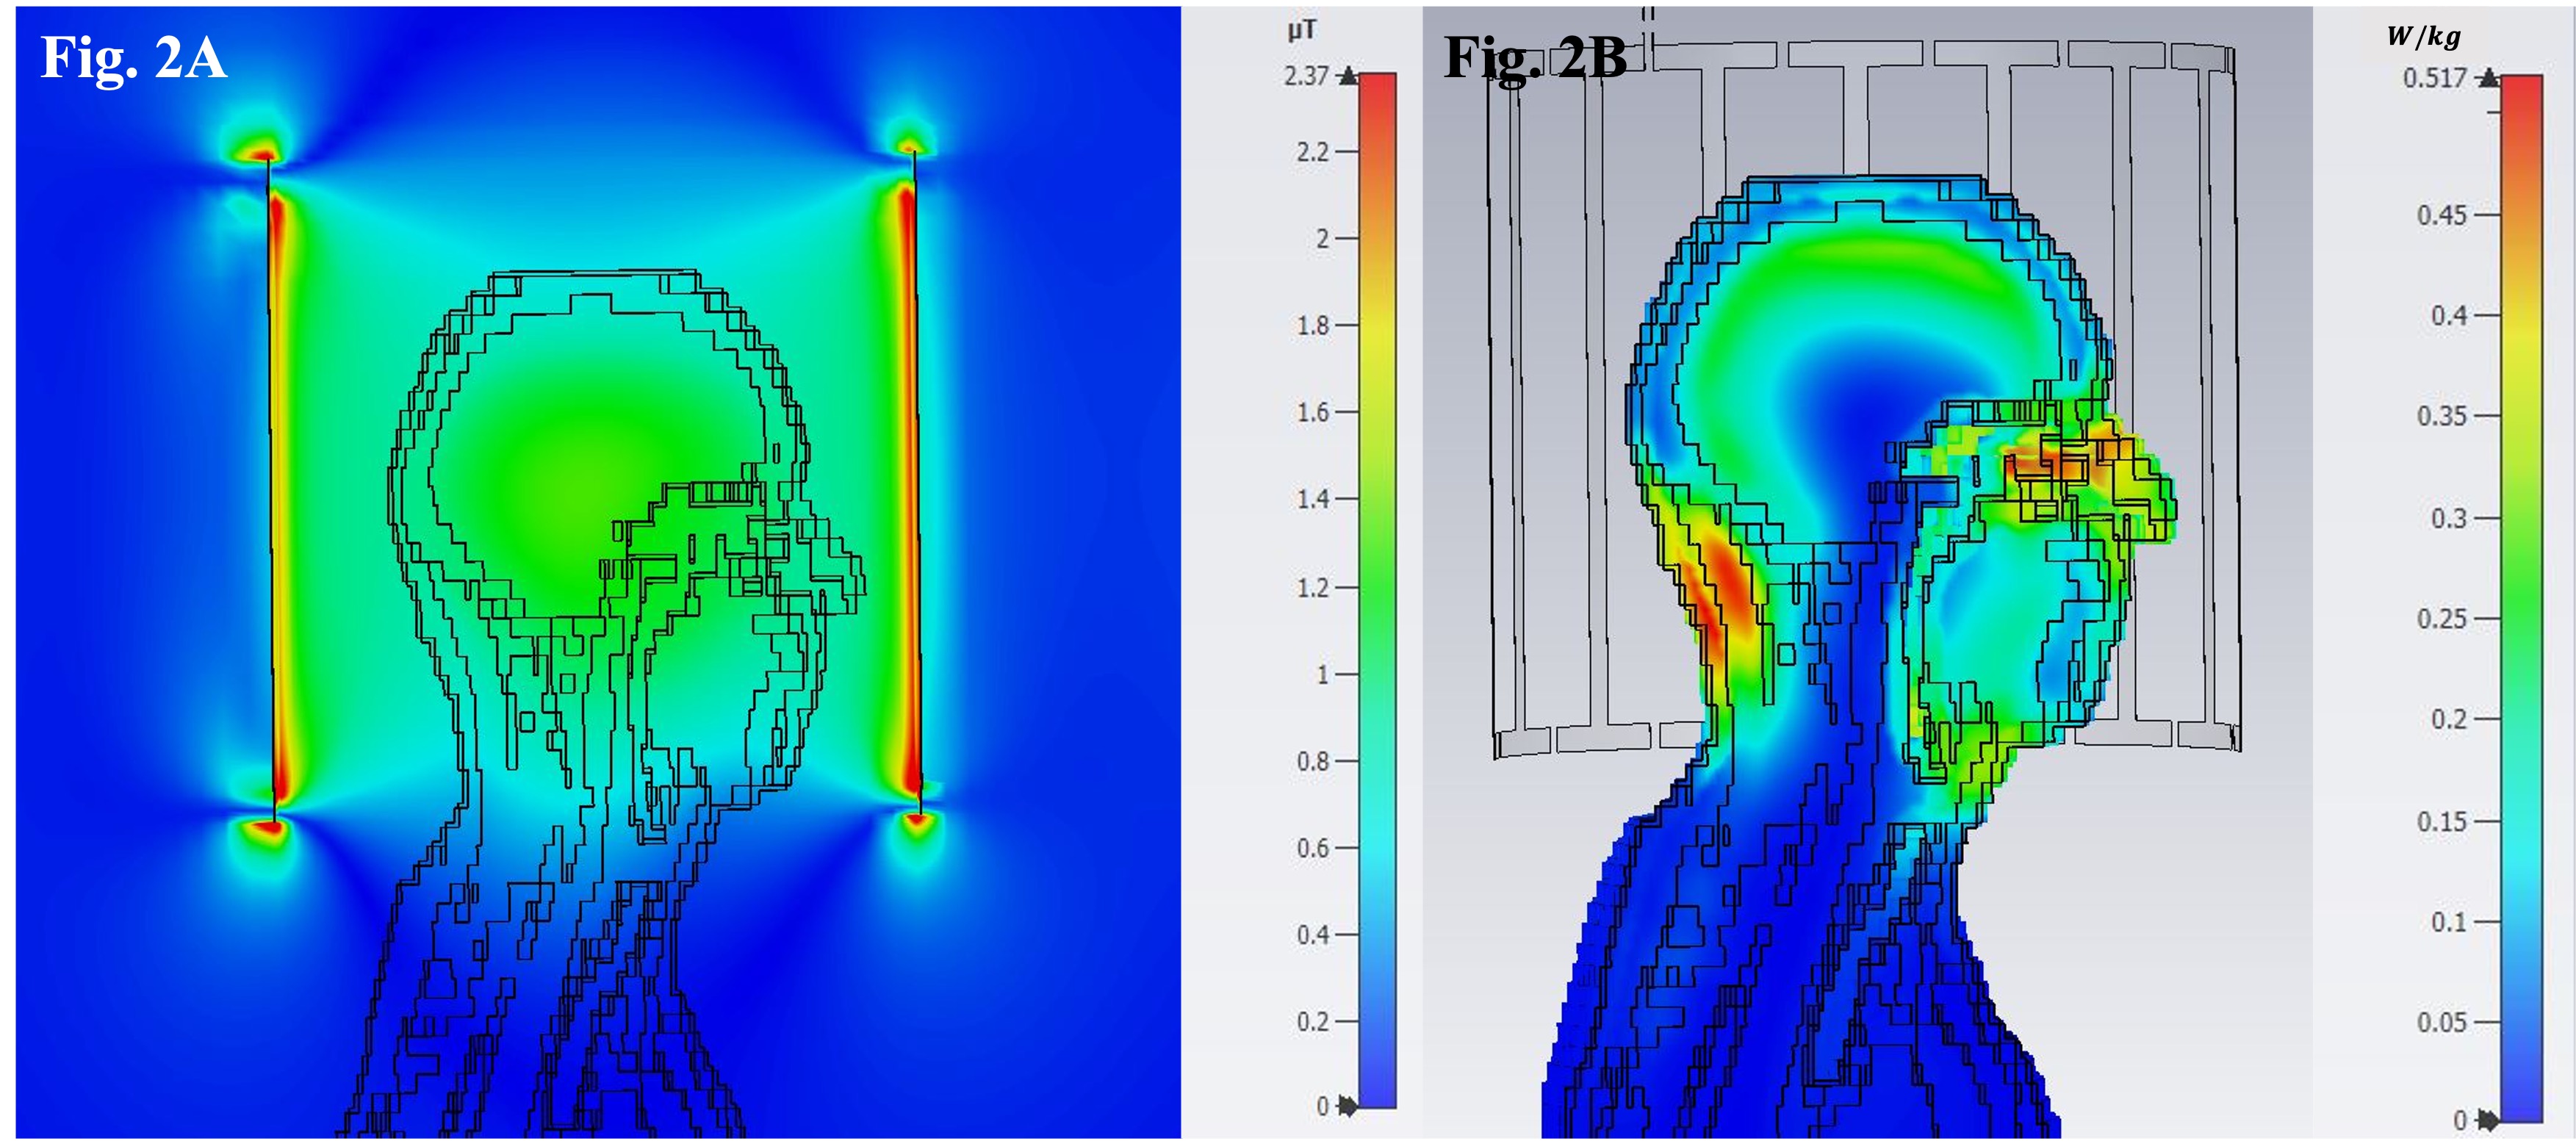
Numerical Simulations: The birdcage coil was simulated using CST Microwave Studio (CST Studio Suite, Darmstadt, Germany) with the “Gustav” voxel model. B1+ efficiency and 10g averaged SAR were calculated to assess coil performance.
Bench Optimization: The birdcage coil (Figure 1:A,B) was tuned with the goal of preserving a homogeneous, circularly-polarized excitation field7,8. Coil symmetry was maintained using closely valued end-ring capacitors and identical tune capacitors at the birdcage ports.
The receive array (Figure 1:C-F) was constructed to achieve geometric decoupling of adjacent loop elements6. Next-nearest and distant neighbours were further decoupled using preamplifier decoupling6,9. BC tuning was assessed in the presence of the receive array in a detuned state to ensure minimal influence on the birdcage coil’s resonant frequency. All loaded measurements were conducted with a human head and a 31P phantom (30mM KH2PO4, 3.5% Agar) prepared in-house.
In Vivo Experiments: All imaging experiments were conducted using a 7T whole-body MRI system (MAGNETOM Terra, Siemens Healthineers). Conservative safety factors were determined from CST-based SAR simulations. For in vivo imaging, a male volunteer (24yrs of age) was first imaged using a 1-channel Tx, 32-channel Rx Nova 1H head coil (Nova Medical, MA, USA). A T1-weighted, 1H MP2RAGE anatomical scan was acquired with 0.7mm3 spatial resolution for spatial localization. As part of the 1H acquisition, B0 shimming was conducted and optimal shim coefficients were calculated. Using the shim coefficients, a whole-brain 3D 31P CSI FID was then acquired using the 31P coil. From the resulting spectra, PCr SNR maps were generated. A noise scan was also collected to quantify noise correlation across all receive channels. Channel combination was implemented offline using the time domain “Weighted by First Point”10 method. All processing and analysis was implemented with the Python-based, Suspect library (https://github.com/openmrslab/suspect).
Results
Simulation: The mean B1+ efficiency calculated across the “Gustav” brain model was 1.07±0.13 uT/√W and the B1+ efficiency at the centre of the brain was 1.3 uT/√W supporting the uniformity and efficiency of the B1+ excitation. The [maximum SAR10g]/[accepted power] was [0.68 W/kg]/ [0.87 W]. The B1+ field and SAR along a central sagittal plane of the “Gustav” model are illustrated in Figure 2.Bench and Scanner Performance: The BC coil was well matched with a reflection coefficient (S11) of -18dB for each port and a transmission coefficient (S21) of -19dB when loaded with a human head. The ratio of unloaded-to-loaded (loaded with 31P phantom) quality factors (Qu/QL) was 1.72. The active detuning of the Tx coil was -20 dB when measured with a decoupled dual-loop pickup probe.
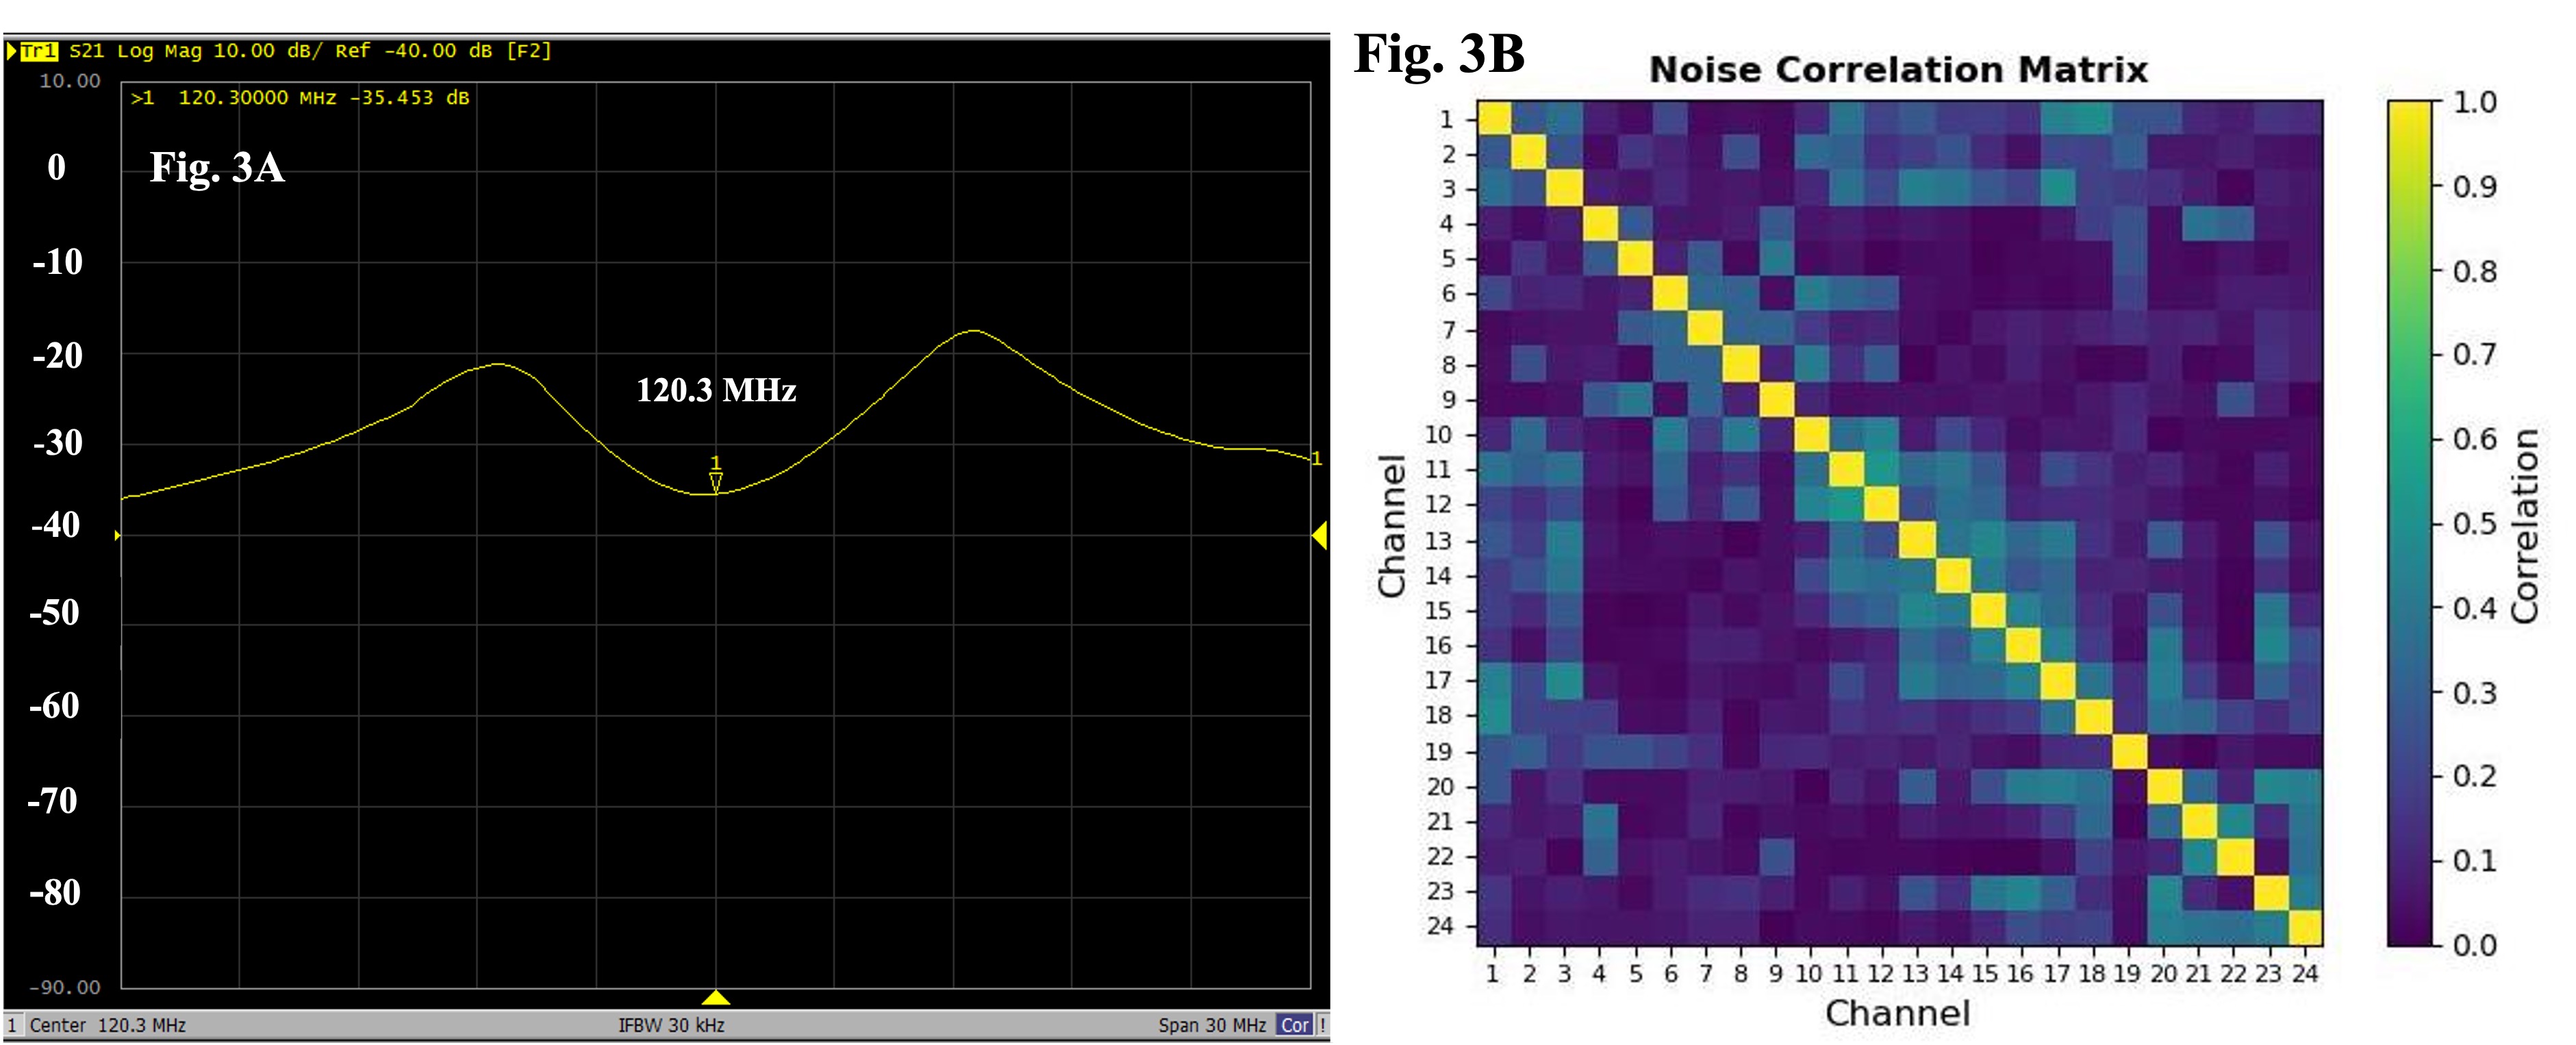
The 24 receive loops had S11 values between -17dB and -30dB and S21 values between -7dB and -23dB when loaded with a human head. The Q-ratio (Qu/QL) of the Rx elements varied from 1.3 to 1.6. The active detuning of all receive elements was between 10dB and 19dB.
Figure 3 shows preamplifier decoupling for one receive element and the noise correlation matrix of the receive array. The mean noise correlation was 15% with a maximum value of 53% between elements 20 and 24.
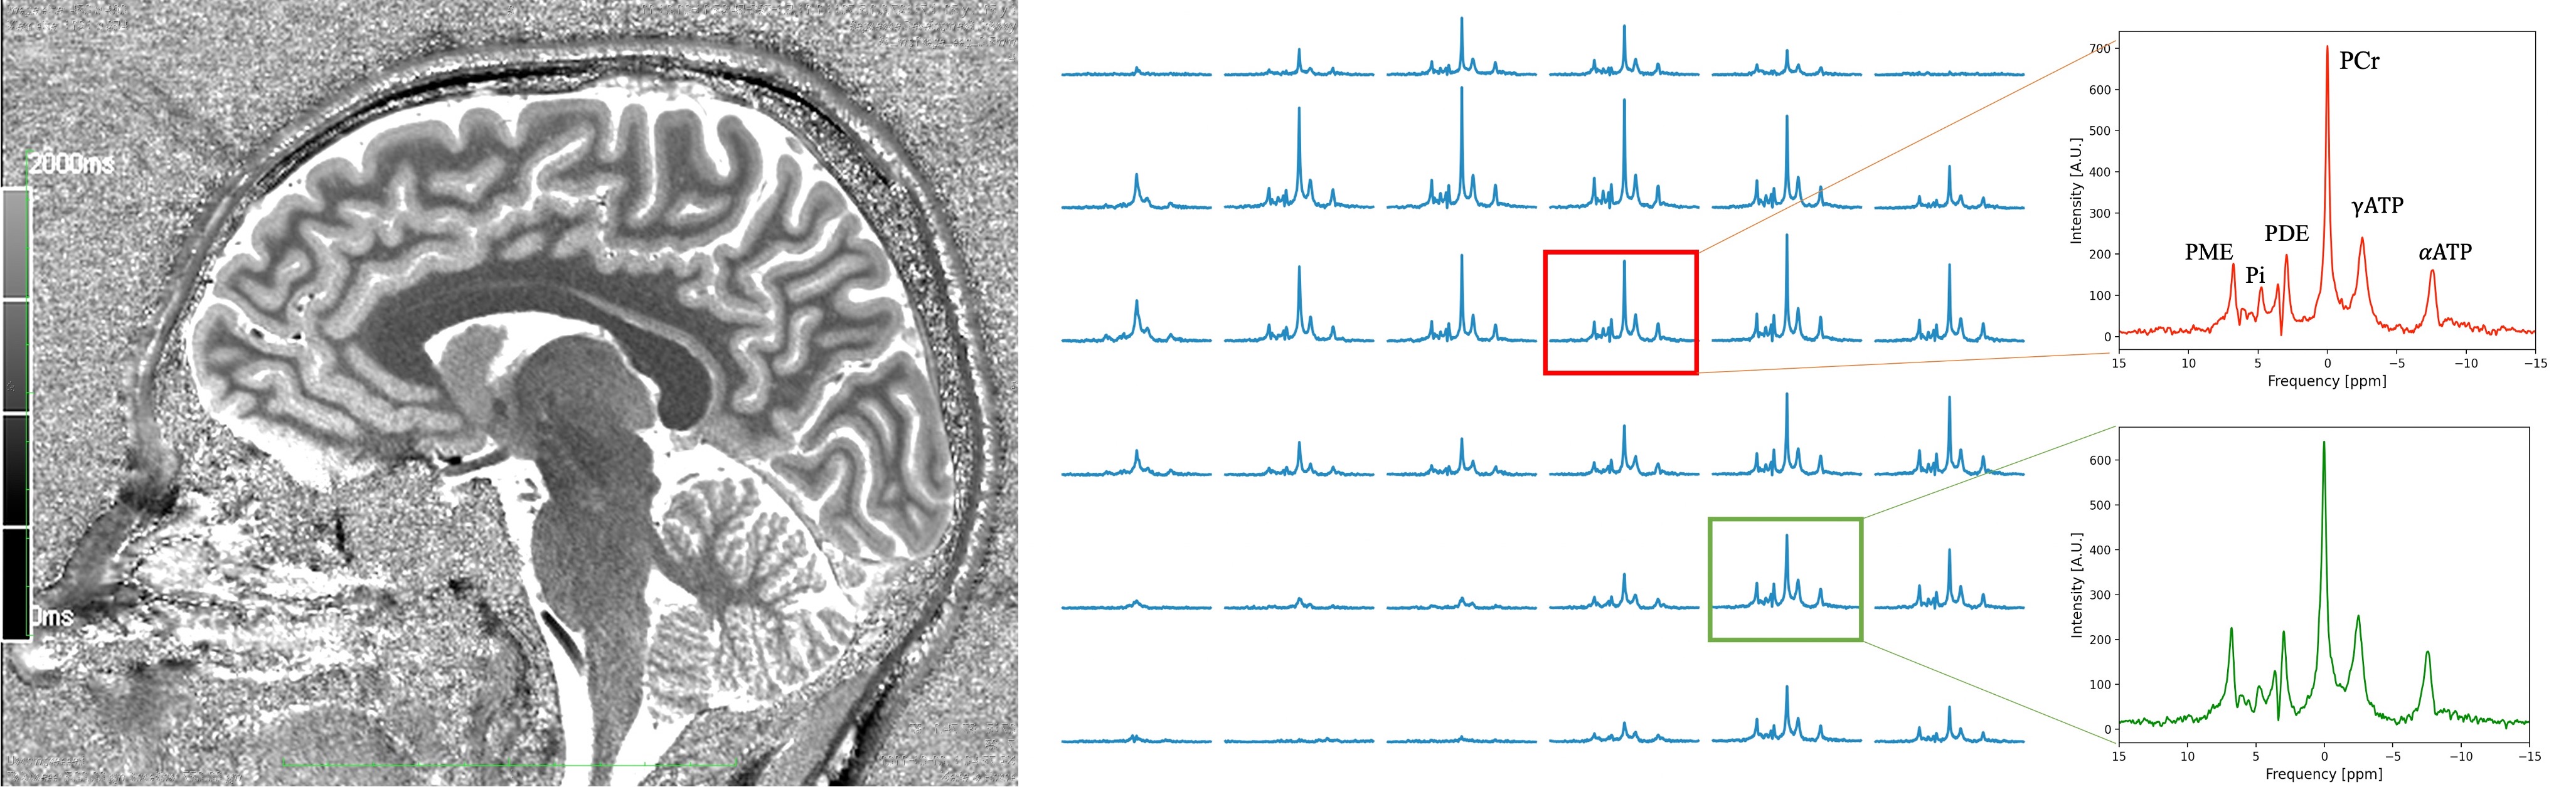
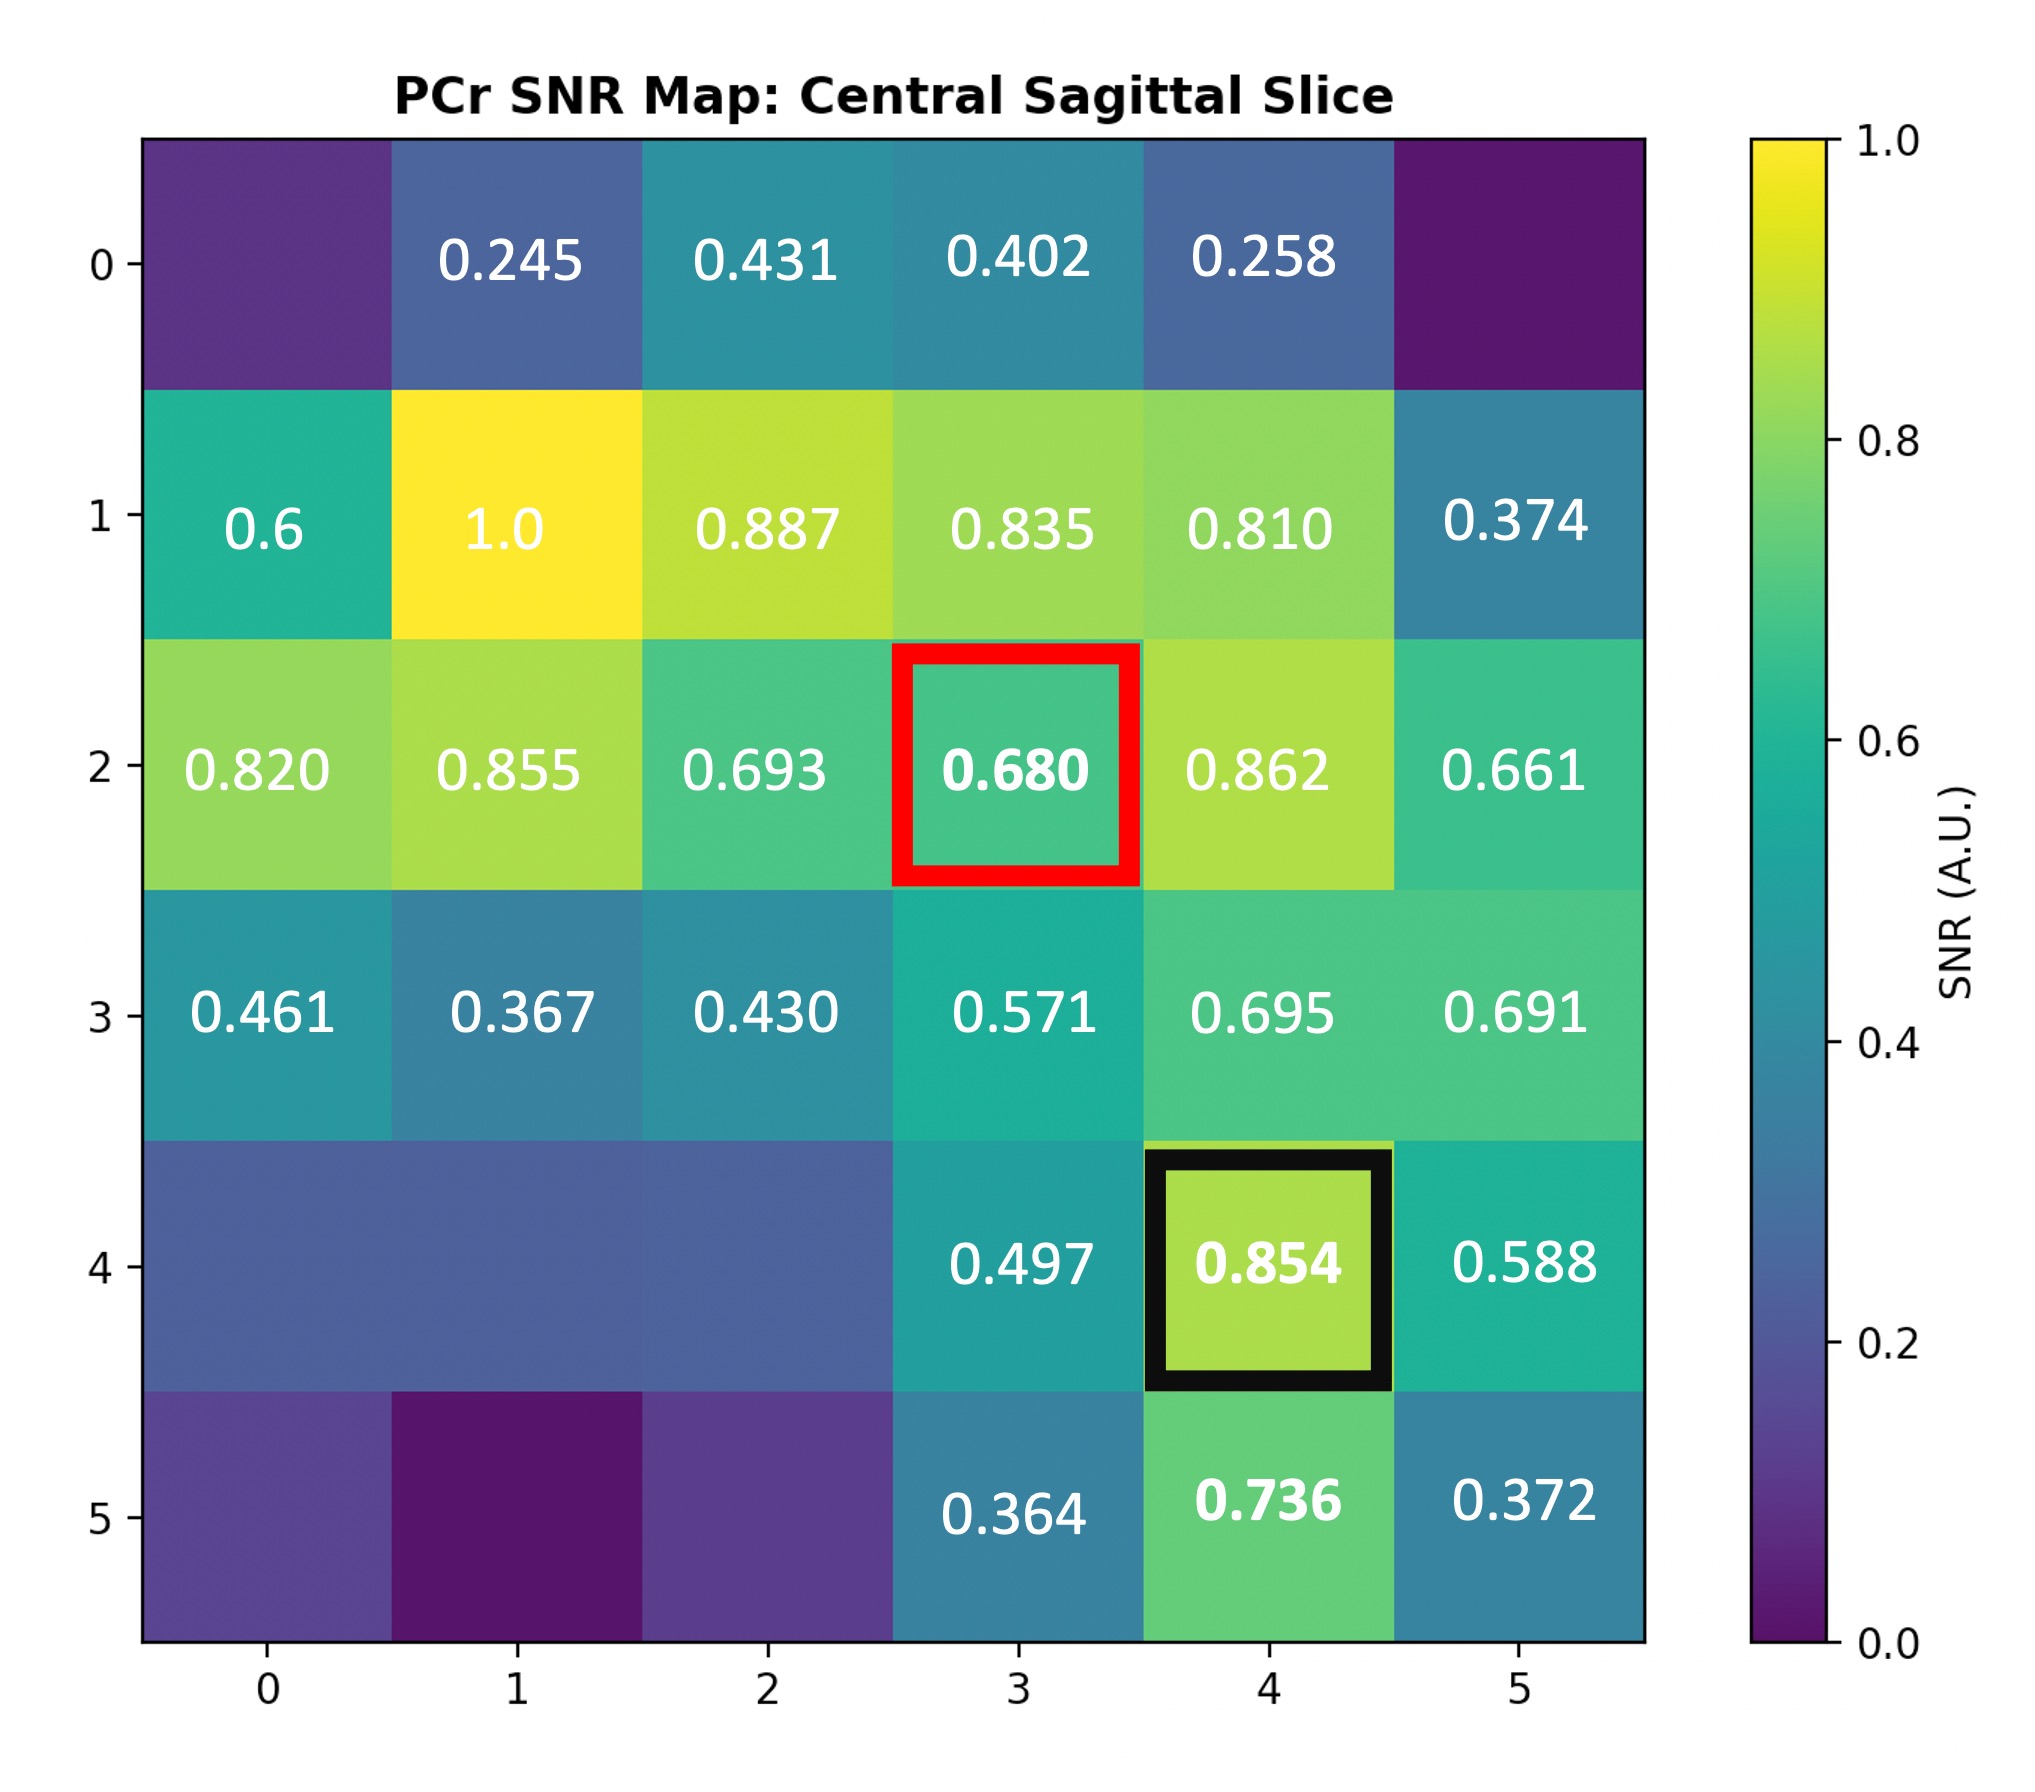
The results of an in vivo 31P 3D CSI acquisition (with highlighted voxels at the brain centre and cerebellum) and a corresponding PCr SNR map are shown in Figure 4 and Figure 5, respectively.
Discussion/Conclusion
We constructed an optimized RF coil for whole brain 31P MRSI at 7T. A combination of hardware optimization and offline data processing produced high quality 31P spectra across the entire brain with clearly distinguishable PME, PDE, Pi, and ATP peaks in both the centre of the brain and cerebellum. Normalized PCr SNR values reached 0.639 in the centre of the brain and 0.854 in the cerebellum demonstrating the potential of the coil for whole-brain 31P metabolite quantification.Acknowledgements
This work was financially supported by the Natural Sciences and Engineering Research Council of Canada (NSERC) Canada Graduate Scholarship- Master's (CGS-M) award. Funding support was also provided by the National Sciences and Engineering Research Council of Canada (NSERC) Discovery Grant (RGPIN-2018-05047) and Canada First Research Excellence Fund (CFREF), Healthy Brains for Healthy Lives Innovative Ideas Project Grant of Dr. David Rudko.References
1. Santos-Díaz, A. & Noseworthy, M. D. Phosphorus magnetic resonance spectroscopy and imaging (31P-MRS/MRSI) as a window to brain and muscle metabolism: A review of the methods. Biomedical Signal Processing and Control 60, 101967 (2020).
2. Das, N., Ren, J., Spence, J. & Chapman, S. B. Phosphate Brain Energy Metabolism and Cognition in Alzheimer’s Disease: A Spectroscopy Study Using Whole-Brain Volume-Coil 31Phosphorus Magnetic Resonance Spectroscopy at 7Tesla. Front. Neurosci. 15, 641739 (2021).
3. Brown, R., Lakshmanan, K., Madelin, G. & Parasoglou, P. A nested phosphorus and proton coil array for brain magnetic resonance imaging and spectroscopy. NeuroImage 124, 602–611 (2016).
4. Bank, B. L. et al. Optimized 31P MRS in the human brain at 7 T with a dedicated RF coil setup. NMR Biomed. 28, 1570–1578 (2015).
5. Rowland, B. C. et al. Whole brain P MRSI at 7T with a dual-tuned receive array. Magn Reson Med 83, 765–775 (2020).
6. Roemer, P. B., Edelstein, W. A., Hayes, C. E., Souza, S. P. & Mueller, O. M. The NMR phased array. Magn Reson Med 16, 192–225 (1990).
7. Vaughan, J. Thomas & Griffiths, John R. RF Coils for MRI. (2012).
8. Hayes, C. E., Edelstein, W. A., Schenck, J. F., Mueller, O. M. & Eash, M. An Efficient, Highly Homogeneous Radiofrequency Coil for Whole-Body NMR Imaging at 1.5 T. 7 (1985).
9. Reykowski, A., Wright, S.M., & Porter, J.R. Design of Matching Networks for Low Noise Preamplifiers. Magnetic Resonance in Medicine 33, 848–852 (1995).
10. Brown, M. A. Time-domain combination of MR spectroscopy data acquired using phased-array coils. Magn. Reson. Med. 52, 1207–1213 (2004).
Figures