1423
Whole-brain 3D B1+ mapping in under 30 seconds: compressed-sensing accelerated SA2RAGE1Advanced Clinical Imaging Technology, Siemens Healthineers International AG, Bern, Switzerland, 2Magnetic Resonance Methodology, Institute of Diagnostic and Interventional Neuroradiology, University of Bern, Bern, Switzerland, 3Translational Imaging Center (TIC), Swiss Institute for Translational and Entrepreneurial Medicine, Bern, Switzerland, 4Advanced Clinical Imaging Technology, Siemens Healthineers International AG, Lausanne, Switzerland, 5Department of Radiology, Lausanne University Hospital and University of Lausanne, Lausanne, Switzerland, 6LTS5, École Polytechnique Fédérale de Lausanne (EPFL), Lausanne, Switzerland, 7Magnetic Resonance, Siemens Healthcare GmbH, Erlangen, Germany, 8Donders Institute for Brain Cognition and Behaviour, Radboud University, Nijmegen, Netherlands
Synopsis
Keywords: High-Field MRI, RF Pulse Design & Fields, B1+ mapping
To fully exploit the strengths of UHF imaging, accurate B1+ mapping is essential, ideally in 3D with sufficient coverage and high dynamic range. However, resulting scan times on the order of minutes are problematic, especially with the prospect of increased clinical use of 7T imaging. We implemented a compressed sensing readout and reconstruction for the SA2RAGE technique yielding <30 s scan time for a whole-brain, 4-mm isotropic resolution B1+ map. We tested different acceleration factors, validated against the GRAPPA-accelerated reference protocol of ~2 min and found <0.05 relative B1+ difference in most regions of the brain.
INTRODUCTION
Ultra-high field (UHF) MRI has seen an increased clinical adoption, with some advanced centers already routing patients directly to 7T scanners for specific indications. However, to fully exploit the strengths of UHF imaging, accurate B1+ mapping is essential, ideally in 3D, with sufficient coverage and high dynamic range. Among the several available methods1-4, the saturation-prepared 2 rapid Gradient Echo, SA2RAGE5, offers a wide linear dynamic range (from 0.2 to 2 times the nominal flip angle), low T1 relaxation bias, and low energy deposition in relatively short acquisition times, which are in the order of 2 minutes for a 3D full-brain B1+ map in single transmission. As 7T imaging enters more clinical settings, scan times become much more critical and 2 minutes (which, for parallel transmission, must be multiplied by the number of transmit channels) might even be prohibitive. Thus, 2D multi-slice techniques are currently preferred for their speed6 at the expense of limited coverage, anisotropic maps and slice profile effects. The aim of this work was to drastically shorten the conventional GRAPPA-accelerated SA2RAGE acquisition using compressed sensing (CS) for whole-brain B1+ mapping in <30 seconds. We validated the maps against the standard ~2-min SA2RAGE protocol recommended in the original paper.METHODS
IRB-approved experiments were performed in one healthy subject (male, 49 y.o.) at 7T (MAGNETOM Terra, Siemens Healthcare, Erlangen, Germany) using a 1-channel TX/32-channel RX head coil (Nova Medical, Wilmington, MA).The SA2RAGE research application sequence was implemented using a hard saturation pulse (640-us duration) followed by two FLASH readout blocks at delay times TD1/2, respectively (Figure 1A). For B1+ mapping, a complex ratio image is computed from the two images obtained at TD1 and TD2. The ratio value at each voxel depends on the resulting saturation. The corresponding B1+ is predicted using Bloch equations simulation based on the sequence parameters and a nominal whole-brain T1 value of 1.5 s.
Optimized sequence parameters for increased CNR and reduced T1 sensitivity were adopted as in5, 7 with non-selective excitation in sagittal orientation (i.e. readout in inferior-superior direction) and included: TD1/2=51/1800 ms, TR=2400 ms, FLASH-excitation-angle1/2=4°/11°, FLASH-TR/TE=2.8/1.13 ms, matrix=64x48x64, FOV=256x192x256 mm3, resolution=4x4x4 mm3. The reference protocol used two-fold phase-encoding GRAPPA acceleration, linear slice-in-line ordering, and slice-6/8 partial Fourier sampling, acquiring 42 readouts per FLASH block and resulting in 1:54 min total acquisition time. The accelerated protocols employed a variable-density 3D Cartesian sampling pattern8 for both TD1/2; in each FLASH block, 36 readouts were acquired along an arc-like trajectory to achieve same minimal TD1 as in the reference protocol. Four dummy repetitions were introduced to bring the signal to steady state at sequence start.
Different acceleration factors were tested resulting in reduced scan times, see Figure 2. To explore a wide range of undersampling factors, some protocols required a slight change in parameters (TD1=45 ms, 32 readouts/FLASH block).
Images were reconstructed on the scanner with a compressed sensing algorithm9 using Haar-wavelet regularization; flip-angle maps were subsequently generated inline. Relative B1+ maps were computed as flip-angle-map/90° offline in MATLAB (The MathWorks Inc., Natick, MA, USA) for all accelerated protocols and compared against the reference in terms of relative difference within a manually drawn region of the brain.
RESULTS
Figure 3 shows representative images from the reference and five-fold accelerated SA2RAGE acquisitions. The magnitude TD1 images show the typical contrast obtained after the saturation pulse, with a region of highest saturation in the center of brain. The TD2 images have more signal due to T1 recovery. CS-accelerated images show good quality compared to the reference upon visual inspection. Accelerated B1+ maps agree with the reference and show a typical field distribution with increased values in the center of the brain and lower in the cerebellum (Figure 3 and 4). The CS reconstruction did not introduce visible artifacts even at high acceleration factors. Relative difference maps show a trend of underestimation in most of the upper part of the brain (light blue) and overestimation in the occipital part of the brain and the cerebellum (light red) both in the range of 0-0.05 relative B1+ (Figure 5, left column). These trends can be observed up to 7-fold acceleration; from CS8 to CS15, the deviations from the reference values become more heterogeneous with low under/over-estimation (<±0.05 B1+) alternating throughout the upper part of the brain. Very high undersampling (CS19) shows higher deviations from nominal B1+ (>±0.05) especially in coronal and transversal views (Figure 5, right column).DISCUSSION & CONCLUSION
Flip-angle deviations from the reference protocol in the occipital area and lower part of the brain may be due to differences in phase reconstruction and remain to be investigated in a larger cohort. The regularization weight also remains to be optimized for the adopted sequence. More advanced model-based reconstruction and lower spatial resolutions will also be investigated to further shorten scan times. This preliminary investigation showed that our CS framework holds potential to substantially accelerate the acquisition of a whole-brain 3D B1+ map from ~2 min to <30 s in single transmission. While this may be a step forward in the clinical setting, it still limits its application in parallel transmission, where further development is warranted to accelerate SA2RAGE for multi-channel B1+ mapping.Acknowledgements
No acknowledgement found.References
1. Stollberger R and Wach P. Imaging of the active B1 field in vivo. Magn Reson Med. 1996;35:246-51.
2. Yarnykh VL. Actual flip-angle imaging in the pulsed steady state: a method for rapid three-dimensional mapping of the transmitted radiofrequency field. Magn Reson Med. 2007;57:192-200.
3. Chung S, Kim D, Breton E and Axel L. Rapid B1+ mapping using a preconditioning RF pulse with TurboFLASH readout. Magn Reson Med. 2010;64:439-46.
4. Nehrke K, Versluis MJ, Webb A and Bornert P. Volumetric B1 (+) mapping of the brain at 7T using DREAM. Magn Reson Med. 2014;71:246-56.
5. Eggenschwiler F, Kober T, Magill AW, Gruetter R and Marques JP. SA2RAGE: a new sequence for fast B1+ -mapping. Magn Reson Med. 2012;67:1609-19.
6. Klose U. Mapping of the radio frequency magnetic field with a MR snapshot FLASH technique. Med Phys. 1992;19:1099-104.
7. Eggenschwiler F, O'Brien KR, Gruetter R and Marques JP. Improving T2 -weighted imaging at high field through the use of kT -points. Magn Reson Med. 2014;71:1478-88.
8. Mussard E, Hilbert T, Forman C, Meuli R, Thiran JP and Kober T. Accelerated MP2RAGE imaging using Cartesian phyllotaxis readout and compressed sensing reconstruction. Magn Reson Med. 2020;84:1881-1894.
9. Wetzl J, Forman C, Wintersperger BJ, D'Errico L, Schmidt M, Mailhe B, Maier A and Stalder AF. High-resolution dynamic CE-MRA of the thorax enabled by iterative TWIST reconstruction. Magn Reson Med. 2017;77:833-840.
Figures
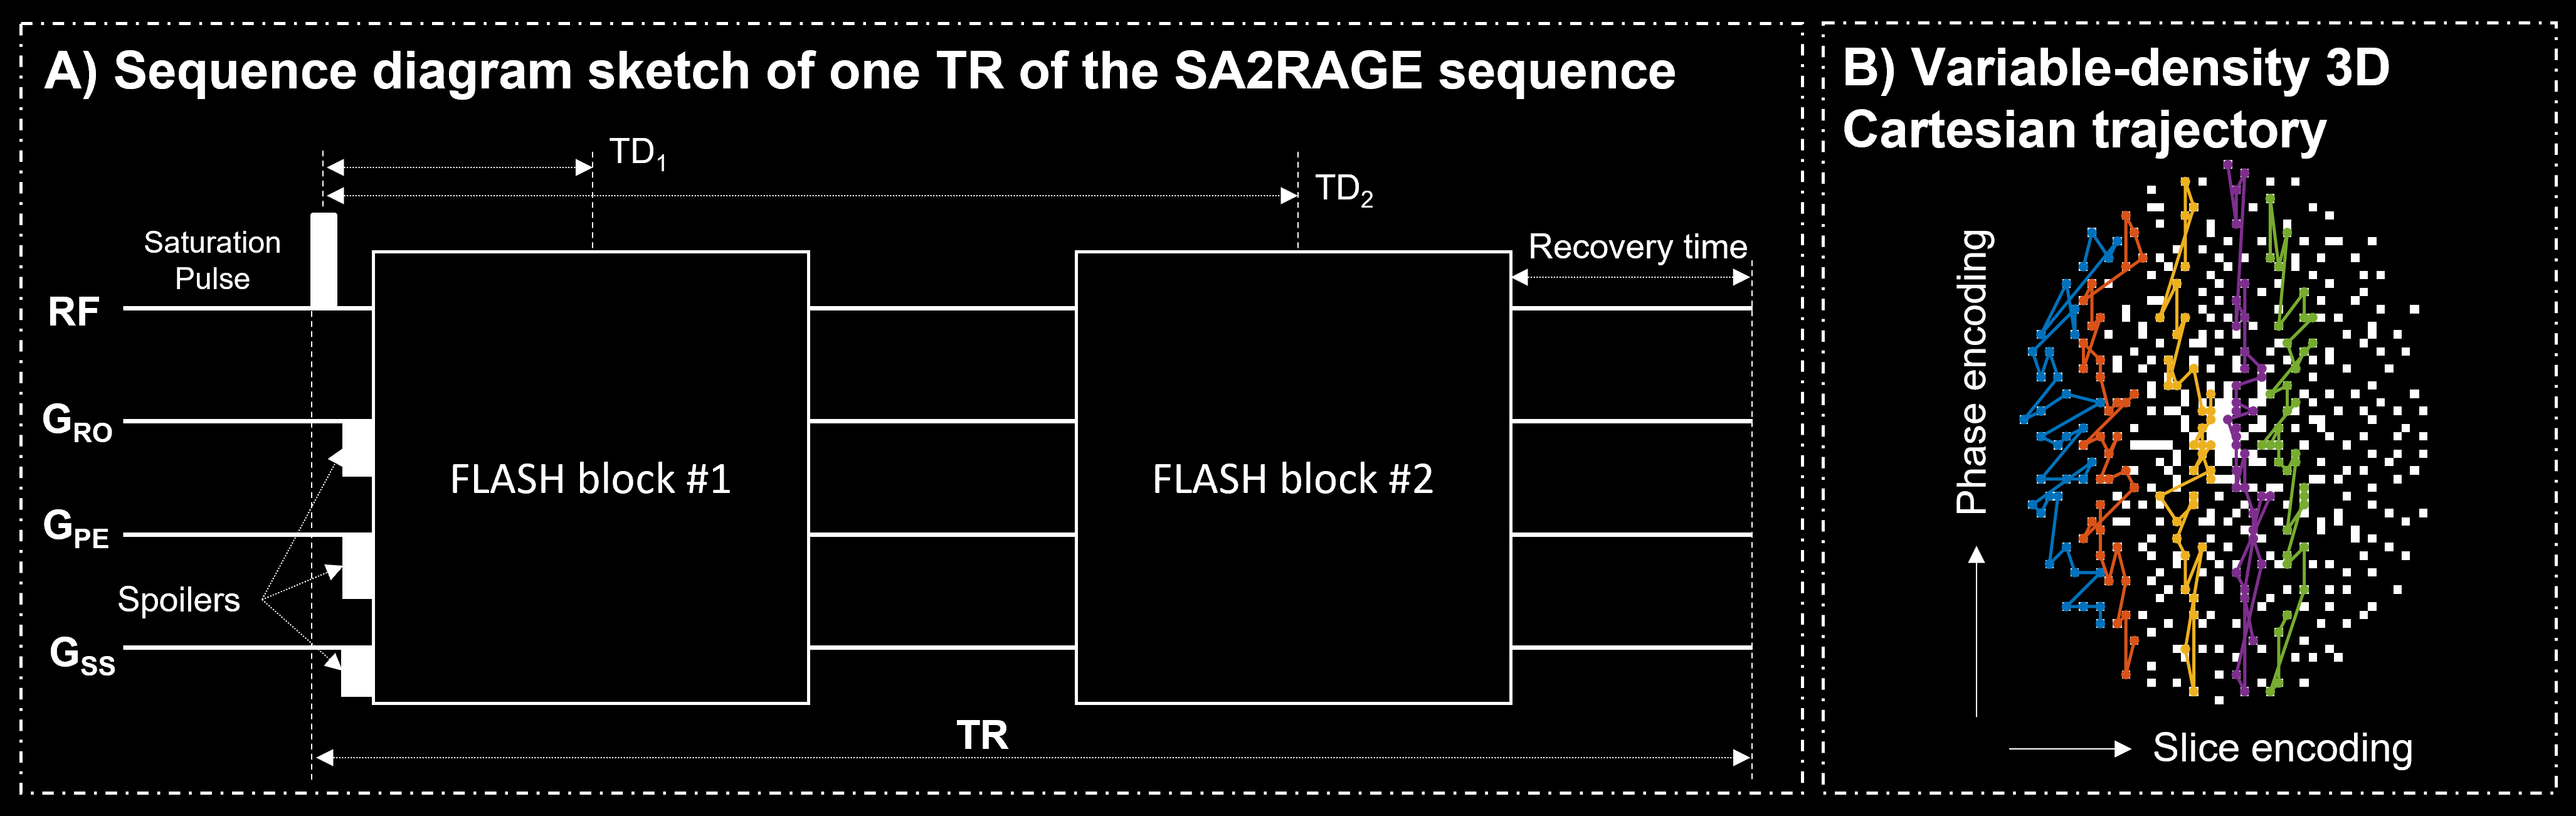
Figure 1. Diagram of the SA2RAGE sequence. In each TR, two FLASH blocks are acquired at different delay times (TD1,2) after a hard saturation pulse with a linear ordering (A). A spiral phyllotaxis 3D Cartesian trajectory was undersampled in phase- and slice-encoding dimensions (B). A sampling mask is shown for 5-fold acceleration. In each TR, readouts (indicated as white dots) were sampled following the same arc-shaped trajectory in the phase/slice encoding plane for both FLASH blocks as described in8. Different colors show arcs acquired at different repetitions.
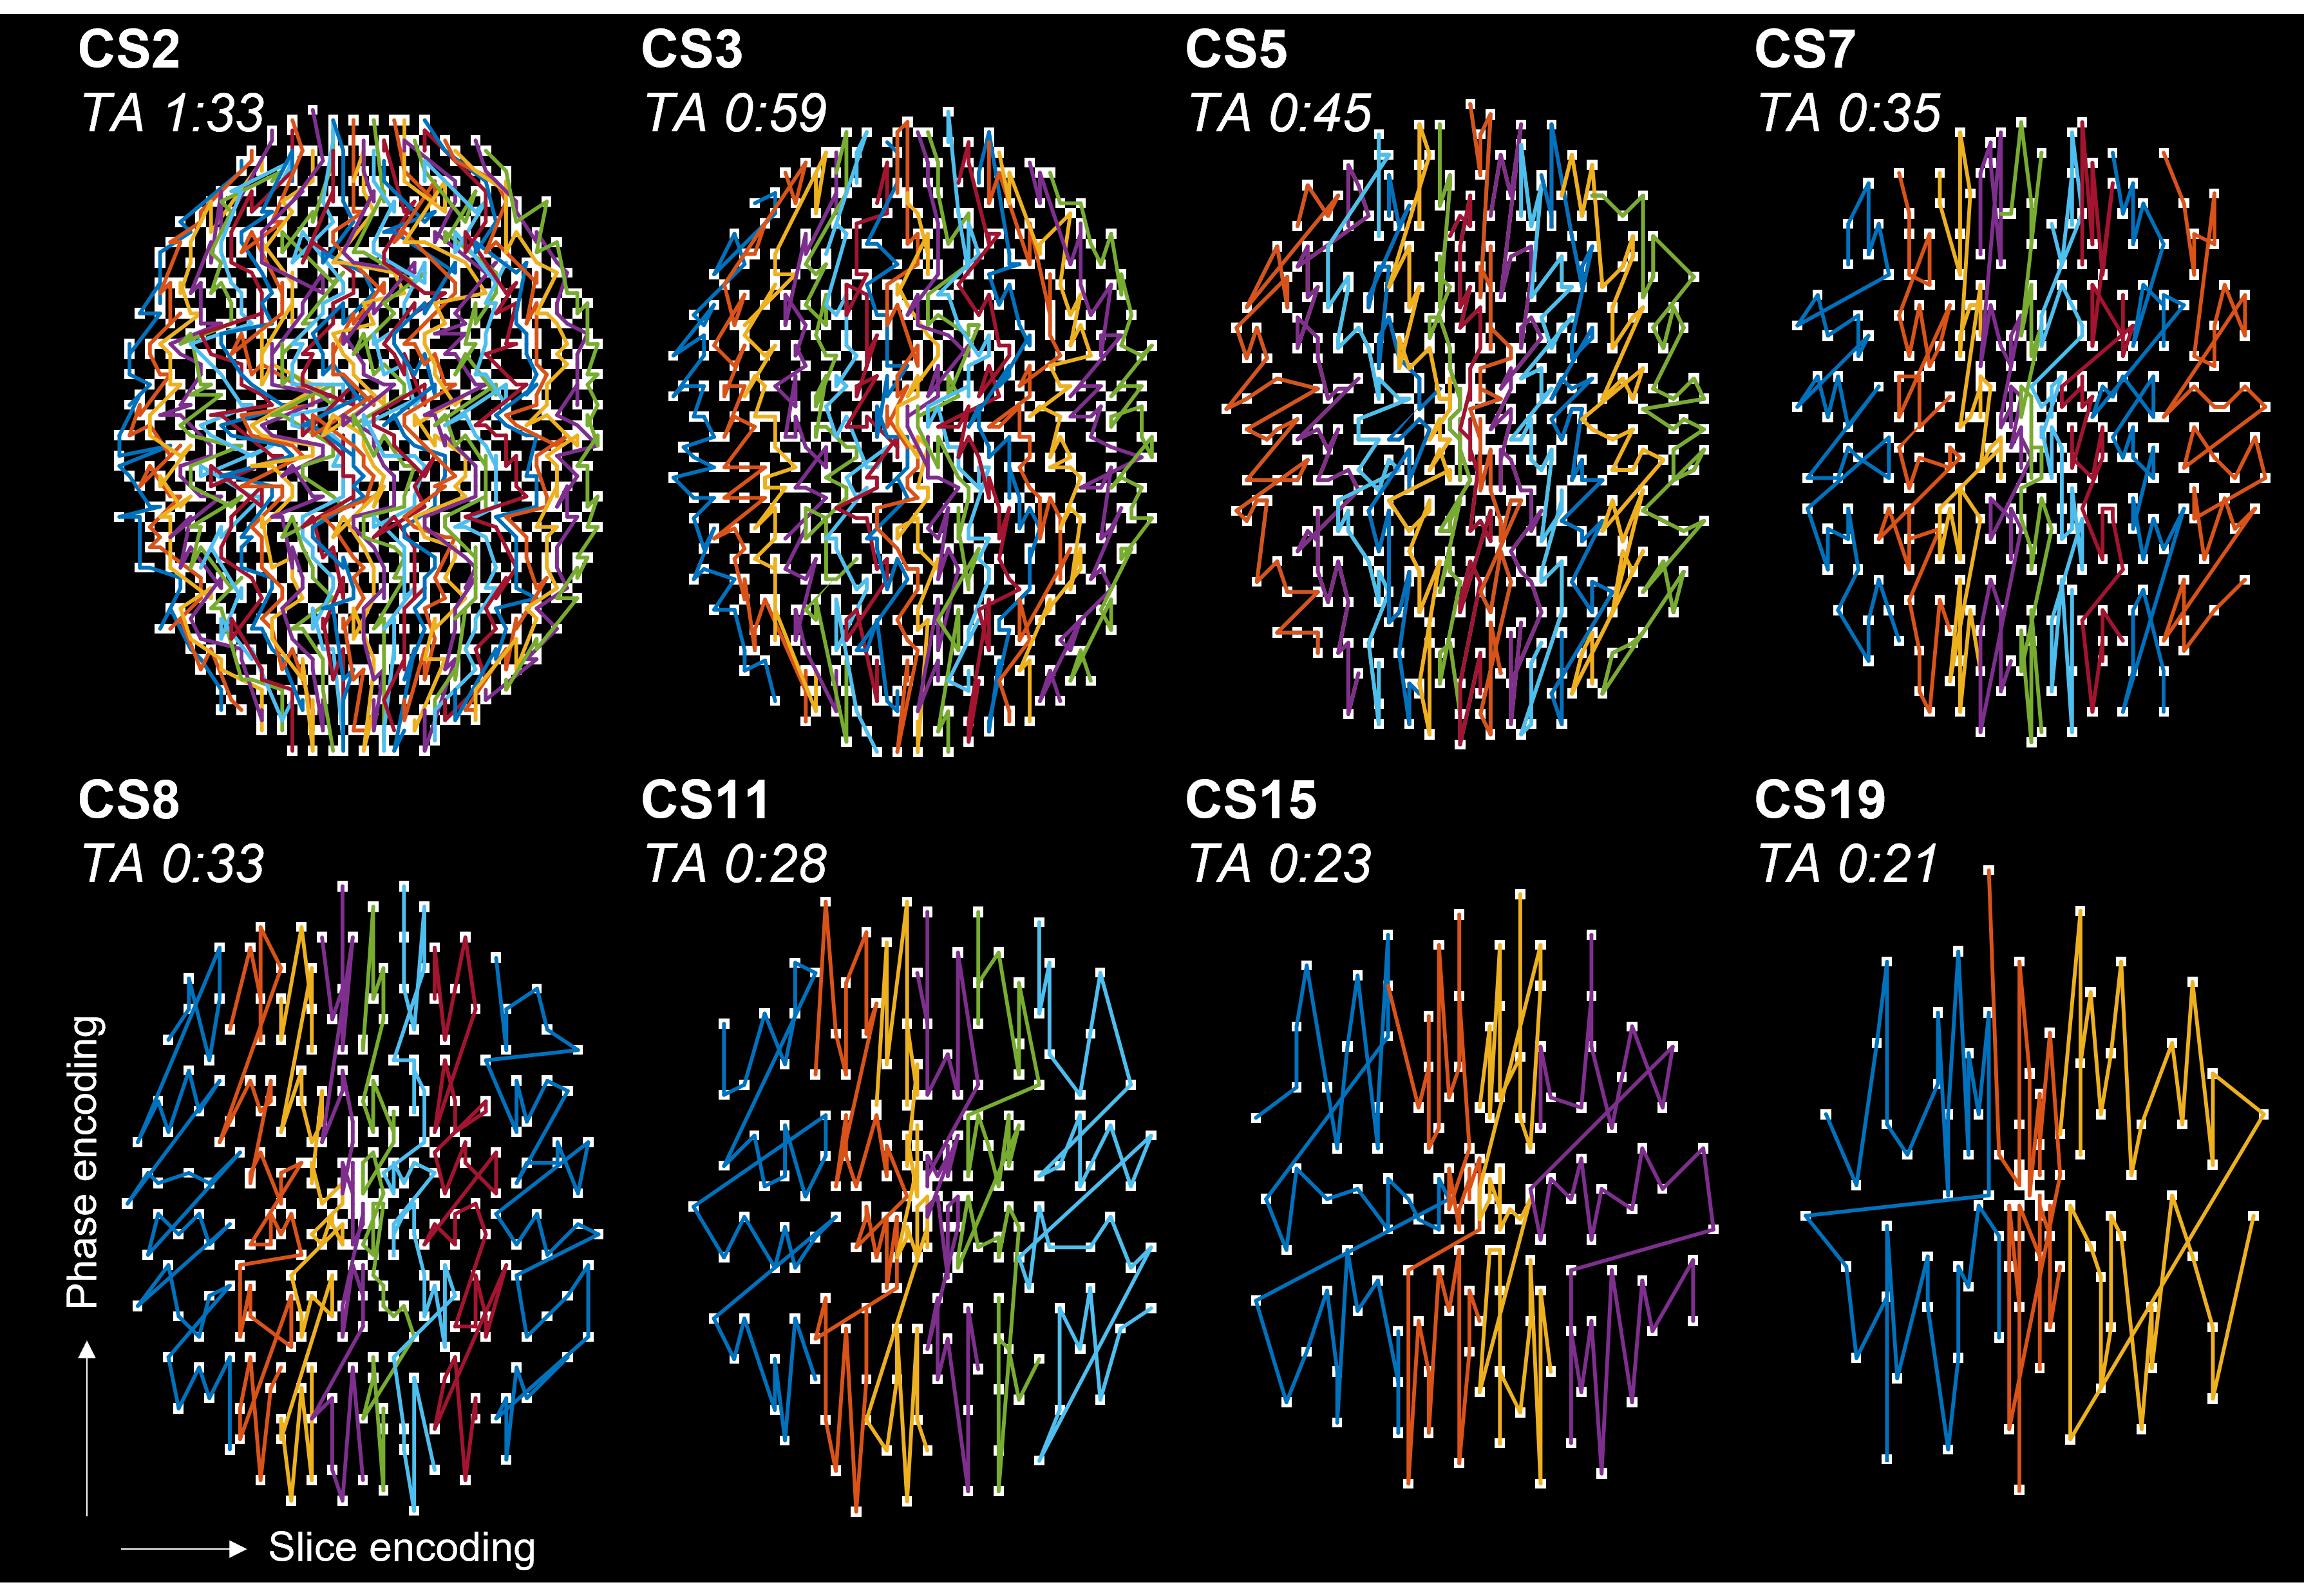
Figure 2. k-Space trajectory masks for all compressed sensing (CS) accelerated protocols. Each white dot indicates a readout going through the phase/slice encoding plane. Different colored arcs indicate different TR and were sampled along the slice encoding direction during the scan. Acceleration factors are reported as CS# and the resulting acquisition times (TA) as [min:s]. CS11/19 required TD1=45 ms instead of 51 ms as in the reference.
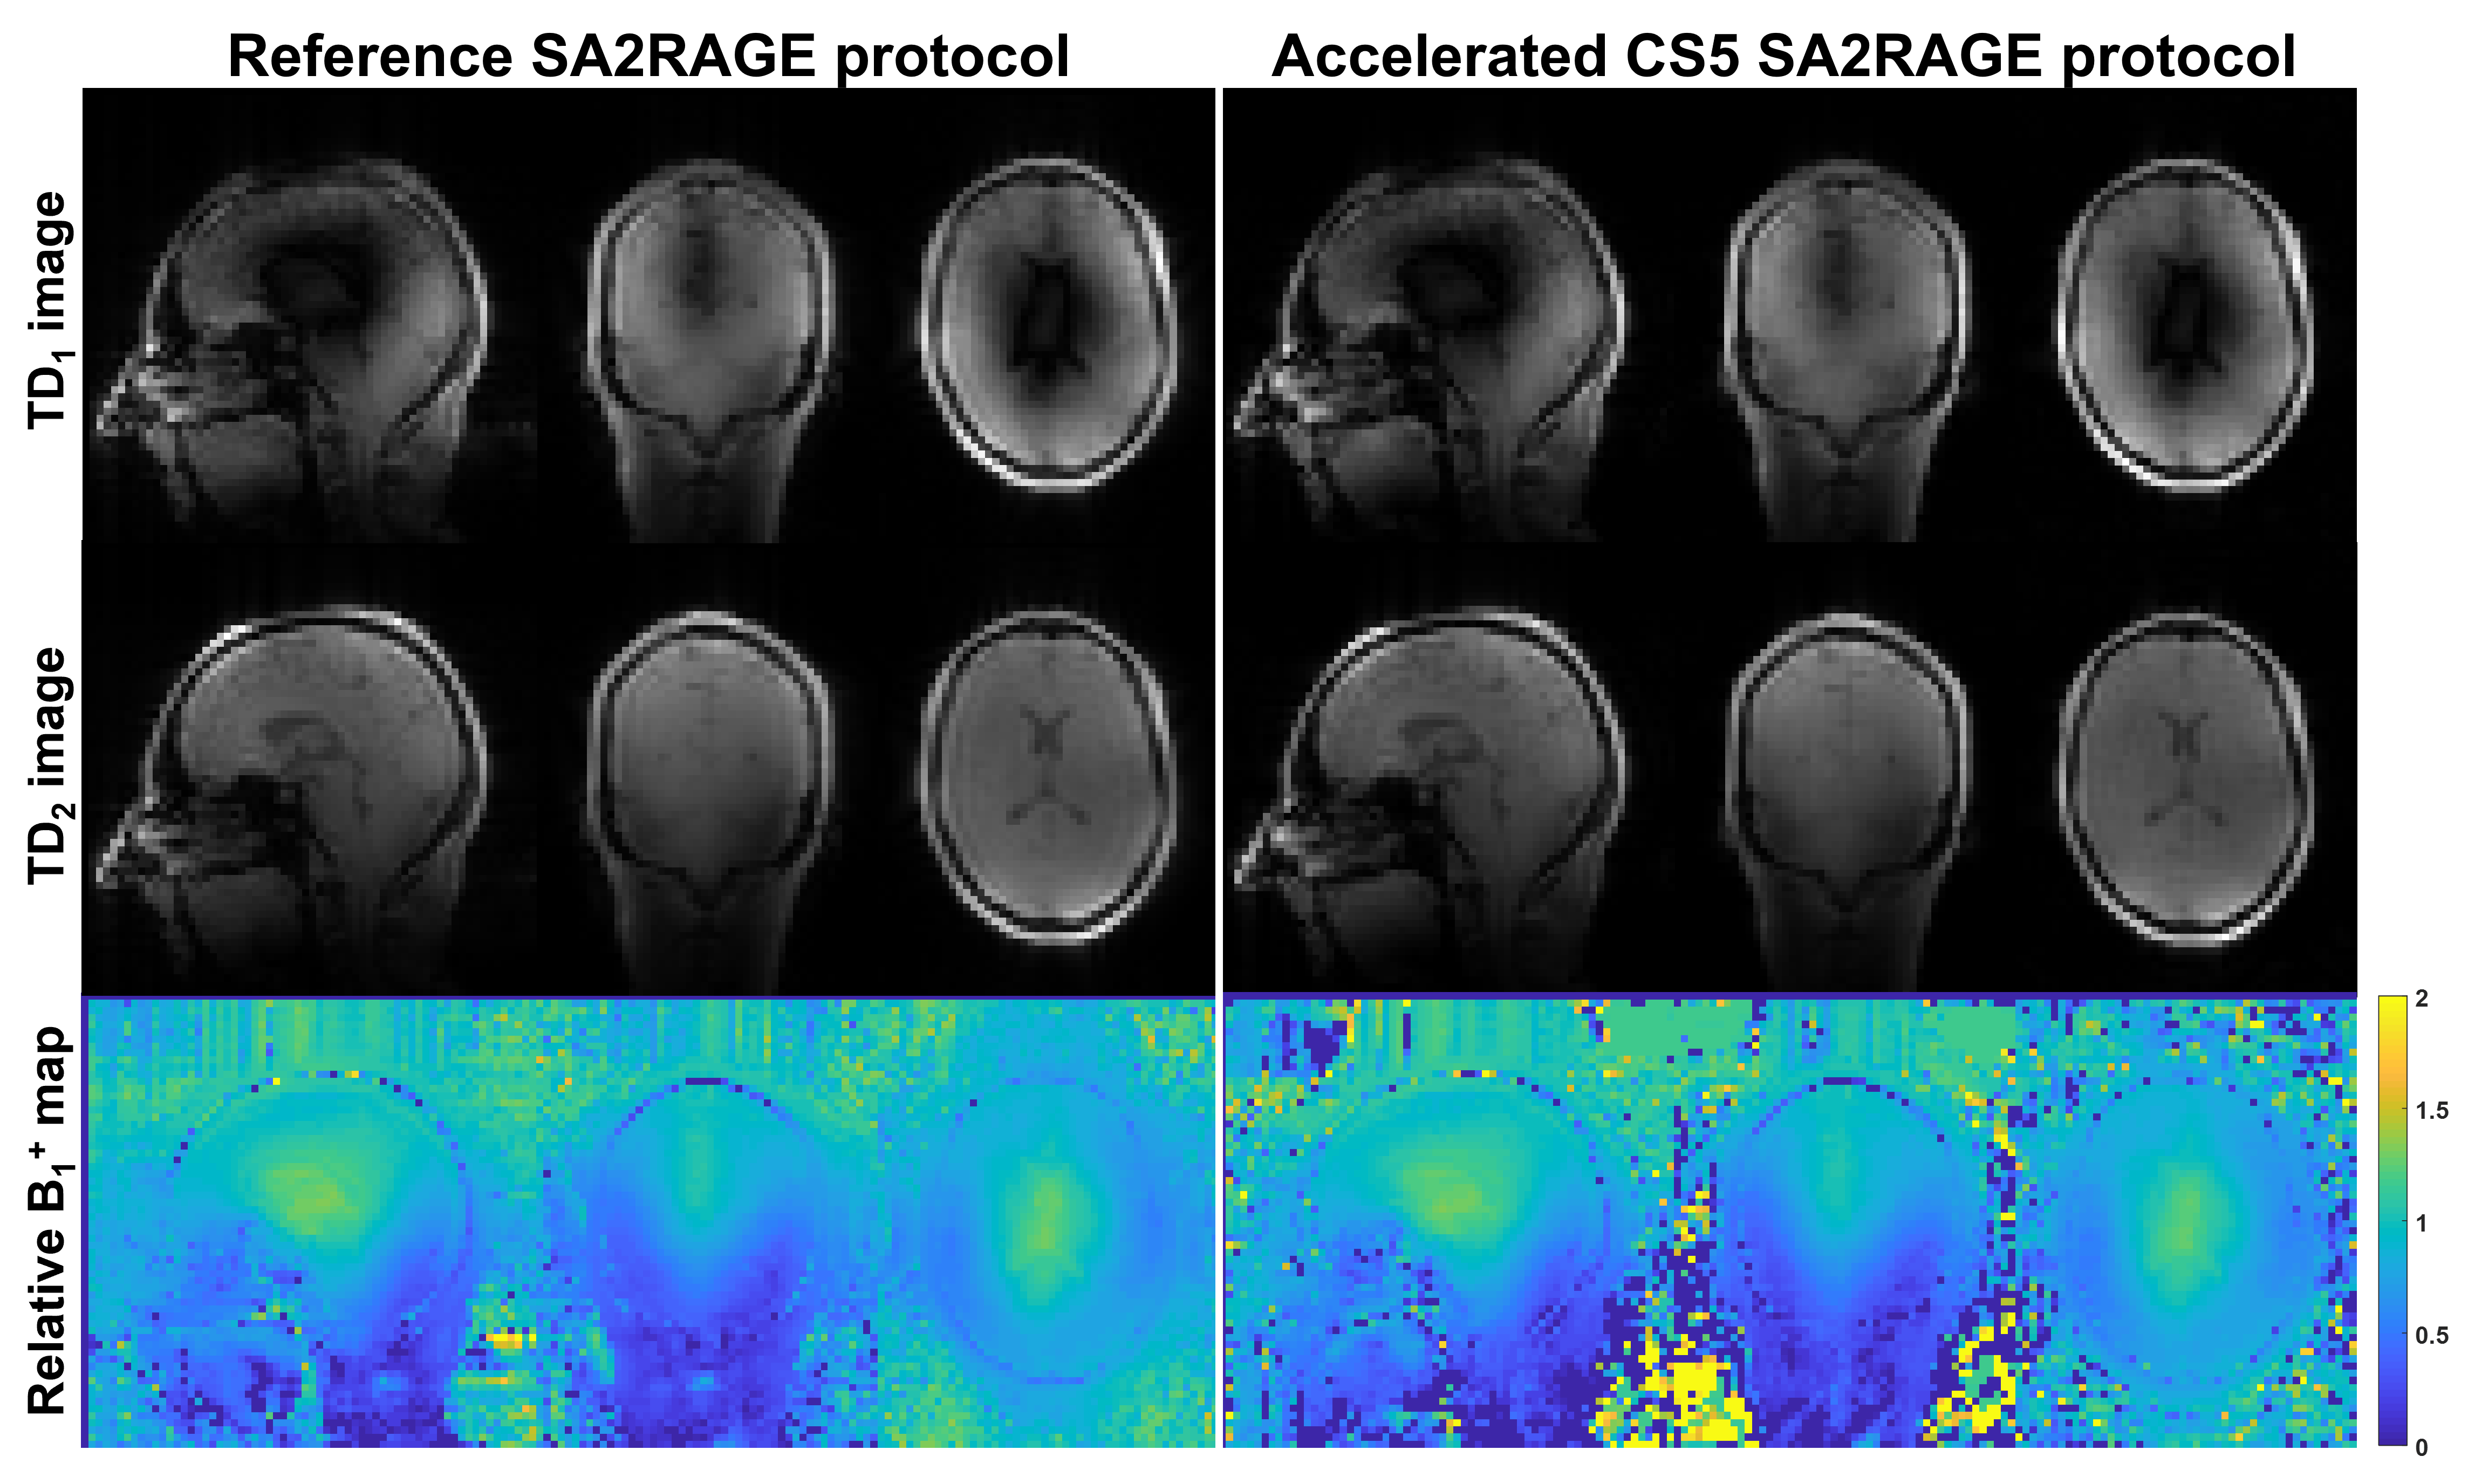
Figure 3. Reference and five-fold compressed sensing (CS) accelerated protocols acquired on the same subject. Similar image quality can be observed in the magnitude TD1/2 images between reference and CS5, despite 50% scan time reduction. The TD1 images show typical contrast with highest saturation in the center of brain. The TD2 images have more signal due to T1 recovery but were windowed separately for display. Accelerated B1+ maps show good visual agreement with the reference.
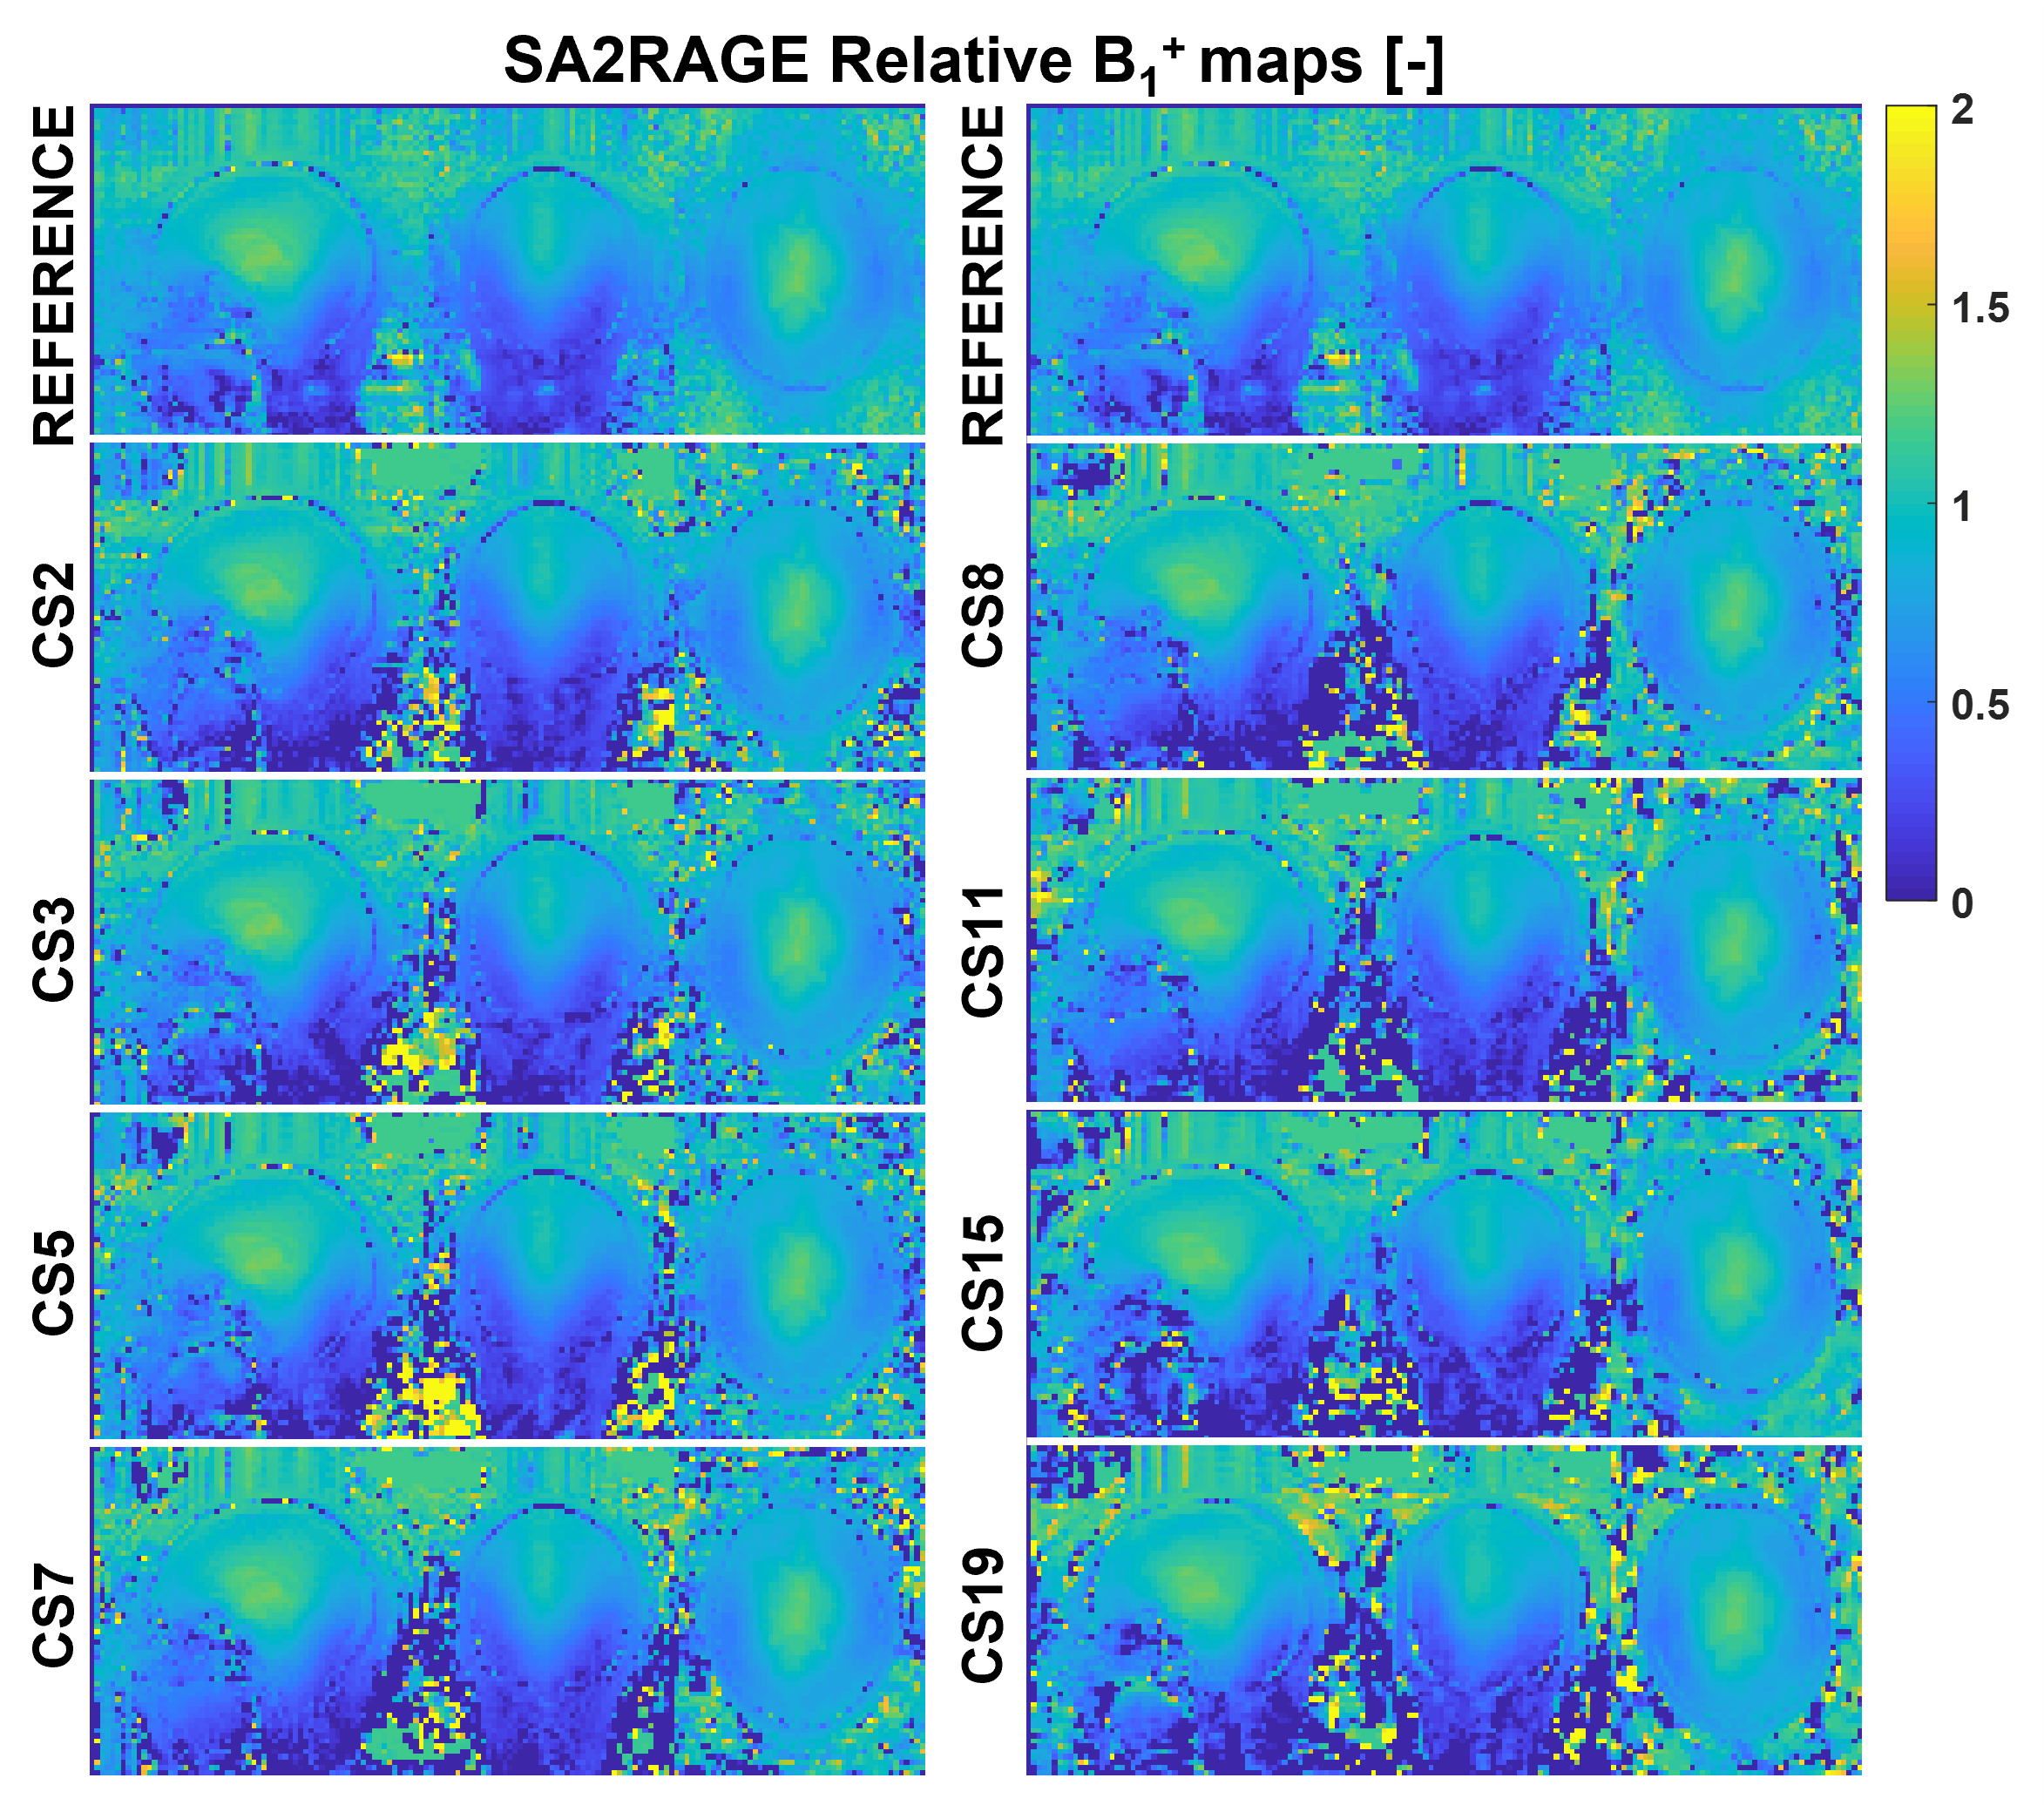
Figure 4. Selected sagittal, coronal, and axial views of resulting B1+ maps from all accelerated protocols, and reference B1+ shown on top of each column for visual comparison. Accelerated B1+ maps show good quality and similar structure compared to the reference over the wide range of undersampling factors. Specific artifacts related to the compressed sensing (CS) reconstruction were not observed.
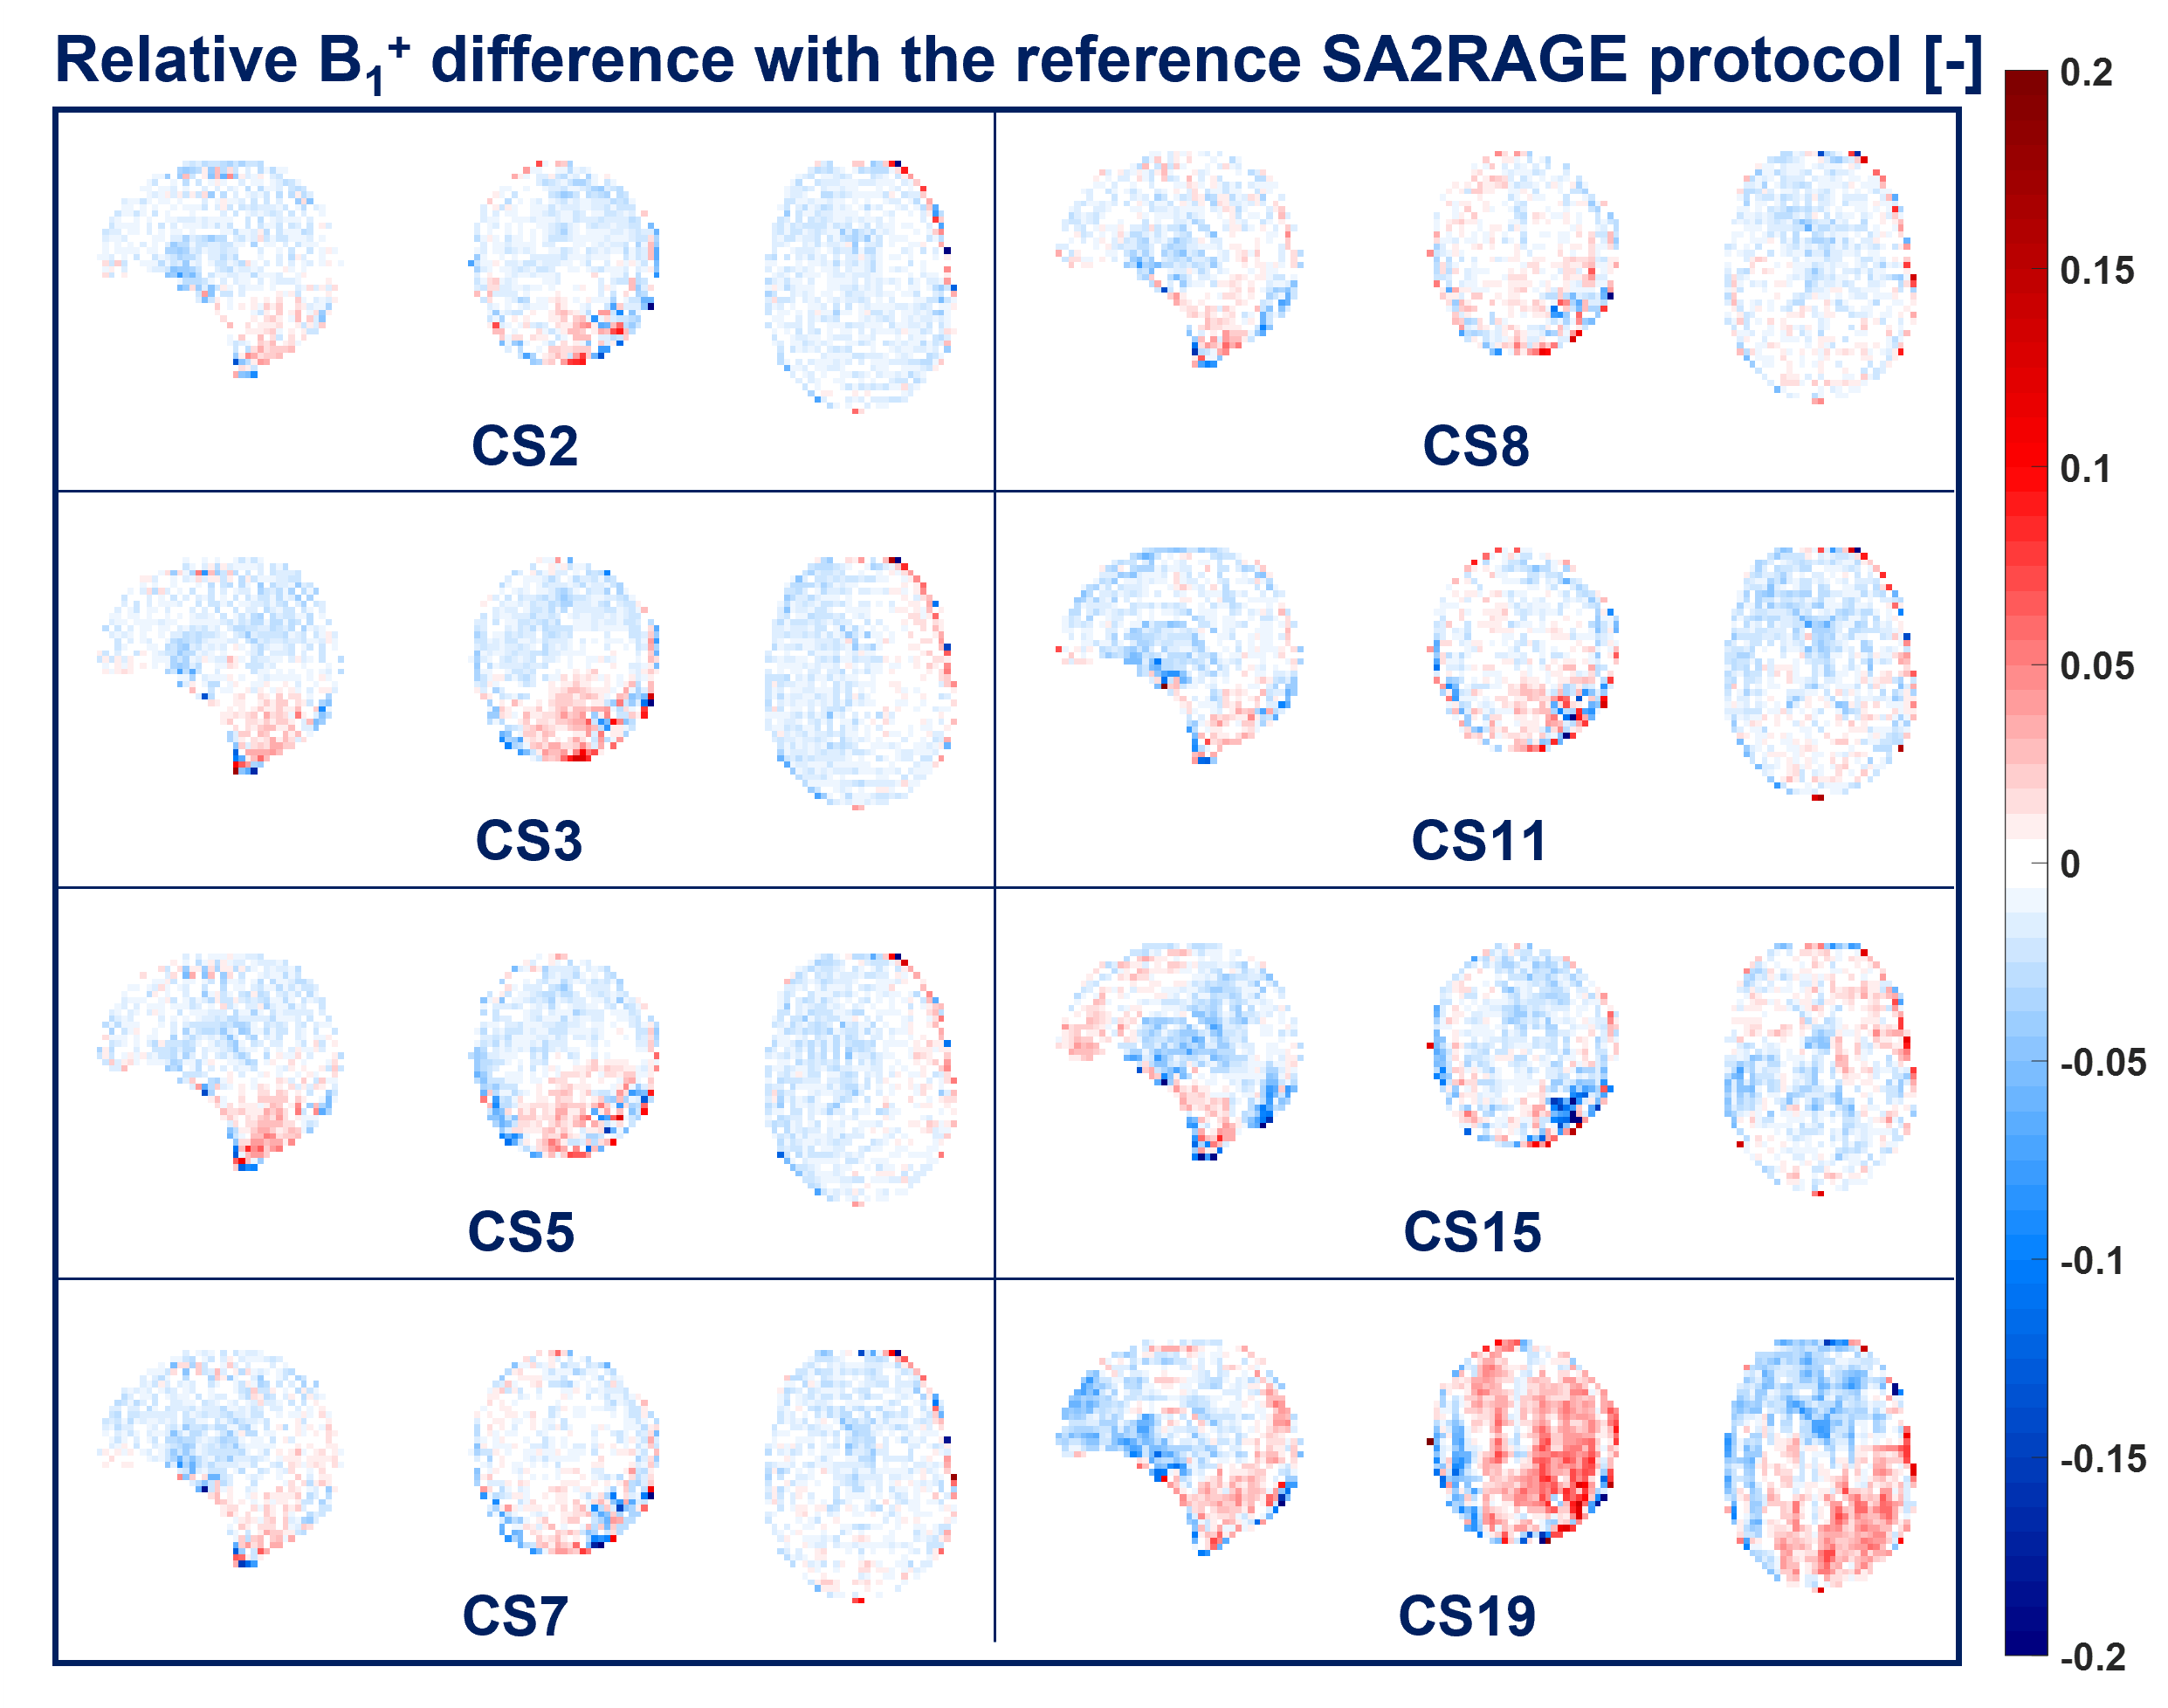
Figure 5. Relative B1+ difference of all CS-accelerated protocols with the reference is shown in the same sagittal, coronal, and transversal views of Figure 4. Small underestimation (<0.05) can be observed in the upper part of the brain (light blue) and overestimation (>-0.05) in the lower portion and the cerebellum for CS2-7. For CS8-15 such small B1+ under/over-estimation becomes more heterogeneous. High acceleration factor, CS19, shows higher B1+ deviations (>±0.05) throughout the brain.