1415
Highly decoupled 8x2 transceiver array for human brain at 7T (Rx performance evaluation)1Radiology, University of Missouri, Columbia, MO, United States, 2EECS, University of Missouri, Columbia, MO, United States, 3BBCE, University of Missouri, Columbia, MO, United States, 4Radiology, University of Pittsburgh, Pittsburgh, PA, United States, 5Resonance Research Inc., Billerica, MA, United States
Synopsis
Keywords: High-Field MRI, RF Arrays & Systems, Rx array
While the Tx performance of the 8x2 transceiver has been shown to achieve excellent amplitude and homogeneity, with its limited coil numbers (16), it is thought to give substantially lower SNR and acceleration in comparison to conventional arrays (8Tx/32Rx). It is recognized however, that the Tx decoupling is also constructive for Rx since the SNR and g-factors benefit from the decreased noise correlation. We evaluated the SNR, g factors, and noise covariance and found that up to an in-plane acceleration value of approximately <=4, the transceiver gives comparable performance to a commercial reference coil.Introduction
The 8x2 decoupled transceiver array has been shown1,2 to provide excellent RF transmission characteristics for amplitude and homogeneity at 7T. This array uses RID and TD circuits1-3 to achieve coupling values of <-20dB. However, it has been perceived that the transceiver array does not provide sufficient SNR with high acceleration because of the fewer Rx elements compared to conventional 32 Rx-only arrays. It should be recognized however that to minimize coupling, traditional receive only arrays use preamplifier decoupling and coil overlap, while the transceiver obviously has substantially lower coupling which is important for minimizing noise correlations. To understand the impact of improved decoupling for Rx performance, we evaluated the noise covariance, g-factor map, SNR and compared it to the commercial reference 8Tx/32Rx RF coil (Nova Medical, Wilmington, MA). In vivo turbo spin echo TSE images were also acquired and compared.Methods
A whole body 7T MRI (Terra, Siemens Healthineers, Erlangen, Germany) was used. To measure the array performance, multi-slice 2D-GRE images were acquired with TR/TE=10sec/3.8msec, FA=30º, slice thickness 3mm, matrix 64x64, FOV 220x220mm2. The noise covariance was calculated from the prescan data. To assess the decoupling effectiveness, the mean and SD of the noise correlations between all coil loops were calculated. Given that there is commonly poorer decoupling between adjacent and second neighboring loops, the mean and SD of the noise correlations at these locations were also calculated. g-maps were calculated using a SENSE reconstruction4. The SNR map was calculated using SENSE SNR5 . For the SNR evaluation, Coefficient of Variation (CoV) of SNR within/between slices were calculated. High resolution TSE imaging at R=3 (TR/TE=4sec/55msec, FA=128º, thickness=3mm, in-plane res.= 0.2mm2, TA=4min., n=5 subjects) demonstrate the overall performance.Results
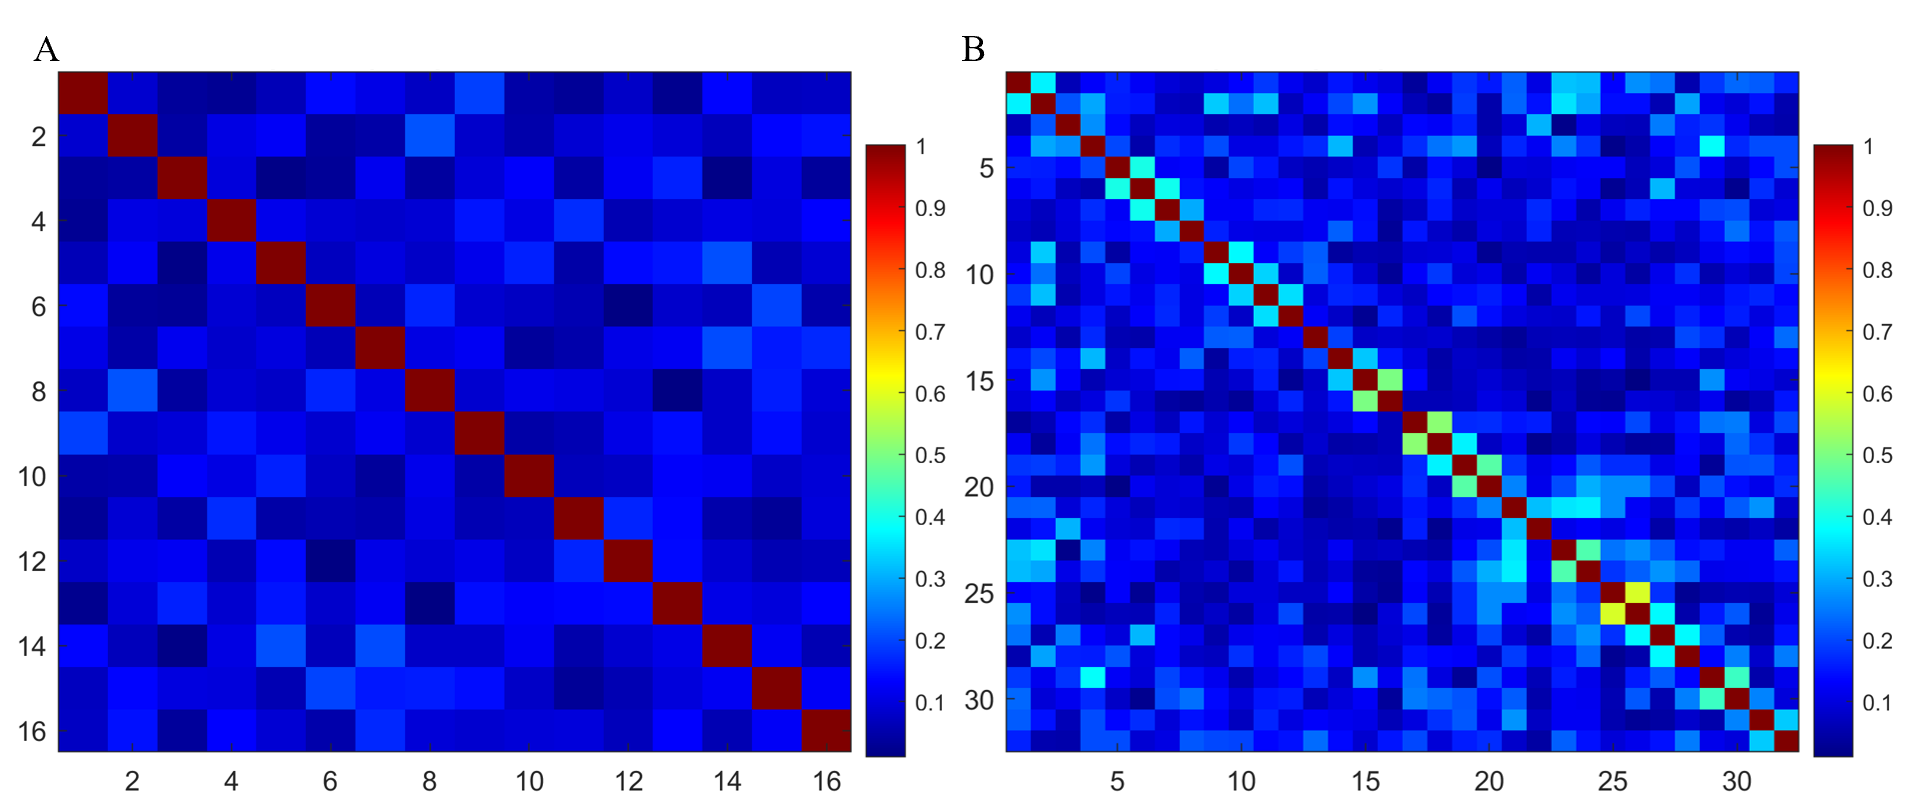
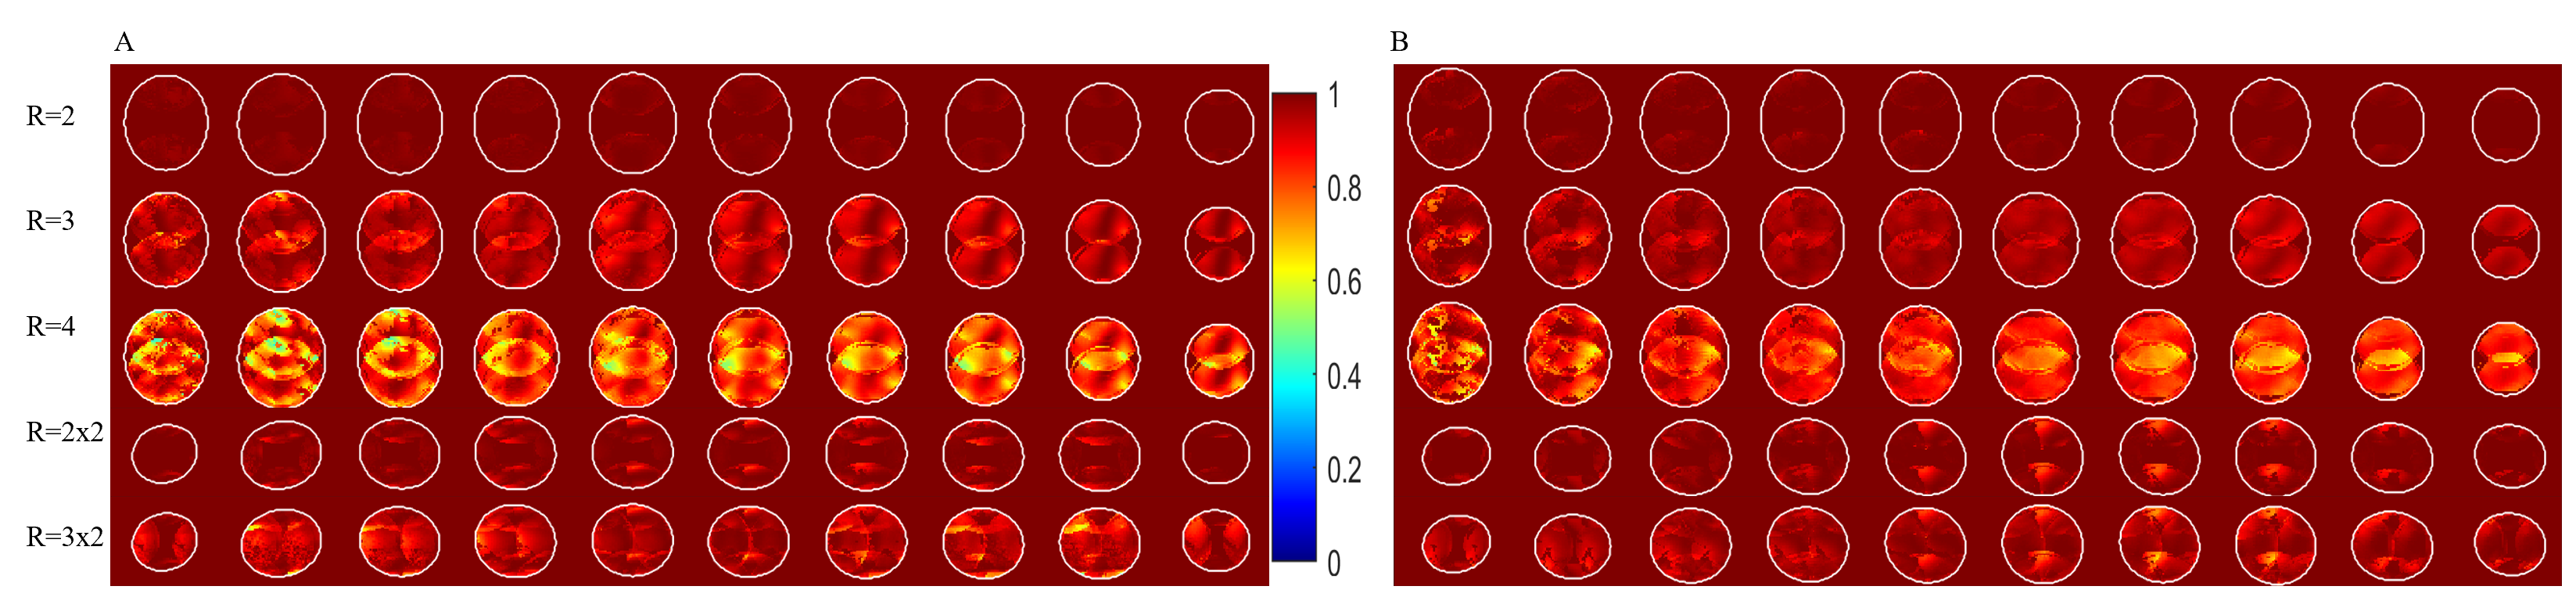
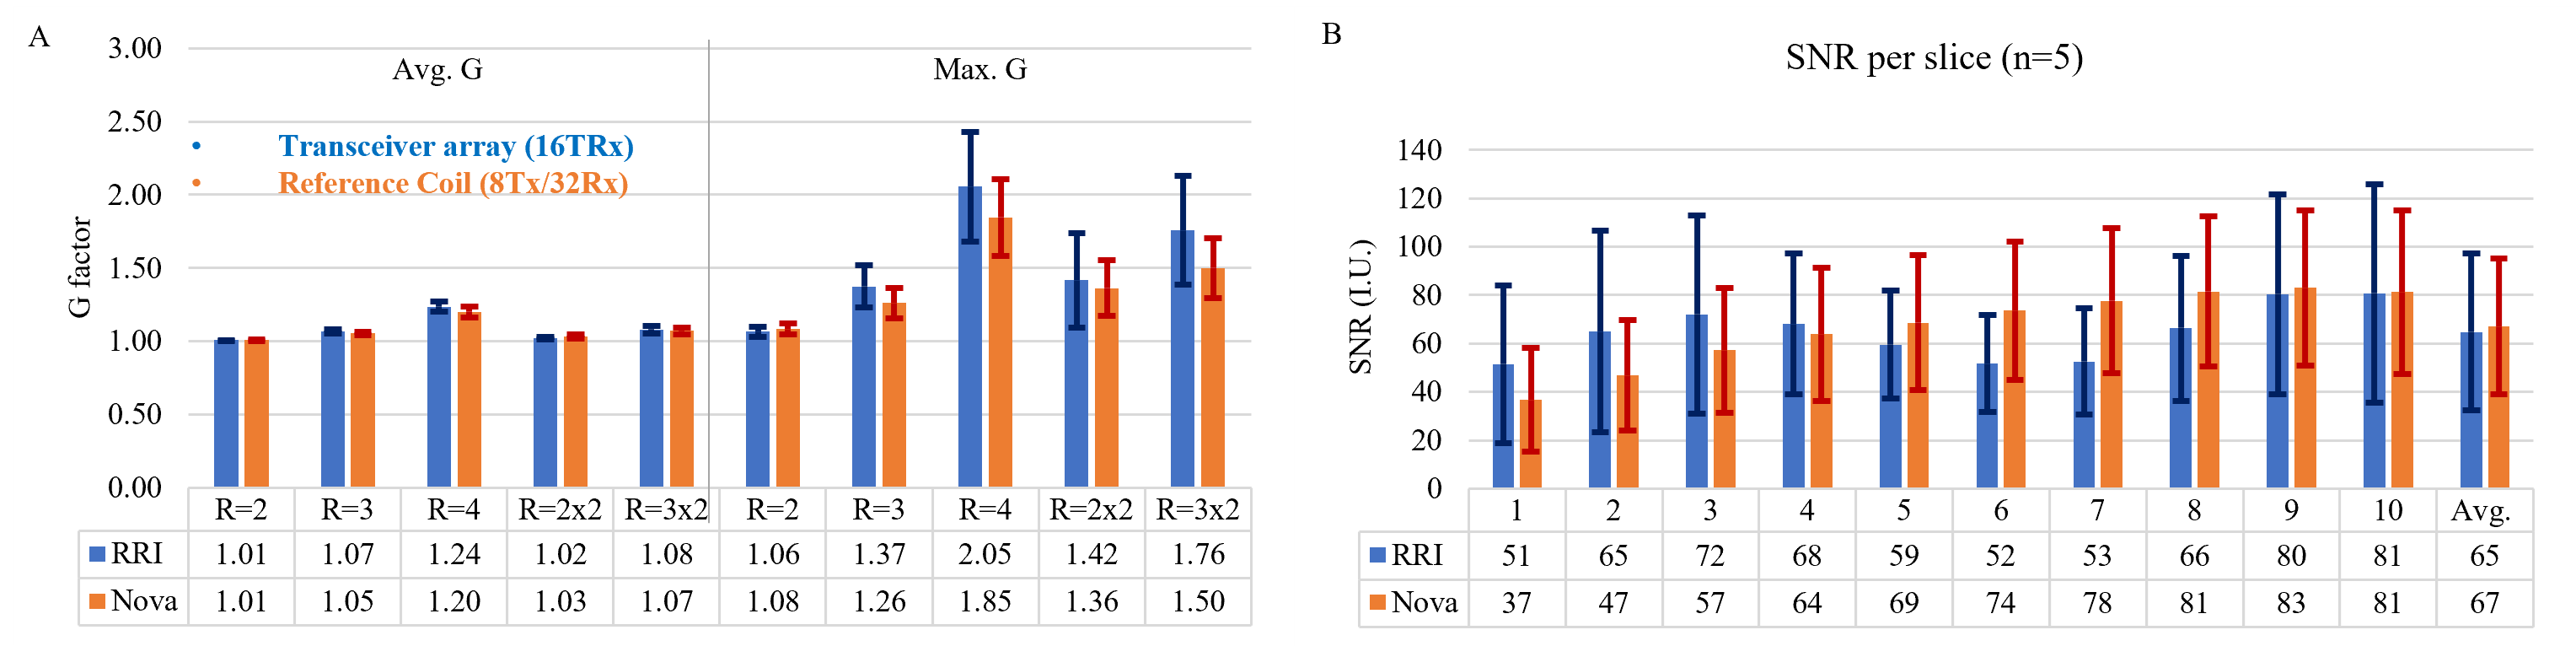
Noise Covariance: The transceiver array measured mean correlation of 10±5% for all channels and 11±6% for the 1st&2nd neighboring loops whereas 12±9% and 30±14% was measured in the reference coil respectively (Fig. 1).G maps: The average g for the transceiver array was similar to the reference coil with the max g at 9% higher in transceiver array (Fig. 2 and Table 1A).
SNR and B1+: The average SNR variation within the slice was higher in transceiver (CoV per slice = 0.49 vs 0.43, Fig. 3 and Table 1B) whereas the average SNR variation between slices was higher in the reference coil (0.17 vs 0.25, Fig. 3). Nonetheless, over the entire brain, there was no major difference in SNR (65 vs 67, Table 1B). For the B1+ performance, target FA@30°, the mean B1+ [degree] and CoV over the entire volume measured 29±5° vs 25±5° and 14±1% vs 20±2% (transceiver vs reference coil).
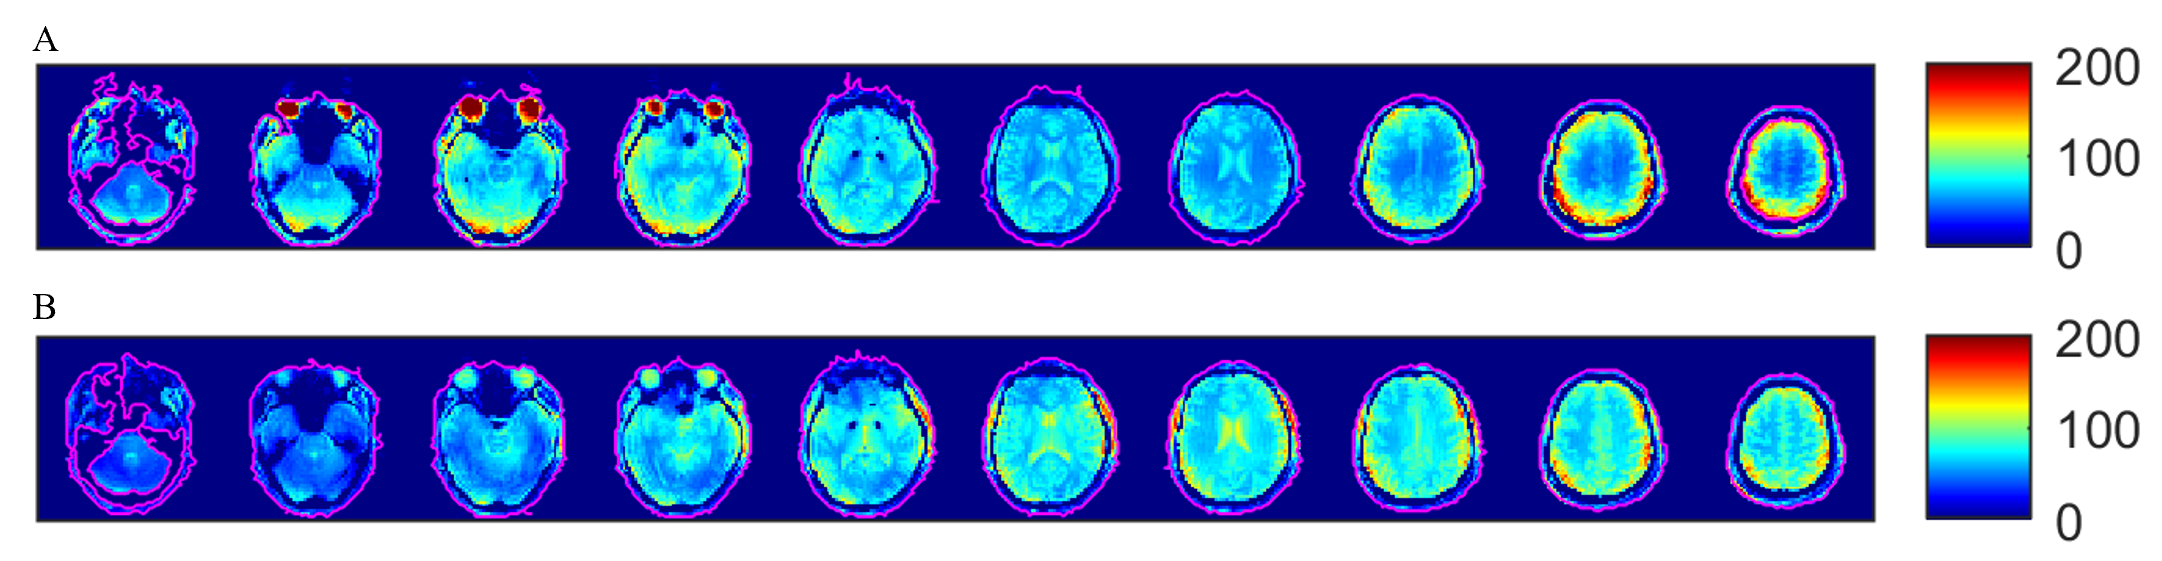
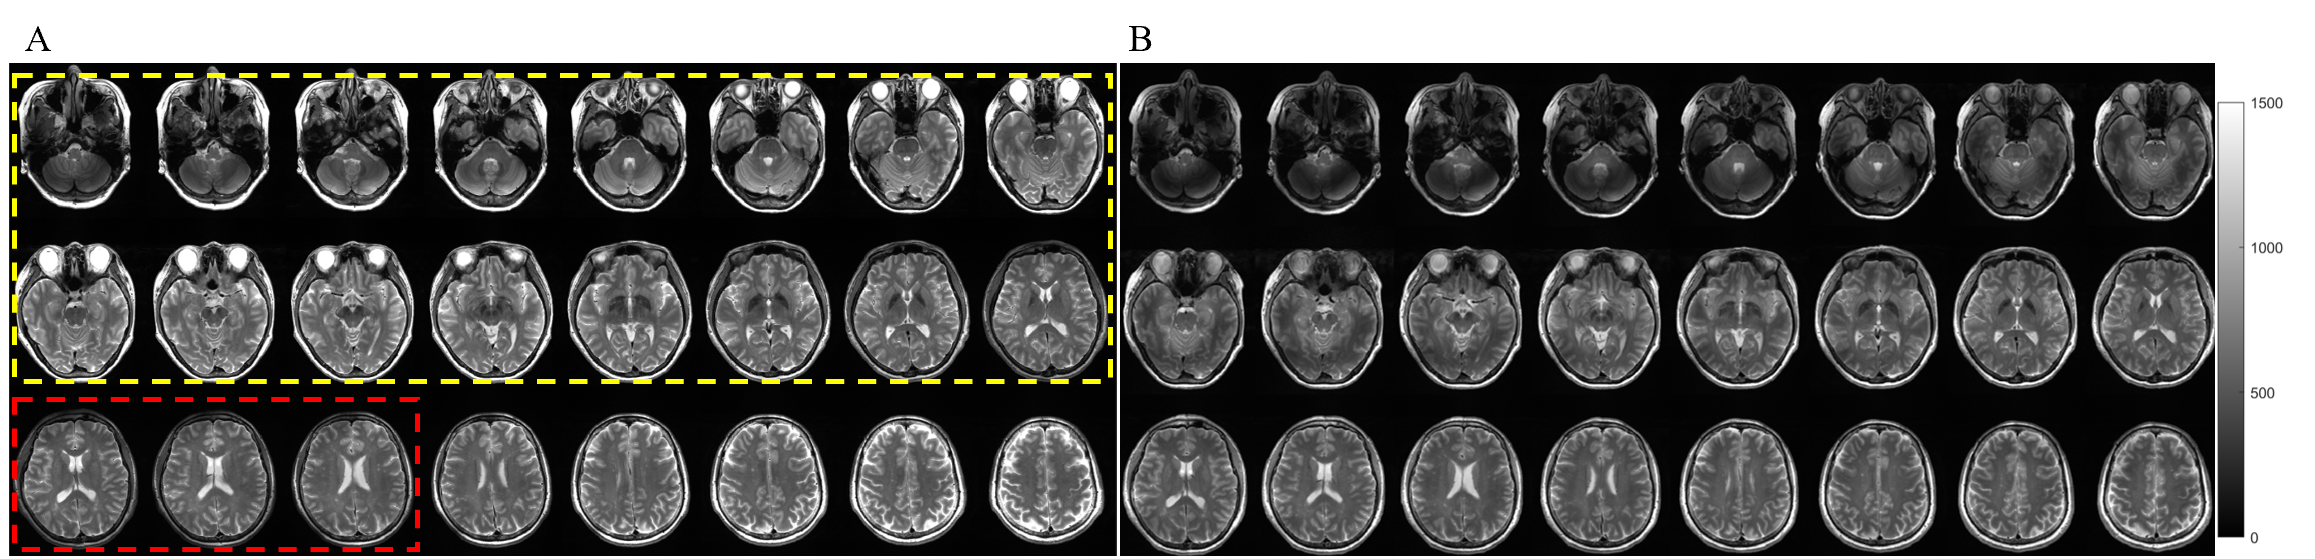
In vivo TSE imaging (R=3): High resolution T2W TSE imaging demonstrates that the transceiver array shows higher SNR in the low-mid brain area (yellow, Fig. 4). In the row-row gap region where no coil is present, a SNR drop was seen, substantially over the extracranial regions (red, Fig. 4). For superior brain areas, the SNR was similar.
Discussion
With the decoupling generated through reduction of the “true” mutual impedance in the transceiver, the noise covariance is significantly lower than the reference coil (Fig. 1). As calculated from the sensitivities and noise covariances, Fig. 2 compares the g-maps for R=2, 3, 4, 2x2, and 3x2 for the two coils. At R=4, the transceiver array calculated $$$ {SNR_p^{full}}/{SNR_p^{red}}=g_p\sqrt{R}=2.48 $$$ while reference coil calculated 2.40 respectively; for R=3x2, the estimated average SNR drop for transceiver and reference arrays were 2.65 and 2.62. These g-maps are consistent with the notion that the low noise covariance and high sensitivity lift the performance of the transceiver in spite of half the receive coil numbers than the reference array. A direct comparison of non-accelerated SNR (Fig. 3) shows that in the superior slices, the transceiver exhibits lower SNR centrally but higher SNR peripherally compared to the reference array, this being consistent with the ultimate intrinsic SNR analysis6. However in the more inferior slices, this central-peripheral SNR difference is less. Overall, the transceiver exhibits a larger SD of the SNR compared to the reference coil, 33 vs. 27 although the absolute average SNR was not significantly different, at 65±33 and 67±28 for the transceiver and reference coil respectively. With better B1+ performance1 and comparable g maps, comparison of in vivo TSE images (R=3) between the two arrays show the characteristics of the transceiver array: inferior brain regions with higher SNR (yellow, Fig. 4), inter-row slices with decreased SNR that is substantially extracranial (red, Fig. 4) and the remaining superior brain slices with similar SNR.Conclusion
We have evaluated receive characteristics and SNR of the transceiver array. In comparison with the commercial reference coil, the transceiver performs similarly in overall SNR and with the improved decoupling (despite 50% fewer Rx coils), the g maps are also comparable. With superior B1+ homogeneity (14% v 20%) and greater coverage in the head to foot direction, sequences utilizing spin echo acquisitions (which have enhanced pulse angle dependence) will show significantly improved image quality in inferior brain structures. For TSE images, contrast is better preserved and SNR is enhanced in the temporal lobe and cerebellum with the transceiver array in comparison to the reference coil.Acknowledgements
The authors are grateful to Bernd Stoeckel and John Grinstead from Siemens Healthineers (Siemens Healthcare, Erlangen, Germany) for the technical support and discussions. This work is supported by the National Institute of Health [R01-EB0244408]
References
1. Li X, Pan JW, Avdievich NI, Hetherington HP, Rispoli JV. Electromagnetic simulation of a 16‐channel head transceiver at 7 T using circuit‐spatial optimization. Magnetic Resonance in Medicine. 2021 Jun;85(6):3463-78.
2. Avdievich NI, Transceiver-phased arrays for human brain studies at 7 T. Applied magnetic resonance. 2011 Dec;41(2):483-506.
3. Avdievich, NI, Pan, J.W. and Hetherington, H.P. Resonant inductive decoupling (RID) for transceiver arrays to compensate for both reactive and resistive components of the mutual impedance. NMR Biomed., 2013, 26: 1547-1554.
4. Pruessmann, K.P., Weiger, M., Scheidegger, M.B. and Boesiger, P. (1999), SENSE: Sensitivity encoding for fast MRI. Magn. Reson. Med., 42: 952-962.
5. Kellman, P. and McVeigh, E.R. (2005), Image reconstruction in SNR units: A general method for SNR measurement. Magn. Reson. Med., 54: 1439-1447.
6. Lattanzi, R., Wiggins, G.C., Zhang, B., Duan, Q., Brown, R. and Sodickson, D.K. (2018), Approaching ultimate intrinsic signal-to-noise ratio with loop and dipole antennas. Magn. Reson. Med, 79: 1789-1803.
Figures