1406
Comparison of Capability for Therapeutic Outcome Prediction among CEST, DWI and PET/CT in Non-Small Cell Lung Cancer Conservative Therapy1Radiology, Fujita Health University School of Medicine, Toyoake, Japan, 2Joint Research Laboratory of Advanced Medical Imaging, Fujita Health University School of Medicine, Toyoake, Japan, 3Canon Medical Systems Corporation, Otawara, Japan, 4Diagnostic Radiology, Hyogo Cancer Center, Akashi, Japan, 5Fujita Health University Hospital, Toyoake, Japan, 6Fujita Health University School of Medicine, Toyoake, Japan
Synopsis
Keywords: Lung, Cancer, CEST
We hypothesize that CEST imaging has a potential for therapeutic outcome prediction in NSCLC patients treated with chemoradiotherapy and may play as one of the predictors in this setting. The purpose of this study was to compare the capability for therapeutic outcome prediction among CEST imaging, DWI and FDG-PET/CT in NSCLC patients with conservative therapy.Introduction
In the last a few decades, FDG-PET or PET/CT and MRI including DWI and dynamic first-pass CE perfusion MRI as well as dynamic first-pass CE-perfusion CT have potentials for therapeutic effect evaluation or prediction in non-small cell lung cancer (NSCLC) patients (1). On the other hands, chemical exchange saturation transfer (CEST) imaging at 3.5 ppm (APTw imaging) has been suggested as one of the MR-based molecular imaging techniques in not only brain, but also body field in the last decade. CEST Imaging can be performed on proteins, amino acids and DNAs including chemical exchangeable protons such as hydroxyl protons (-OH: ~1ppm), amine protons (-NH2: ~2ppm) and amide protons (R-C(=O)-NH2 or R-C(=O)-NHR1 <R ≠ H>: ~3.5ppm) (2, 3). In addition, Ohno, et al tested the capability of APTw imaging for diagnosis of pulmonary nodule (4, 5). However, no major reports have been evaluated the capability for therapeutic outcome prediction among CEST imaging, DWI and FDG-PET/CT in NSCLC patients treated with conservative therapy. We hypothesize that CEST imaging has a potential for therapeutic outcome prediction in NSCLC patients treated with chemoradiotherapy and may play as one of the predictors in this setting. The purpose of this study was to compare the capability for therapeutic outcome prediction among CEST imaging, DWI and FDG-PET/CT in NSCLC patients with conservative therapy.Materials and Methods
Eight-four consecutive Stage III NSCLC patients with conservative therapy, 45 men (age range, 62-75 years; mean age, 71 years) and 39 women (age range, 57-75 years; mean age, 70 years) were included and underwent CEST imaging, DWI, FDG-PET/CT, and chemoradiotherapy and follow-up examinations. Based on the results of follow up examination, all patients were divided into responder (n=65) and non-responder (n=19) groups. To obtain CEST data in each subject, respiratory-synchronized FASE imaging was conducted following a series of magnetization transfer (MT) pulses. Then, magnetization transfer ratio asymmetry (MTRasym) was calculated from z-spectra in each pixel, and MTRasym map was computationally generated. To obtain radiological indexes on CEST imaging, DWI and PET/CT, ROIs were placed over each targeted lesion, and determined MTRasym, apparent diffusion coefficient (ADC) and maximum standard uptake value (SUVmax). To compare difference of each index between responder and non-responder groups, MTRasym, ADC and SUVmax, were compared by Student’s t-test. Each threshold value was used to compare progression-free survival (PFS) and overall survival (OS) for the two groups as assessed by each method by using the Kaplan-Meier method followed by log rank test. A Cox proportional hazards regression analysis was used to estimate hazard ratios (HRs) for gender, age, performance status, histological subtype, tumor staging and all indexes. A p value less than 0.05 was considered as significant in this study.Results
Representative cases are shown in Figures 1. Comparison of each index between responder and non-responder groups is shown in Figure 2. MTRasym, ADC and SUVmax had significant difference between responder and non-responder groups (p<0.0001). Compared results of PFS and OS between responder and non-responder groups divided by each method are shown in Figure 3. When applied each feasible threshold value, PFS of responder group on each method had significant longer than that of non-responder group (MTRasym, ADC and SUVmax: p<0.0001). OS of responder group on each method had significant longer than that of non-responder group (MTRasym: p=0.0009, ADC: p=0.04, SUVmax: p=0.04). Results of Cox proportional hazard regression analysis for PFS and OS are shown in Figure 4. On PFS prediction, SUVmax (HR=1.41, p=0.0004) and MTRasym (HR=0.70, p=0.02) were determined as significant and independent predictors. For OS prediction, tumor staging (HR=0.57, p=0.02) and MTRasym (HR=0.76, p=0.04) were determined as significant and independent predictors.Conclusion
CEST imaging at 3.5ppm (APw imaging) is equally or more useful than DWI and FDG-PET/CT for therapeutic outcome predicting in stage III NSCLC patients with chemoradiotherapy. MTRasym may be capable of functioning as an independent predictor of PFS and OS as well as SUVmax or tumor staging for NSCLC patients treated with chemoradiotherapy.Acknowledgements
This study was financially and technically supported by Canon Medical Systems Corporation.References
- Ciliberto M, Kishida Y, Seki S, Yoshikawa T, Ohno Y. Update of MR Imaging for Evaluation of Lung Cancer. Radiol Clin North Am. 2018;56(3):437-469.
- van Zijl PC, Yadav NN. Chemical exchange saturation transfer (CEST): what is in a name and what isn't? Magn Reson Med. 2011 Apr;65(4):927-948.
- Zhou J, Heo HY, Knutsson L, van Zijl PCM, Jiang S. APT-weighted MRI: Techniques, current neuro applications, and challenging issues. J Magn Reson Imaging. 2019;50(2):347-364.
- Ohno Y, Yui M, Koyama H, et al. Chemical Exchange Saturation Transfer MR Imaging: Preliminary Results for Differentiation of Malignant and Benign Thoracic Lesions. Radiology. 2016; 279(2): 578-589.
- Ohno Y, Kishida Y, Seki S, et al. Amide proton transfer-weighted imaging to differentiate malignant from benign pulmonary lesions: Comparison with diffusion-weighted imaging and FDG-PET/CT. J Magn Reson Imaging. 2018; 47(4): 1013-1021.
Figures
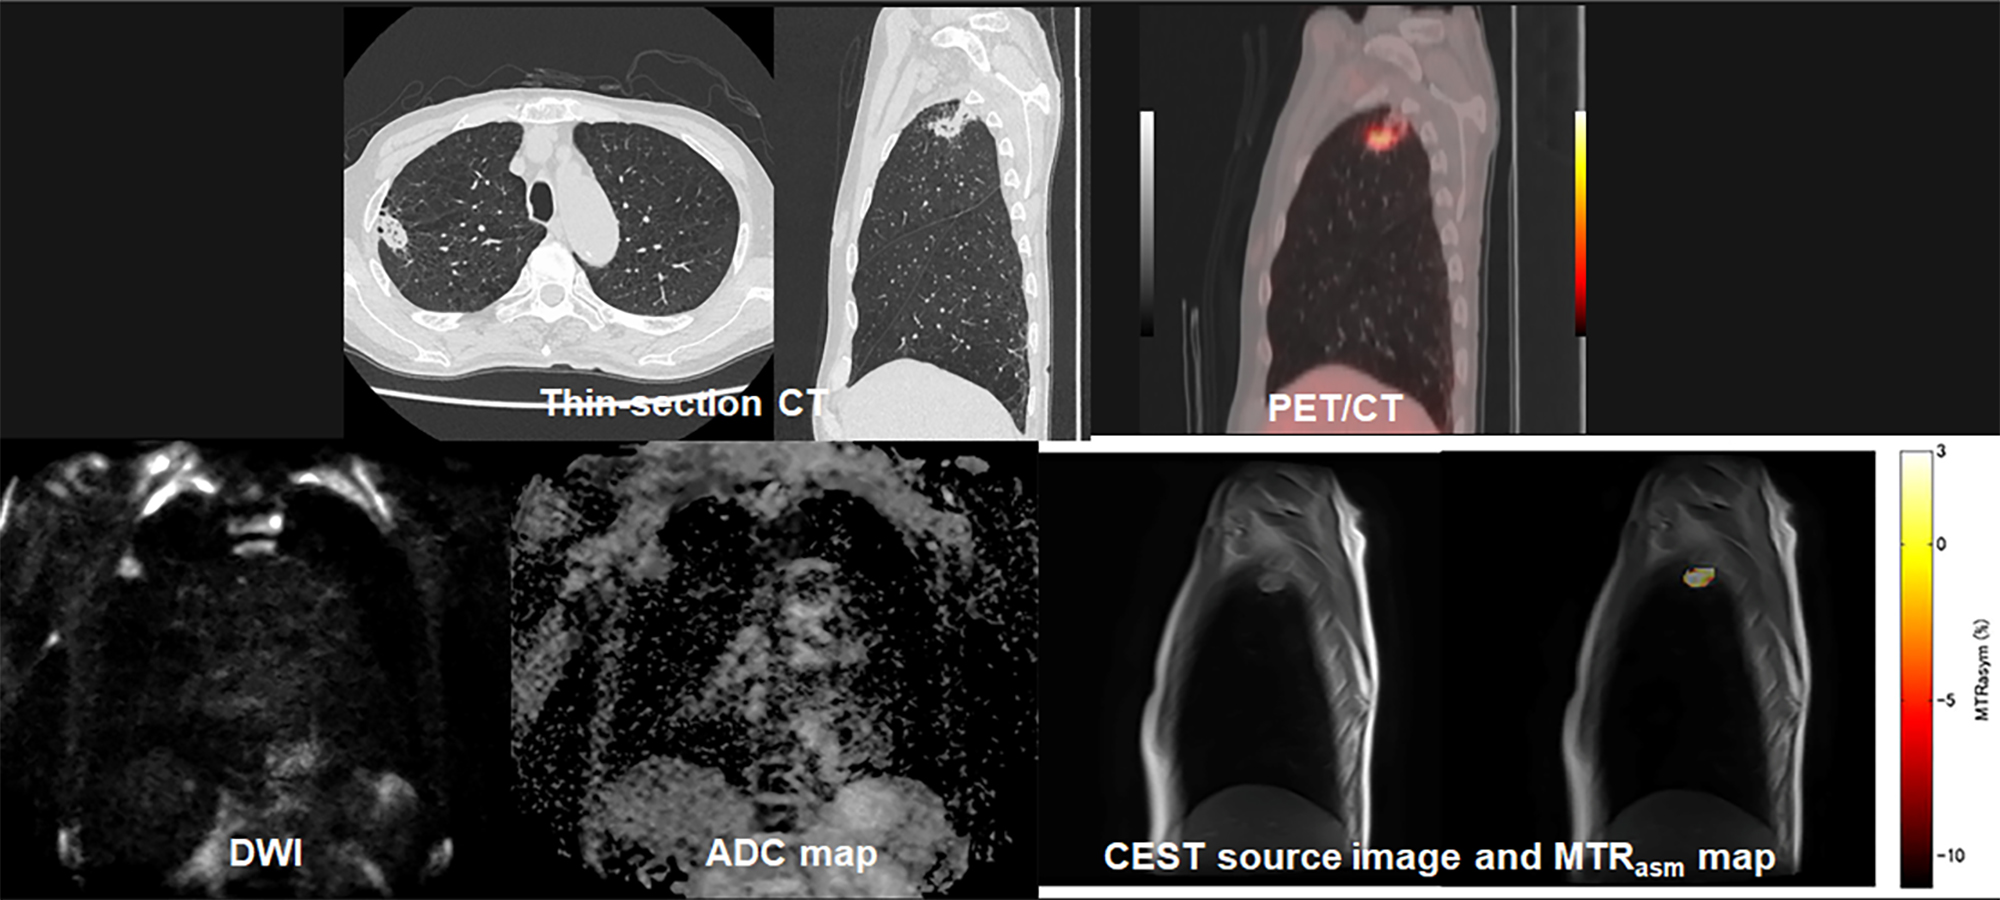
Figure 1. 62-year-old male with invasive adenocarcinoma and determined as responder.
Thin-section CT shows a nodule in the right upper lobe. This nodule was pathologically diagnosed as invasive adenocarcinoma. PFS and OS in this case were 54 months and 54 months. SUVmax of this nodule was 3.4. DWI shows a nodule with high signal intensity. ADC map demonstrate the nodule as low ADC, and ADC value was assessed as 1.15×10⁻³mm2/s. APTw map shows the nodule as high MTRasym. MTRasym was determined as with the value of 1.53.
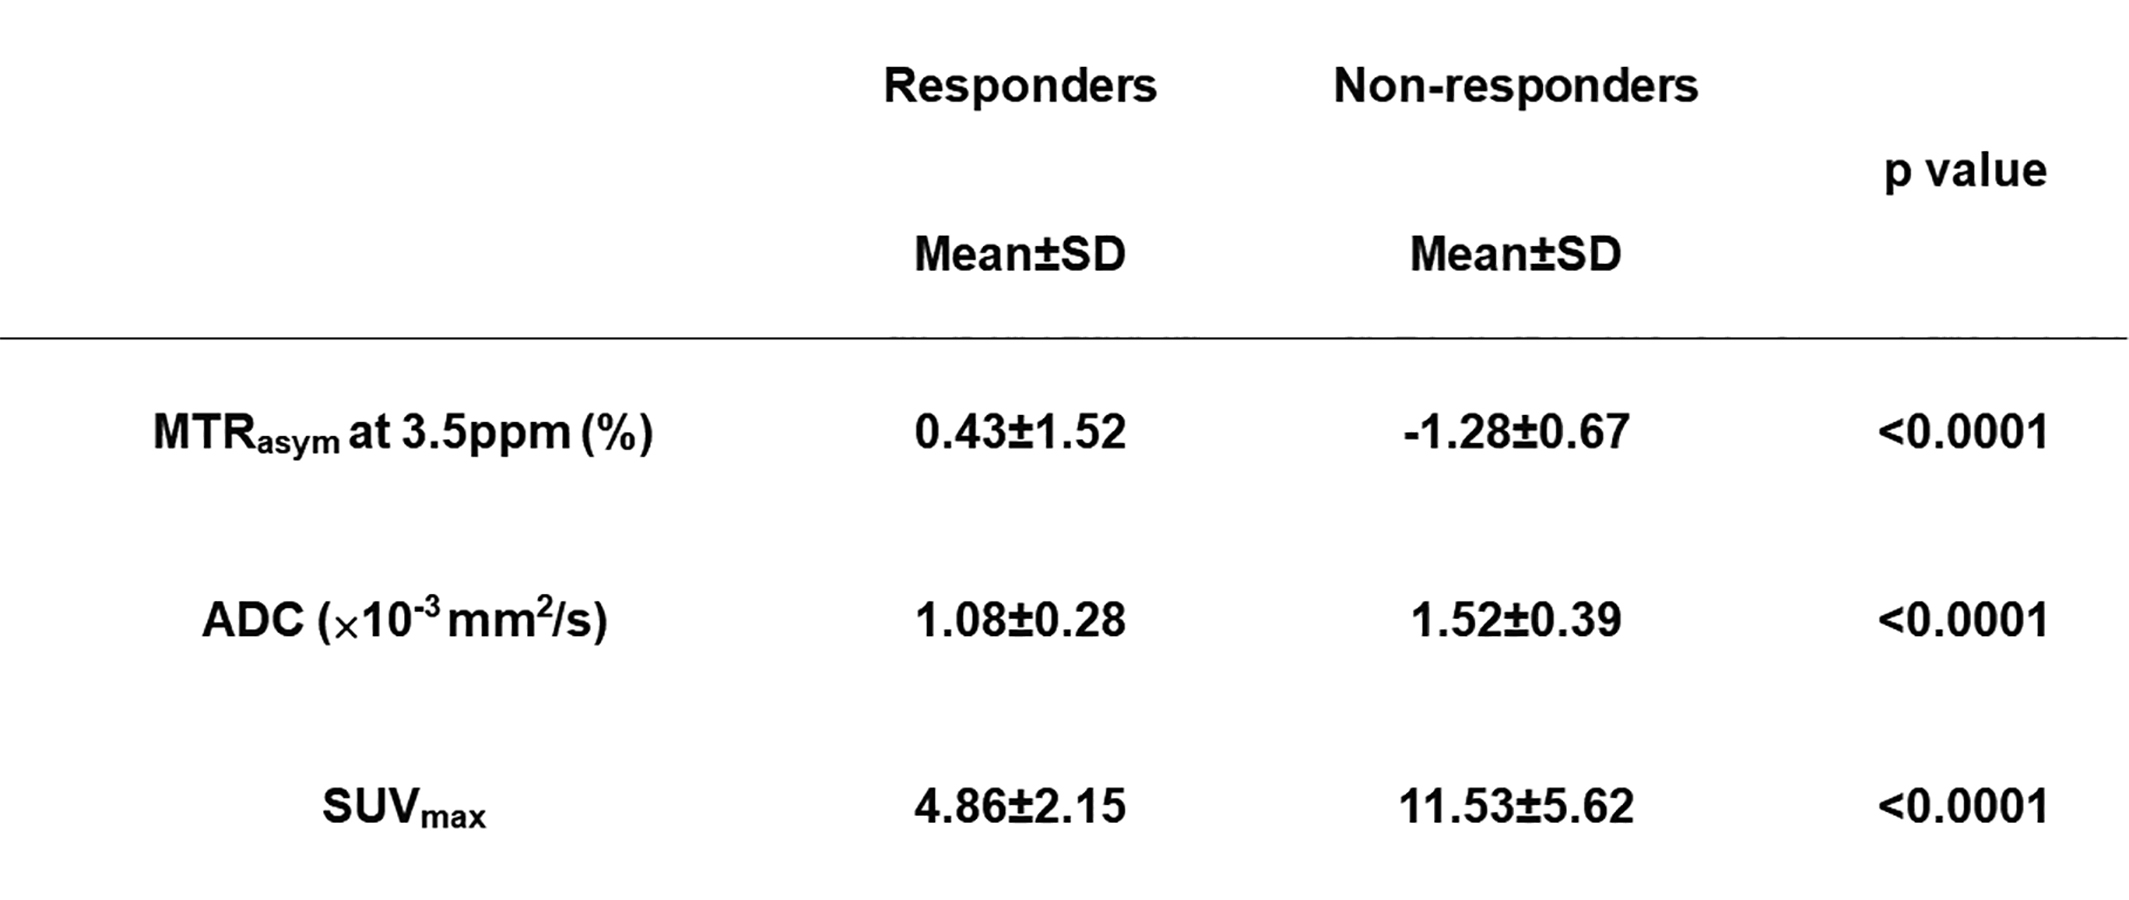
Figure 2. Comparison of each index between responder and non-responder groups.
All indexes had significant difference between responder and non-responder groups (p<0.0001).
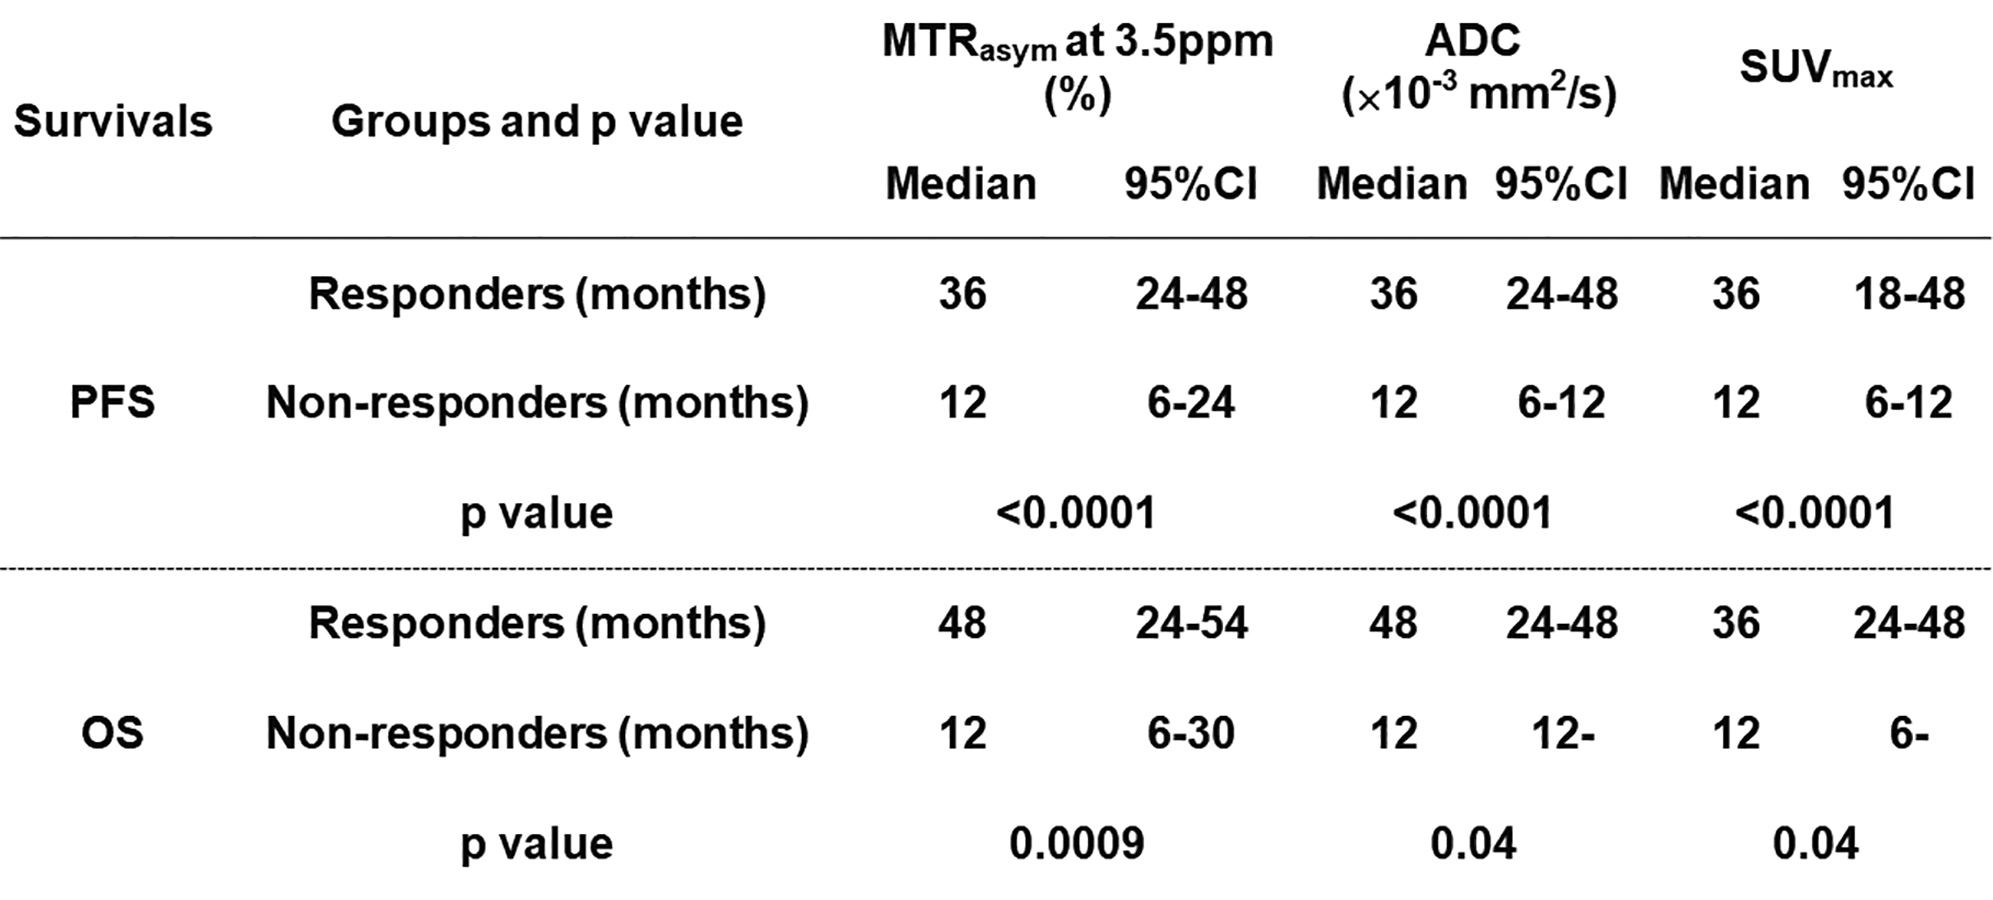
Figure 3. Compared results of PFS and OS between responder and non-responder groups divided by each method.
When applied each feasible threshold value, PFS and OS of responder group on each method had significant longer than those of non-responder group (p<0.05).
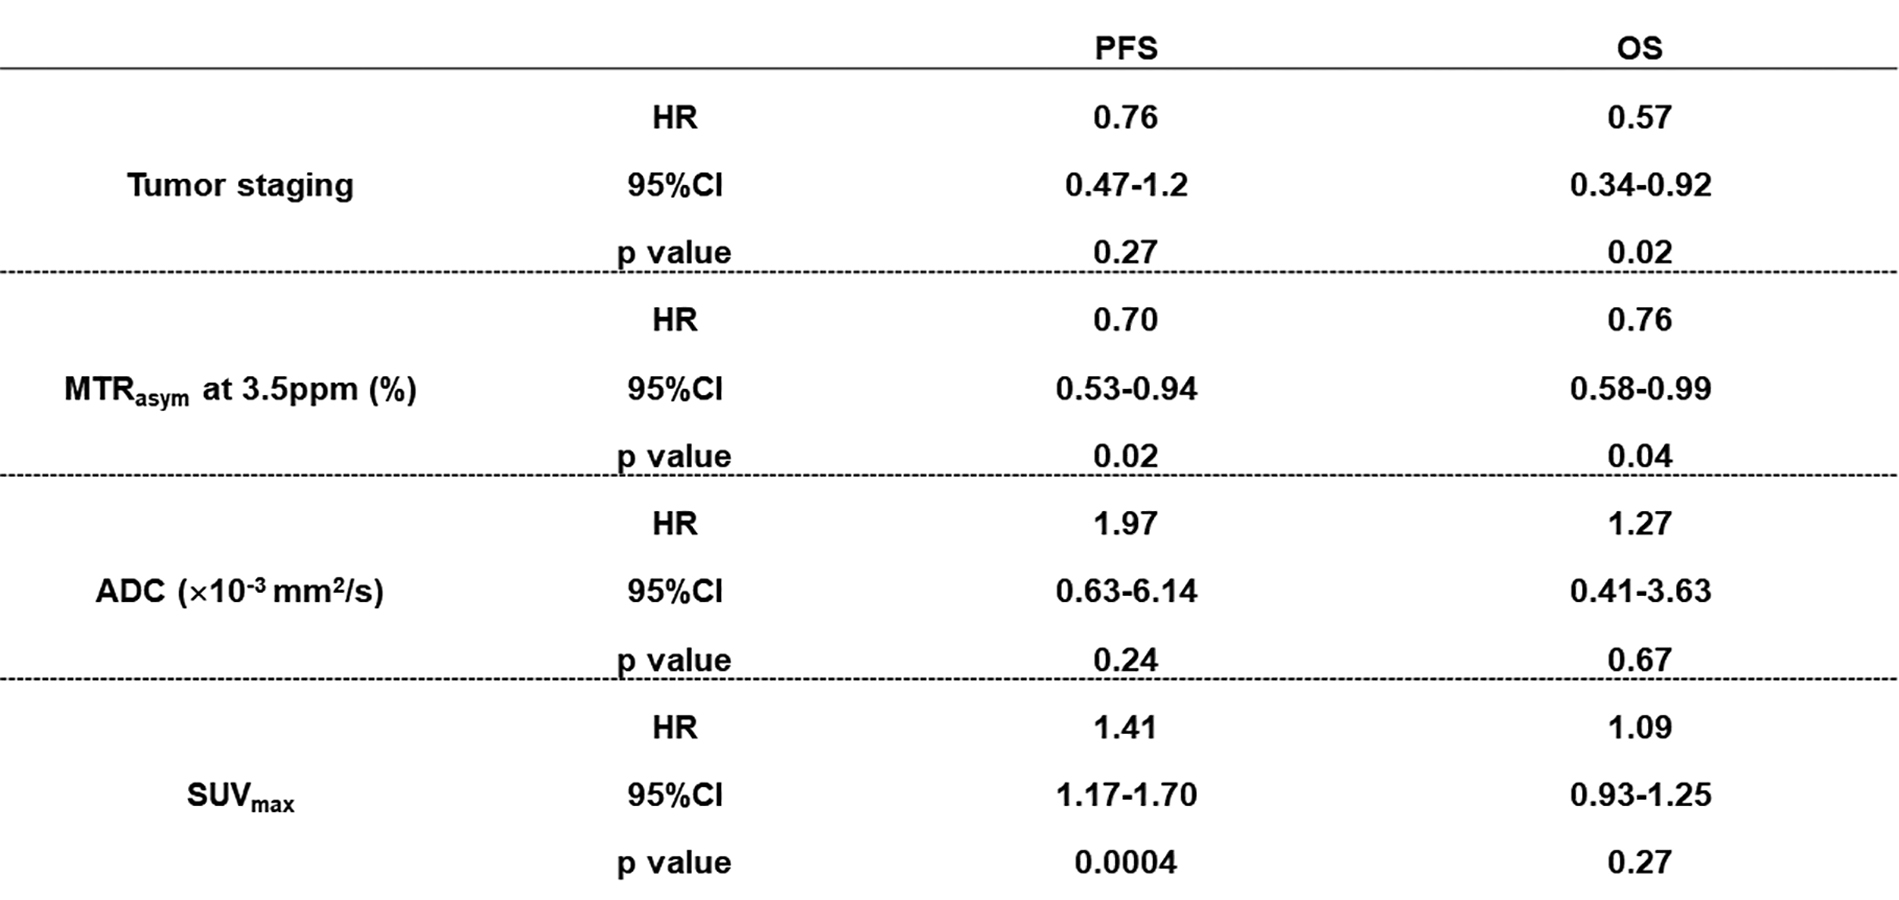
Figure 4. Results of Cox proportional hazard regression analysis for PFS and OS.
SUVmax (HR=1.41, p=0.0004) and MTRasym (HR=0.70, p=0.02) were determined as significant and independent predictors for PFS. Moreover, tumor staging (HR=0.57, p=0.02) and MTRasym (HR=0.76, p=0.04) were determined as significant and independent predictors for OS.