1405
Nominal respiratory features in spontaneous breathing: Towards multiparametric atlases with 3D MR spirometry in healthy volunteers1Université Paris-Saclay, CEA, CNRS, Inserm, BioMaps, Orsay, France, 2Hôpital Bicêtre, APHP, Le Kremlin-Bicêtre, France, 3GE Healthcare, Buc, France
Synopsis
Keywords: Lung, Quantitative Imaging, Spirometry
Three-dimensional MR spirometry fosters a double paradigm shift upon standard spirometry: from forced to free breathing and from global to local measurements. The technique makes use of voxel-wise flow-volume loops and original biomechanical markers to characterize the regional lung function. Over a diverse adult population, nominal common features showed up throughout 3D MR spirometry parametric maps in healthy volunteers spontaneously breathing in supine and prone positions. Euclidian barycenter and standard deviation maps of local tidal volumes, spontaneous expiratory peak flows, and anisotropic deformation indices are presented here as the ground for a unique atlas of the lung function.Introduction
Spirometry is a standard exam in pulmonary function testing to assess the efficiency of global ventilation from flow-volume loops measured at the mouth during forced respiratory cycles. The scalar nature of its measurement may not be sensitive to regional pulmonary alterations when overcome by neighboring healthy regions yielding nominal spirometry results [1]. Ventilation is essentially three-dimensional and most pathophysiological phenomena are spatially distributed. Ventilation imaging generally produces binary defect maps [2]. These maps result from thresholding the global parameter histogram without considering the nominal ventilation inhomogeneities that arise along spontaneous breathing and external conditions like gravity. The dependent region is known to contribute the more to ventilation [3, 4].Three-dimensional MR spirometry [5] was performed over a small but diverse healthy population spontaneously breathing in supine and prone positions to investigate nominal respiratory maps for functional and mechanical parameters. We only report here maps of tidal volume (TV), spontaneous expiratory peak flow (SEPF), and anisotropic deformation index (ADI) maps.
Methods
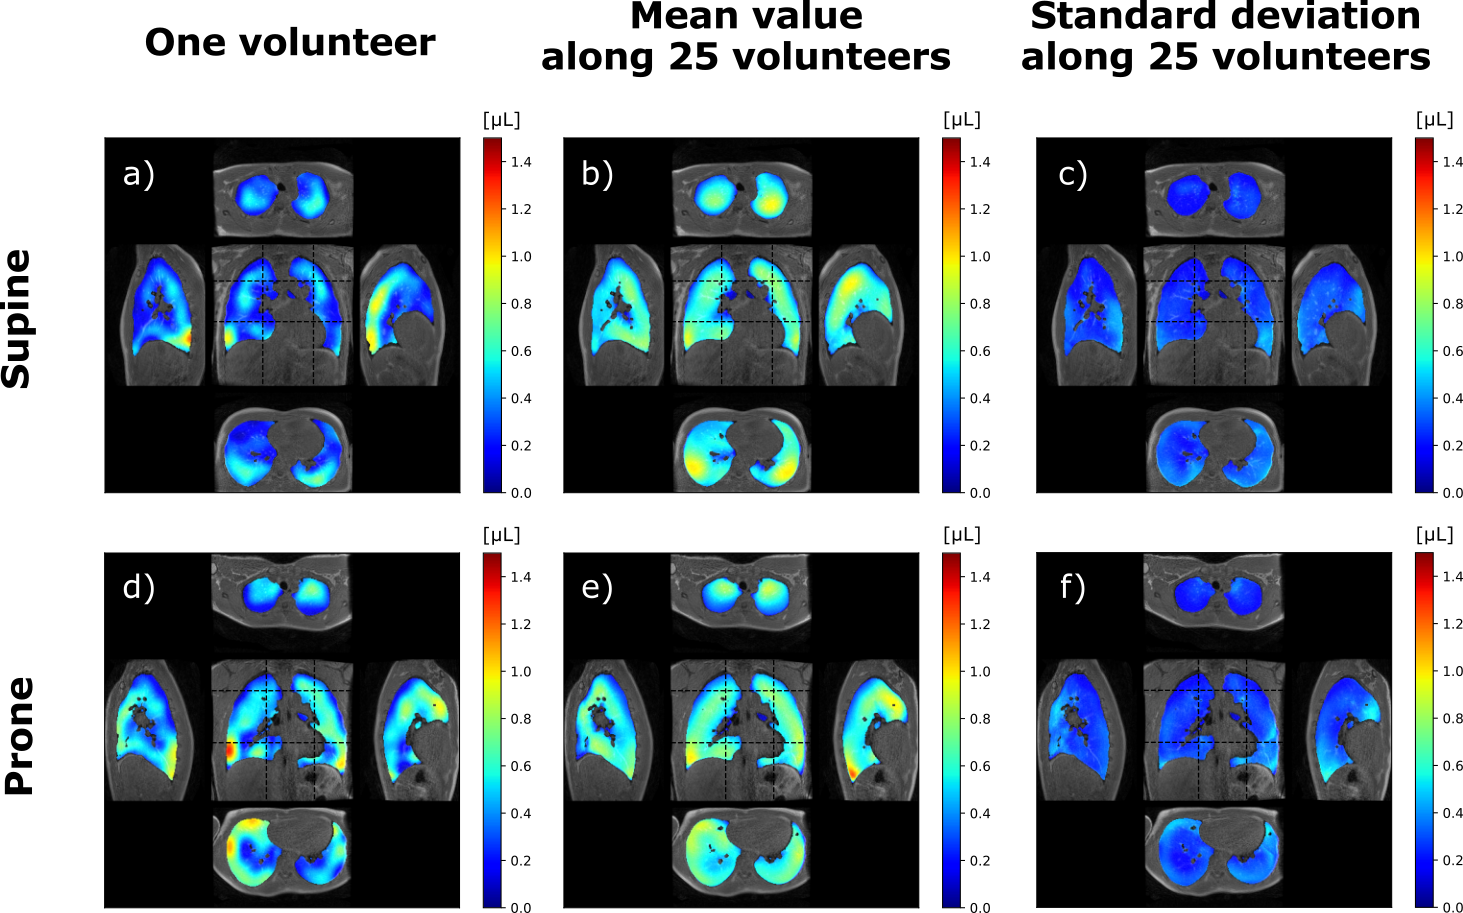
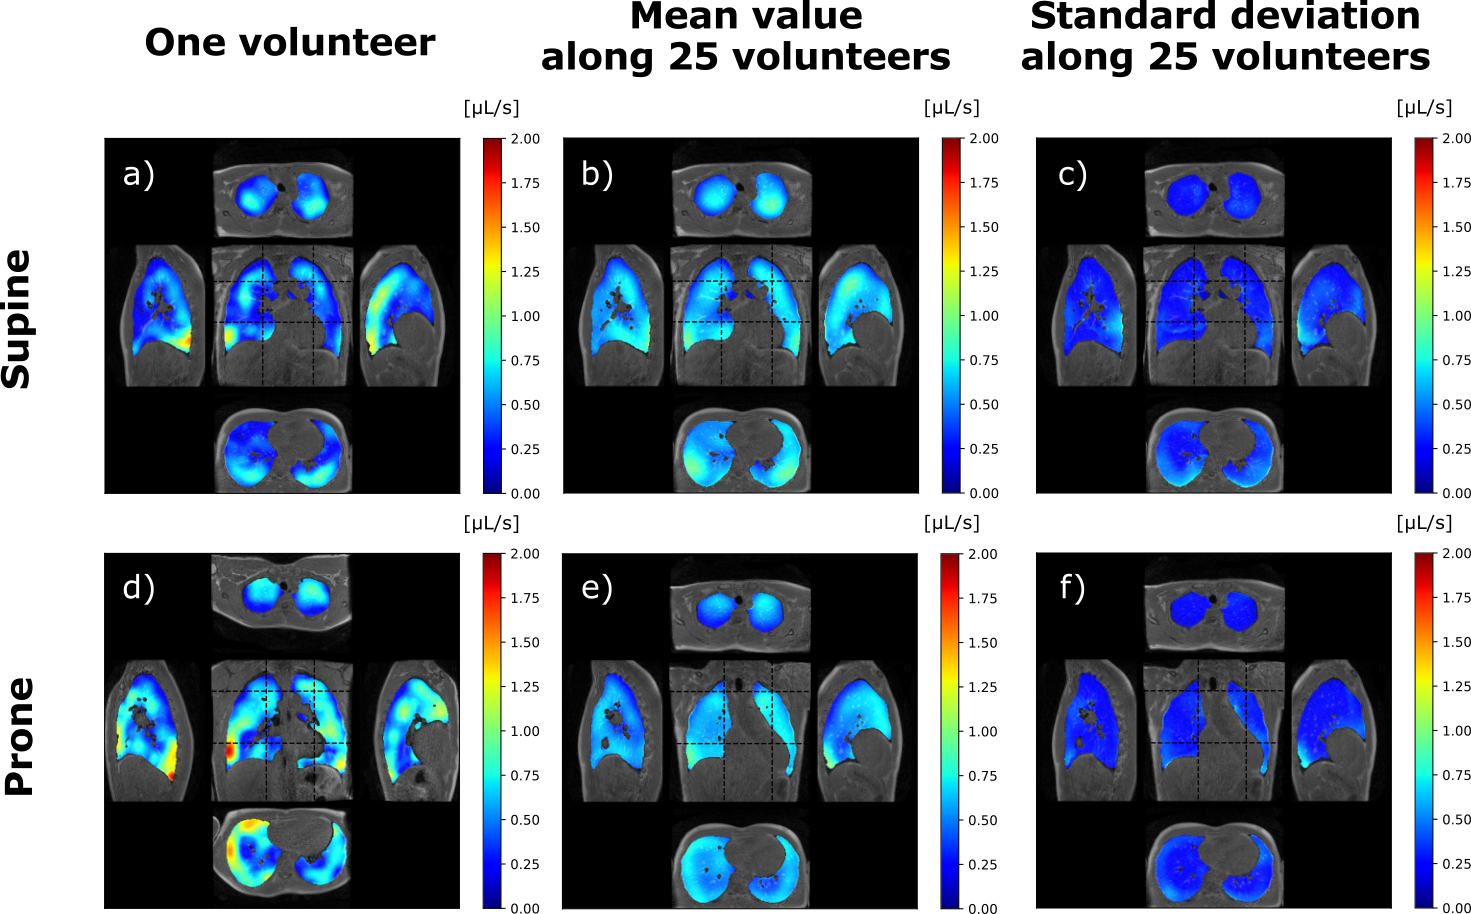
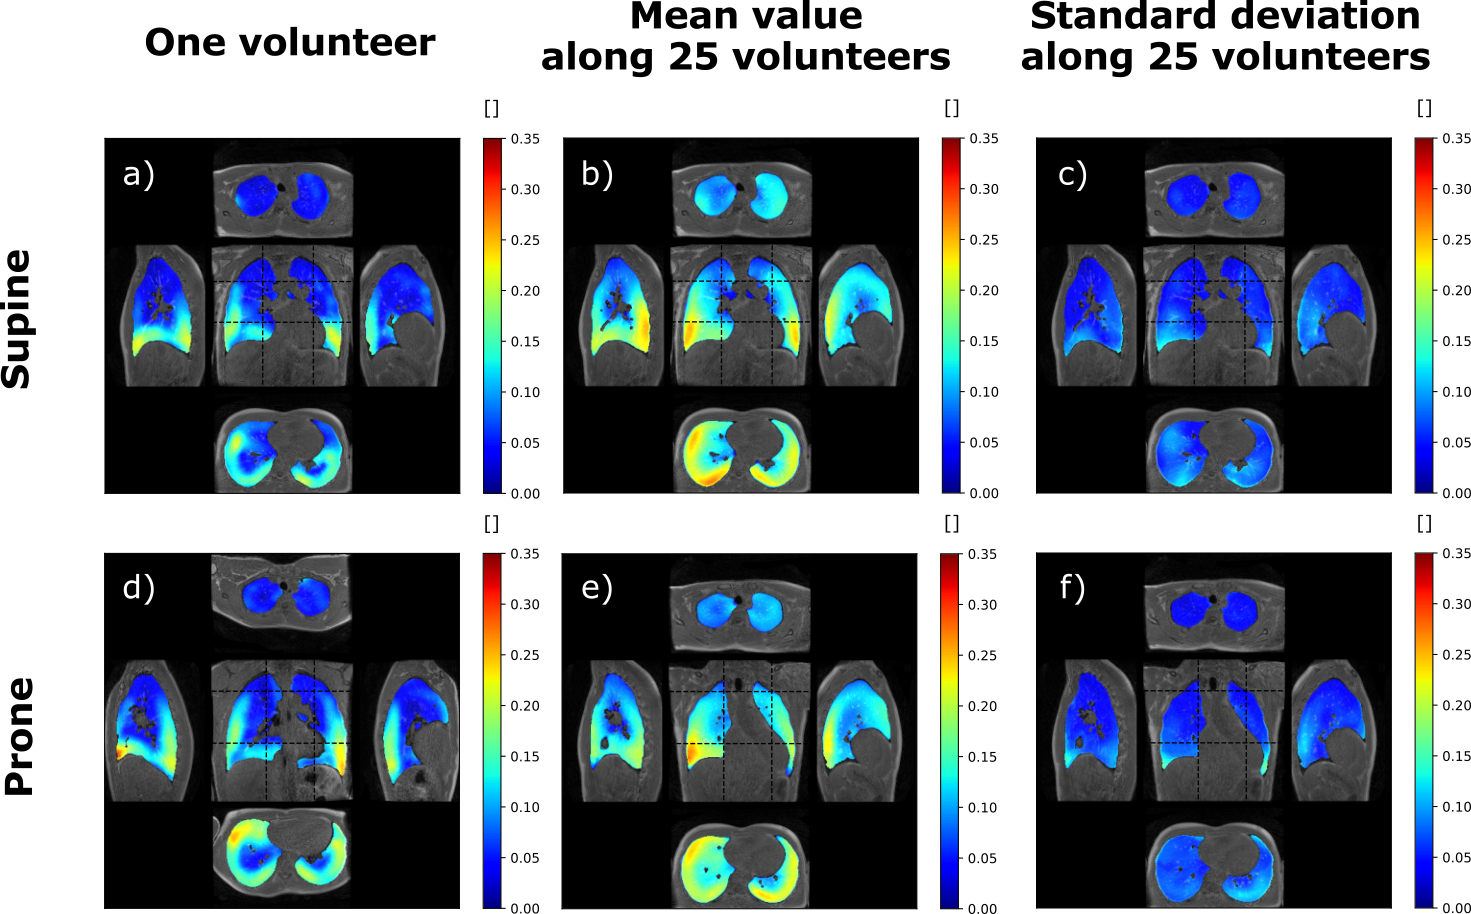
Ten-minute dynamic lung MRI acquisitions were performed on 25 healthy asymptomatic volunteers (10 females, 15 males; 45 ± 17 y/o; 24 ± 2.9 kg/m² BMI). The volunteers were asked to spontaneously breathe while they underwent 4 successive acquisitions: two repeated in supine position and two repeated in prone position. The study was performed at 3 T (GE Signa PET/MR) using a UTE sequence combined with AZTEK trajectory4, and a 30-channel thoracic coil for signal reception. Main parameters were µs, ms, flip angle °, bandwidth kHz, voxel size mm isotropic, matrix . During the acquisition, the respiratory function was monitored using the signal of an abdominal belt. Its average amplitude and frequency were computed over each acquisition.A self-navigator was extracted from the center of the acquired k-space to retrospectively gate the MR data into respiratory phases, resulting into 32 dynamic images of an integrated respiratory cycle over the acquisition. The strain tensor was estimated by elastic registration between the images of each temporal phase. Parametric maps characterizing the respiratory function were then derived along the respiratory cycle: local ventilatory volumes were inferred from the Jacobian of the strain tensor, and local flow rates were temporally derived from the associated volume variations. Flow-volume 3D maps and full characterization of the local ventilation were produced, and mechanical parameters from the Green-Lagrange tensor were also extracted. In this study, we computed the maps, the mean values and standard deviation of three main parameters: TV, SPEF, and ADI.
Intra-volunteer repeatability was assessed on the respiratory belt and global measurements. Inter-volunteer reproducibility was assessed on spatially and TV-normalized parameters. Spatial normalization was performed using elastic registration of the MR magnitude images to a reference dataset in supine or prone positions. The variability of spontaneous breathing was accounted for by normalizing the parametric maps to the total TV of the reference dataset. The mean 3D map and its associated standard deviation were computed along volunteers for every parameter. Correlation coefficient and mutual information were evaluated between the population mean maps and individual parameters. The analysis was refined by three age classes: lower than 31, between 31 and 49, greater than 49 y/o.
Results
The amplitude and frequency mean values for the respiratory belt vary in average by 8% and 11% respectively whereas the mean values for TV, SPEF, and ADI vary between 2.1% and 7.7%. Total mean TVs are smaller in supine than in prone with 556 mL and 616 mL whereas corresponding mean local flows are (0.60±0.16) µL·s-1 and (0.54±0.13) µL·s-1, respectively. The mean TV is 17.6% higher in the posterior than in the anterior regions in supine whereas it is 8.6% smaller in prone. The gravity dependence varies between age classes: 15.5%, 16.5% and 24.5% in supine and 3.6%, 10.2% and 13.2% in prone. TV, SPEF and ADI were sensitive to gravity (p-value < 0.05 with a paired Wilcoxon test) for both positions. The parameter spatial distribution for each acquisition are fairly represented by the mean maps over the population with a mutual information of 0.61±14 and 0.58±0.15 and a correlation coefficient of 0.63±0.07 and 0.65±0.04 in supine and prone.Discussion and conclusion
3D MR Spirometry is sensitive to gravity lung dependence and repeatable. With TV and spatial normalizations, the reproducibility shows a very good spatial consistency of respiratory patterns along volunteers. We found higher ventilation in the gravity dependent region and in lobes proximal to diaphragm. The right lung, with its three lobes, contributes more to the global ventilation. The ventilation is more anisotropic in the borders of the lung lobes where parenchyma is more constrained along inferior-superior axis. The lung geometry clearly plays a role in the spatial distribution of ventilation [6] in addition to the age expected variations [7]. These results pave the way to an atlas of nominal breathing in healthy volunteers.Acknowledgements
Peder Larson for UTE sequence. Financial support of the Exploratory Program of CEA. The PET/MR platform is affiliated to the France Life Imaging network (grant ANR-11-INBS-0006).References
[1] Bannier E, Cieslar K, Mosbah K, et al. Hyperpolarized 3He MR for sensitive imaging of ventilation function and treatment efficiency in young cystic fibrosis patients with normal lung function. Radiology. 2010;255(1):225-232. doi:10.1148/radiol.09090039
[2] Parraga, G., Ouriadov, A., Evans, A., McKay, S., Lam, W. W., Fenster, A., ... & Santyr, G. (2007). Hyperpolarized 3He ventilation defects and apparent diffusion coefficients in chronic obstructive pulmonary disease: preliminary results at 3.0 Tesla. Investigative radiology, 42(6), 384-391.
[3] Bryan, A. C., Milic-Emili, J., & Pengelly, D. (1966). Effect of gravity on the distribution of pulmonary ventilation. Journal of Applied Physiology, 21(3), 778-784.
[4] Hopkins, S. R., Henderson, A. C., Levin, D. L., Yamada, K., Arai, T., Buxton, R. B., & Prisk, G. K. (2007). Vertical gradients in regional lung density and perfusion in the supine human lung: the Slinky effect. Journal of applied physiology, 103(1), 240-248.de
[5] Boucneau, T., Fernandez, B., Larson, P., Darrasse, L., & Maître, X. (2020). 3D magnetic resonance spirometry. Scientific Reports, 10(1), 1-12.EB
[6] Galvin, I., Drummond, G. B., & Nirmalan, M. (2007). Distribution of blood flow and ventilation in the lung: gravity is not the only factor. British journal of anaesthesia, 98(4), 420-428.
[7] Guillien, A., Soumagne, T., Regnard, J., & Degano, B. (2018). Les nouvelles équations de référence du Global Lung Function Initiative (GLI) pour les explorations fonctionnelles respiratoires. Revue des Maladies Respiratoires, 35(10), 1020-1027.
Figures