1401
Retrospective analysis of Hyperpolarized 129Xe MRI Gas Exchange Images in Healthy and Post-COVID-19 Individuals acquired at Three Sites1Pulmonary, Critical Care, and Sleep Medicine, University of Kansas Medical Center, Kansas City, KS, United States, 2Department of Radiology, Duke University, Durham, NC, United States, 3Department of Medical Physics, Duke University, Durham, NC, United States, 4Centre for Heart Lung Innovation, St. Paul's Hospital, Vancouver, BC, Canada, 5Department of Radiology, University of British Columbia, Vancouver, BC, Canada, 6Division of Respiratory Medicine, University of British Columbia, Vancouver, BC, Canada, 7Division of Pulmonary Medicine, Duke University, Durham, NC, United States
Synopsis
Keywords: Lung, COVID-19
Gas exchange hyperpolarized 129Xe MRI (Xe-MRI) is increasingly being considered as an outcome measure in multi-site clinical trials, but there is limited evidence of between-site comparability. In this study, we analyzed 121 gas exchange Xe-MRI images in healthy and post-acute COVID-19 participants independently acquired at three sites. In healthy volunteers, quantitative Xe-MRI measures are indistinguishable across sites. In post-acute COVID-19, cross-site differences in Xe-MRI measures are evident but appear to be driven by differences in patient population. Moreover, Xe-MRI measures across sites correlate strongly with pulmonary function testing. These results support the feasibility of multi-site trials using gas exchange Xe-MRI.Introduction
Hyperpolarized 129Xe MRI (Xe-MRI) is gaining momentum as a non-invasive tool for visualizing lung structure and function,1 which is leading toward its use as an outcome measure in multi-site clinical trials.2 However, as most Xe-MRI studies have been performed at a single site, the multi-site reproducibility of Xe-MRI measures is unclear. Moreover, multi-site studies thus far have used ventilation imaging as their primary measure.3,4 Ventilation imaging, though effective for quantifying impairment in obstructive lung diseases (e.g. Cystic fibrosis, asthma, COPD),5-7 has limited utility in restrictive lung conditions, such as interstitial lung disease.8,9 As such, there is mounting interest in using gas exchange Xe-MRI as an outcome measure, making studies of multi-site comparability of paramount importance. In this study, three sites (Duke University (Site1), University of British Columbia (Site2), and University of Kansas Medical Center (Site3)) independently collected Xe-MRI gas exchange images in healthy subjects and post-acute COVID patients. Data were then pooled to assess the multi-site comparability of the collected images.Methods
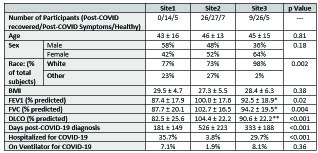
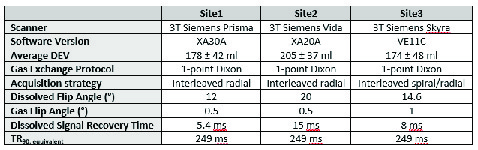
A total of 121 individuals were imaged across three sites, including both post-COVID-19 patients (Site1–14, Site2–53, Site3–37, total 104) and never-COVID-19 healthy controls (Site1–5, Site2–7, Site3–5, total 17). See Figure 1 for participant demographics, lung function, and COVID-19 status. Overall, patients had similar age and BMI. Patients at Site2 had higher pulmonary function tests (PFTs) (forced expiratory volume in 1s (FEV1), forced vital capacity (FVC), and diffusing capacity of the lung for carbon monoxide (DLCO)). Patients at Site1 were imaged nearer in time to COVID-19 diagnosis than at Site2 and Site3. Site2 had fewer patients who had been hospitalized for COVID-19. Imaging strategies are summarized in Figure 2. All imaging data were acquired on 3T Siemens MRI systems (Site1 – Prisma, Site2 – Vida, Site3 – Skyra). The hyperpolarized xenon dose equivalent volume (DEV)10 was higher at Site2 (205 ± 37) compared to Site1 (176 ± 35) and Site3 (175 ± 48) (p < 0.001). All Xe-MRI gas exchange images were acquired using the 1-point Dixon approach,11 though with non-harmonized protocols, owing to the data being acquired originally for single-site analysis. Site2 used parameters recommended by the 129Xe MRI Clinical Trials Consortium2, while Site1 used an accelerated method.12 Site3 used an interleaved spiral/radial approach that encodes a high-resolution ventilation image alongside gas exchange images.13 In all cases, the TR90,equiv was 249 ms, enabling comparison of gas exchange values.12,14 All data were processed by a single site (Site1).15 Statistical comparisons were performed using Analysis of Variance (ANOVA) for continuous variables, Kruskal-Wallis test for categorical variables, and linear regression.Results
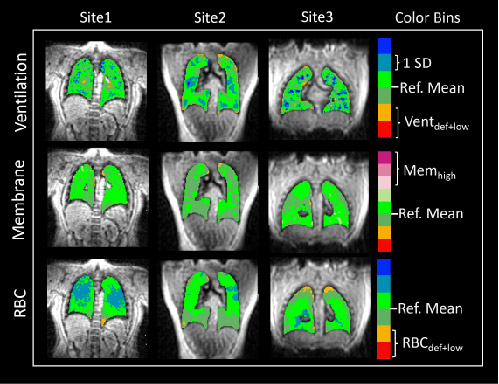
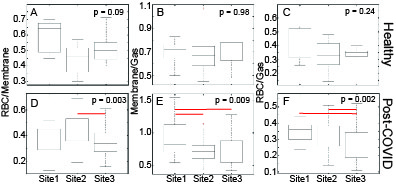
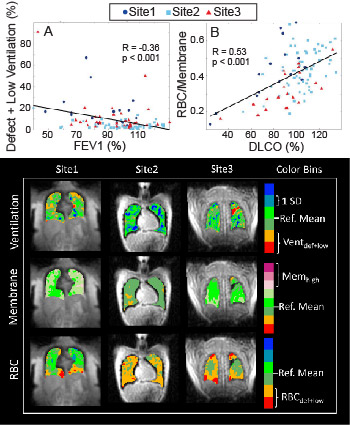
SNR/DEV was highest in images acquired at Site3 and lowest at Site1 for all three contrasts (Ventilation: p = 0.08; Membrane: p < 0.001; RBC: p < 0.001), but SNR was adequate for analysis in all cases. Figure 3 shows representative images of healthy individuals from each of the 3 sites. Healthy participants had comparable Xe-MRI results, with no ventilation defects (mean Ventilation Defect Percent (VDP): Site1: 0.4%, Site2: 0.0%, Site3: 0.0%), and no significant differences in RBC/Membrane (p = 0.09), Membrane/Gas (p = 0.98), or RBC/Gas (p = 0.24) (Figure 4). In post-COVID-19 participants, ventilation defects were similarly uncommon (mean VDP: Site1: 3.6%, Site2: 0.3%, Site3: 2.5%). More common were abnormal RBC/Membrane, Membrane/Gas, and RBC/Gas signal ratios.16-18 RBC/Membrane was comparable at Site1 and Site3, though Site3 had lower RBC/Membrane than Site2 (p = 0.004). Membrane/Gas was highest at Site1 (p = 0.04), and RBC/Gas was lowest at Site3 (p < 0.001). Consistent with previous studies,18,19 Xe-MRI measures correlated with PFTs, including Ventilation defect+low percent with FEV1 (R = -0.36, p < 0.001), Membrane/Gas with FVC (R = -0.41, p < 0.001), RBC/Gas with DLCO (R = 0.301, p = 0.003), and RBC/Membrane with DLCO (R = 0.53, p < 0.001) (Figure 5).Discussion
Gas exchange Xe-MRI measures including RBC/Membrane, Membrane/Gas, and RBC/Gas were similar in healthy participants across the 3 sites included in this analysis, which provides confidence in compiling Xe-MRI measures in patients with impaired lung function. Differences between Xe-MRI measures in COVID-19 participants between sites were largely explainable by the differences in the patient populations. For example, Site2 imaged patients with the highest mean lung function (FEV1, FVC, and DLCO >100% predicted) and showed the highest RBC/Membrane. Similarly, Site1 imaged patients with the poorest lung function, (FEV1, FVC, DLCO < 90%) and showed the highest mean Membrane/Gas. The one exception is that RBC/Gas values appear to tend toward higher values at Site1 compared to Site2 and Site3, which may be driven by the lower SNR observed at Site1. These observations are further supported by the correlations of Xe-MRI measures with PFTs, which show a relatively uniform distribution of Xe-MRI measures and PFTs across the three sites.Conclusion
We performed an analysis of gas exchange Xe-MRI images acquired in healthy volunteers and patients post-acute COVID-19 at 3 different sites. Despite minor differences in acquisition strategies and patient populations, data were comparable across sites, showing strong correlations with PFTs. With upcoming multi-site trials using this imaging technique, our results demonstrate the feasibility of between-site compilations of gas exchange Xe-MRI results towards answering clinically relevant questions.Acknowledgements
Translating Duke Health Cardiovascular Disease Initiative Award, Scleroderma Foundation New Investigator Award, AHA Career Development Award 930177, Canadian Institutes of Health Research (CIHR)References
1. Mugler JP, Altes TA. Hyperpolarized 129Xe MRI of the human lung. J Magn Reson Imaging 2013;37:313-31.
2. Niedbalski PJ, Hall CS, Castro M, et al. Protocols for multi-site trials using hyperpolarized 129Xe MRI for imaging of ventilation, alveolar-airspace size, and gas exchange: A position paper from the 129Xe MRI clinical trials consortium. Magn Reson Med 2021;86:2966-86.
3. Couch MJ, Thomen R, Kanhere N, et al. A two-center analysis of hyperpolarized 129Xe lung MRI in stable pediatric cystic fibrosis: Potential as a biomarker for multi-site trials. J Cyst Fibros 2019;18:728-33.
4. Svenningsen S, McIntosh M, Ouriadov A, et al. Reproducibility of Hyperpolarized 129Xe MRI Ventilation Defect Percent in Severe Asthma to Evaluate Clinical Trial Feasibility. Acad Radiol 2020.
5. Thomen RP, Walkup LL, Roach DJ, Cleveland ZI, Clancy JP, Woods JC. Hyperpolarized 129Xe for investigation of mild cystic fibrosis lung disease in pediatric patients. Journal of Cystic Fibrosis 2017;16:275-82.
6. Svenningsen S, Haider E, Boylan C, et al. CT and Functional MRI to Evaluate Airway;Mucus in Severe Asthma. CHEST 2019;155:1178-89.
7. Virgincar RS, Cleveland ZI, Kaushik SS, et al. Quantitative analysis of hyperpolarized 129Xe ventilation imaging in healthy volunteers and subjects with chronic obstructive pulmonary disease. NMR in Biomedicine 2013;26:424-35.
8. Weatherley ND, Eaden JA, Stewart NJ, et al. Experimental and quantitative imaging techniques in interstitial lung disease. Thorax 2019;74:611-9.
9. Wang Z, Bier EA, Swaminathan A, et al. Diverse Cardiopulmonary Diseases are Associated with Distinct Xenon MRI Signatures. Eur Respir J 2019:1900831.
10. He M, Robertson SH, Kaushik SS, et al. Dose and pulse sequence considerations for hyperpolarized 129Xe ventilation MRI. Magn Reson Imaging 2015;33:877-85.
11. Kaushik SS, Robertson SH, Freeman MS, et al. Single-Breath Clinical Imaging of Hyperpolarized Xe-129 in the Airspaces, Barrier, and Red Blood Cells Using an Interleaved 3D Radial 1-Point Dixon Acquisition. Magn Reson Med 2016;75:1434-43.
12. Niedbalski PJ, Lu J, Hall CS, et al. Utilizing flip angle/TR equivalence to reduce breath hold duration in hyperpolarized 129Xe 1-point Dixon gas exchange imaging. Magnetic Resonance in Medicine 2022;87:1490-9.
13. Niedbalski P, Hall C, Castro M. Hyperpolarized 129Xe Ventilation and Gas Exchange Images Acquired in a Single 10 s Breath-hold. Proc Intl Soc Mag Reson Med 2022:3389.
14. Ruppert K, Amzajerdian F, Hamedani H, et al. Assessment of flip angle–TR equivalence for standardized dissolved-phase imaging of the lung with hyperpolarized 129Xe MRI. Magn Reson Med 2019;81:1784-94.
15. Wang Z, Robertson SH, Wang J, et al. Quantitative analysis of hyperpolarized 129Xe gas transfer MRI. Med Phys 2017;44:2415-28.
16. Grist JT, Chen M, Collier GJ, et al. Hyperpolarized 129Xe MRI Abnormalities in Dyspneic Participants 3 Months after COVID-19 Pneumonia: Preliminary Results. Radiology 2021;301:E353-E60.
17. Grist JT, Collier GJ, Walters H, et al. Lung Abnormalities Depicted with Hyperpolarized Xenon MRI in Patients with Long COVID. Radiology;0:220069.
18. Matheson AM, McIntosh MJ, Kooner HK, et al. Persistent 129Xe MRI Pulmonary and CT Vascular Abnormalities in Symptomatic Individuals with Post-acute COVID-19 Syndrome. Radiology 2022;305:466-76.
19. Wang JM, Robertson SH, Wang Z, et al. Using hyperpolarized (129)Xe MRI to quantify regional gas transfer in idiopathic pulmonary fibrosis. Thorax 2018;73:21-8.
Figures