1400
Impaired xenon gas transfer observed one year after hospitalisation due to COVID-19 in patients with signs of interstitial lung disease.1The University of Sheffield, Sheffield, United Kingdom, 2University of Nottingham, Nottingham, United Kingdom, 3Sheffield Teaching Hospitals, Sheffield, United Kingdom, 4Imperial College London, London, United Kingdom, 5University of Oxford, Oxford, United Kingdom, 6Oxford NHS Foundation Trust, Oxford, United Kingdom, 7Nottingham University, Nottingham, United Kingdom, 8University College London, London, United Kingdom
Synopsis
Keywords: Lung, COVID-19
Patients with signs of interstitial lung disease at 12 weeks after hospitalisation due to COVID-19 underwent 1H and 129Xe MRI. 129Xe MRI showed impaired xenon gas transfer (RBC:M and RBC:gas) at 24 and 52 weeks after hospital admission, with no longitudinal change between 24 and 52 weeks observed in 129Xe MRI metrics or PFT transfer factor. Xenon MRI metrics correlated significantly with PFT transfer factor at 24 weeks (RBC:M, RBC:gas, LmD) and 52 weeks (RBC:M, RBC:gas, LmD).Introduction
A wide range of abnormalities have been reported after hospitalisation due to COVID-19, including persistent interstitial lung changes in 4.8% of patients at 6 weeks after hospitalisation[1]. The Xenon MRI investigation of Alveolar dysfunction Substudy (XMAS) of the UK Interstitial Lung Disease-Long COVID (UKILD) study aims to characterise the trajectory of persistent interstitial changes due to COVID-19 using a 129Xe and 1H MRI protocol.129Xe dissolved phase MRI is sensitive to longitudinal change in interstitial lung diseases[2, 3] and allows the direct assessment of pulmonary gas exchange (red blood cell to membrane ratio, RBC:M, and RBC to gas ratio, RBC:gas). 129Xe MRI can also assess lung ventilation and microstructure.
Methods
Patients with abnormal CT or 1H MRI consistent with interstitial lung disease, assessed by a radiologist 12 weeks after hospitalisation were recruited from Sheffield, Manchester, Nottingham and Oxford post-COVID clinics from November 2020 as part of the UKILD XMAS study [2].Patients underwent 1H and 129Xe MRI at 24 and 52 weeks after hospital admission. Where possible, patients also underwent spirometry and gas transfer PFTs on the same day (maximum difference of 13 weeks).
The MRI protocol included UTE imaging (3D radial acquisition with prospective respiratory bellows gating on expiration[3]), diffusion-weighted MRI (3D SPGR multiple b-value acquisition[4]) and 129Xe dissolved phase imaging (3D spectroscopic imaging acquisition[5]. Patients recruited from Sheffield and Manchester also underwent 129Xe lung ventilation imaging (3D SSFP acquisition[6]) and dynamic contrast enhanced lung perfusion imaging[7]. Xenon dose volumes were ≤1L depending on patient height[8].
Longitudinal comparisons were made using Wilcoxon Signed Rank Tests and correlations were assessed at 24 and 52 weeks using Spearman’s rank correlation coefficient. Patients with WHO ordinal scale ≥6 (who underwent invasive mechanical ventilation) [9] were compared to patients with WHO ordinal scale <6 using a Mann Whitney U test. PFT results are presented as Z scores. Data are presented as median (range).
Results
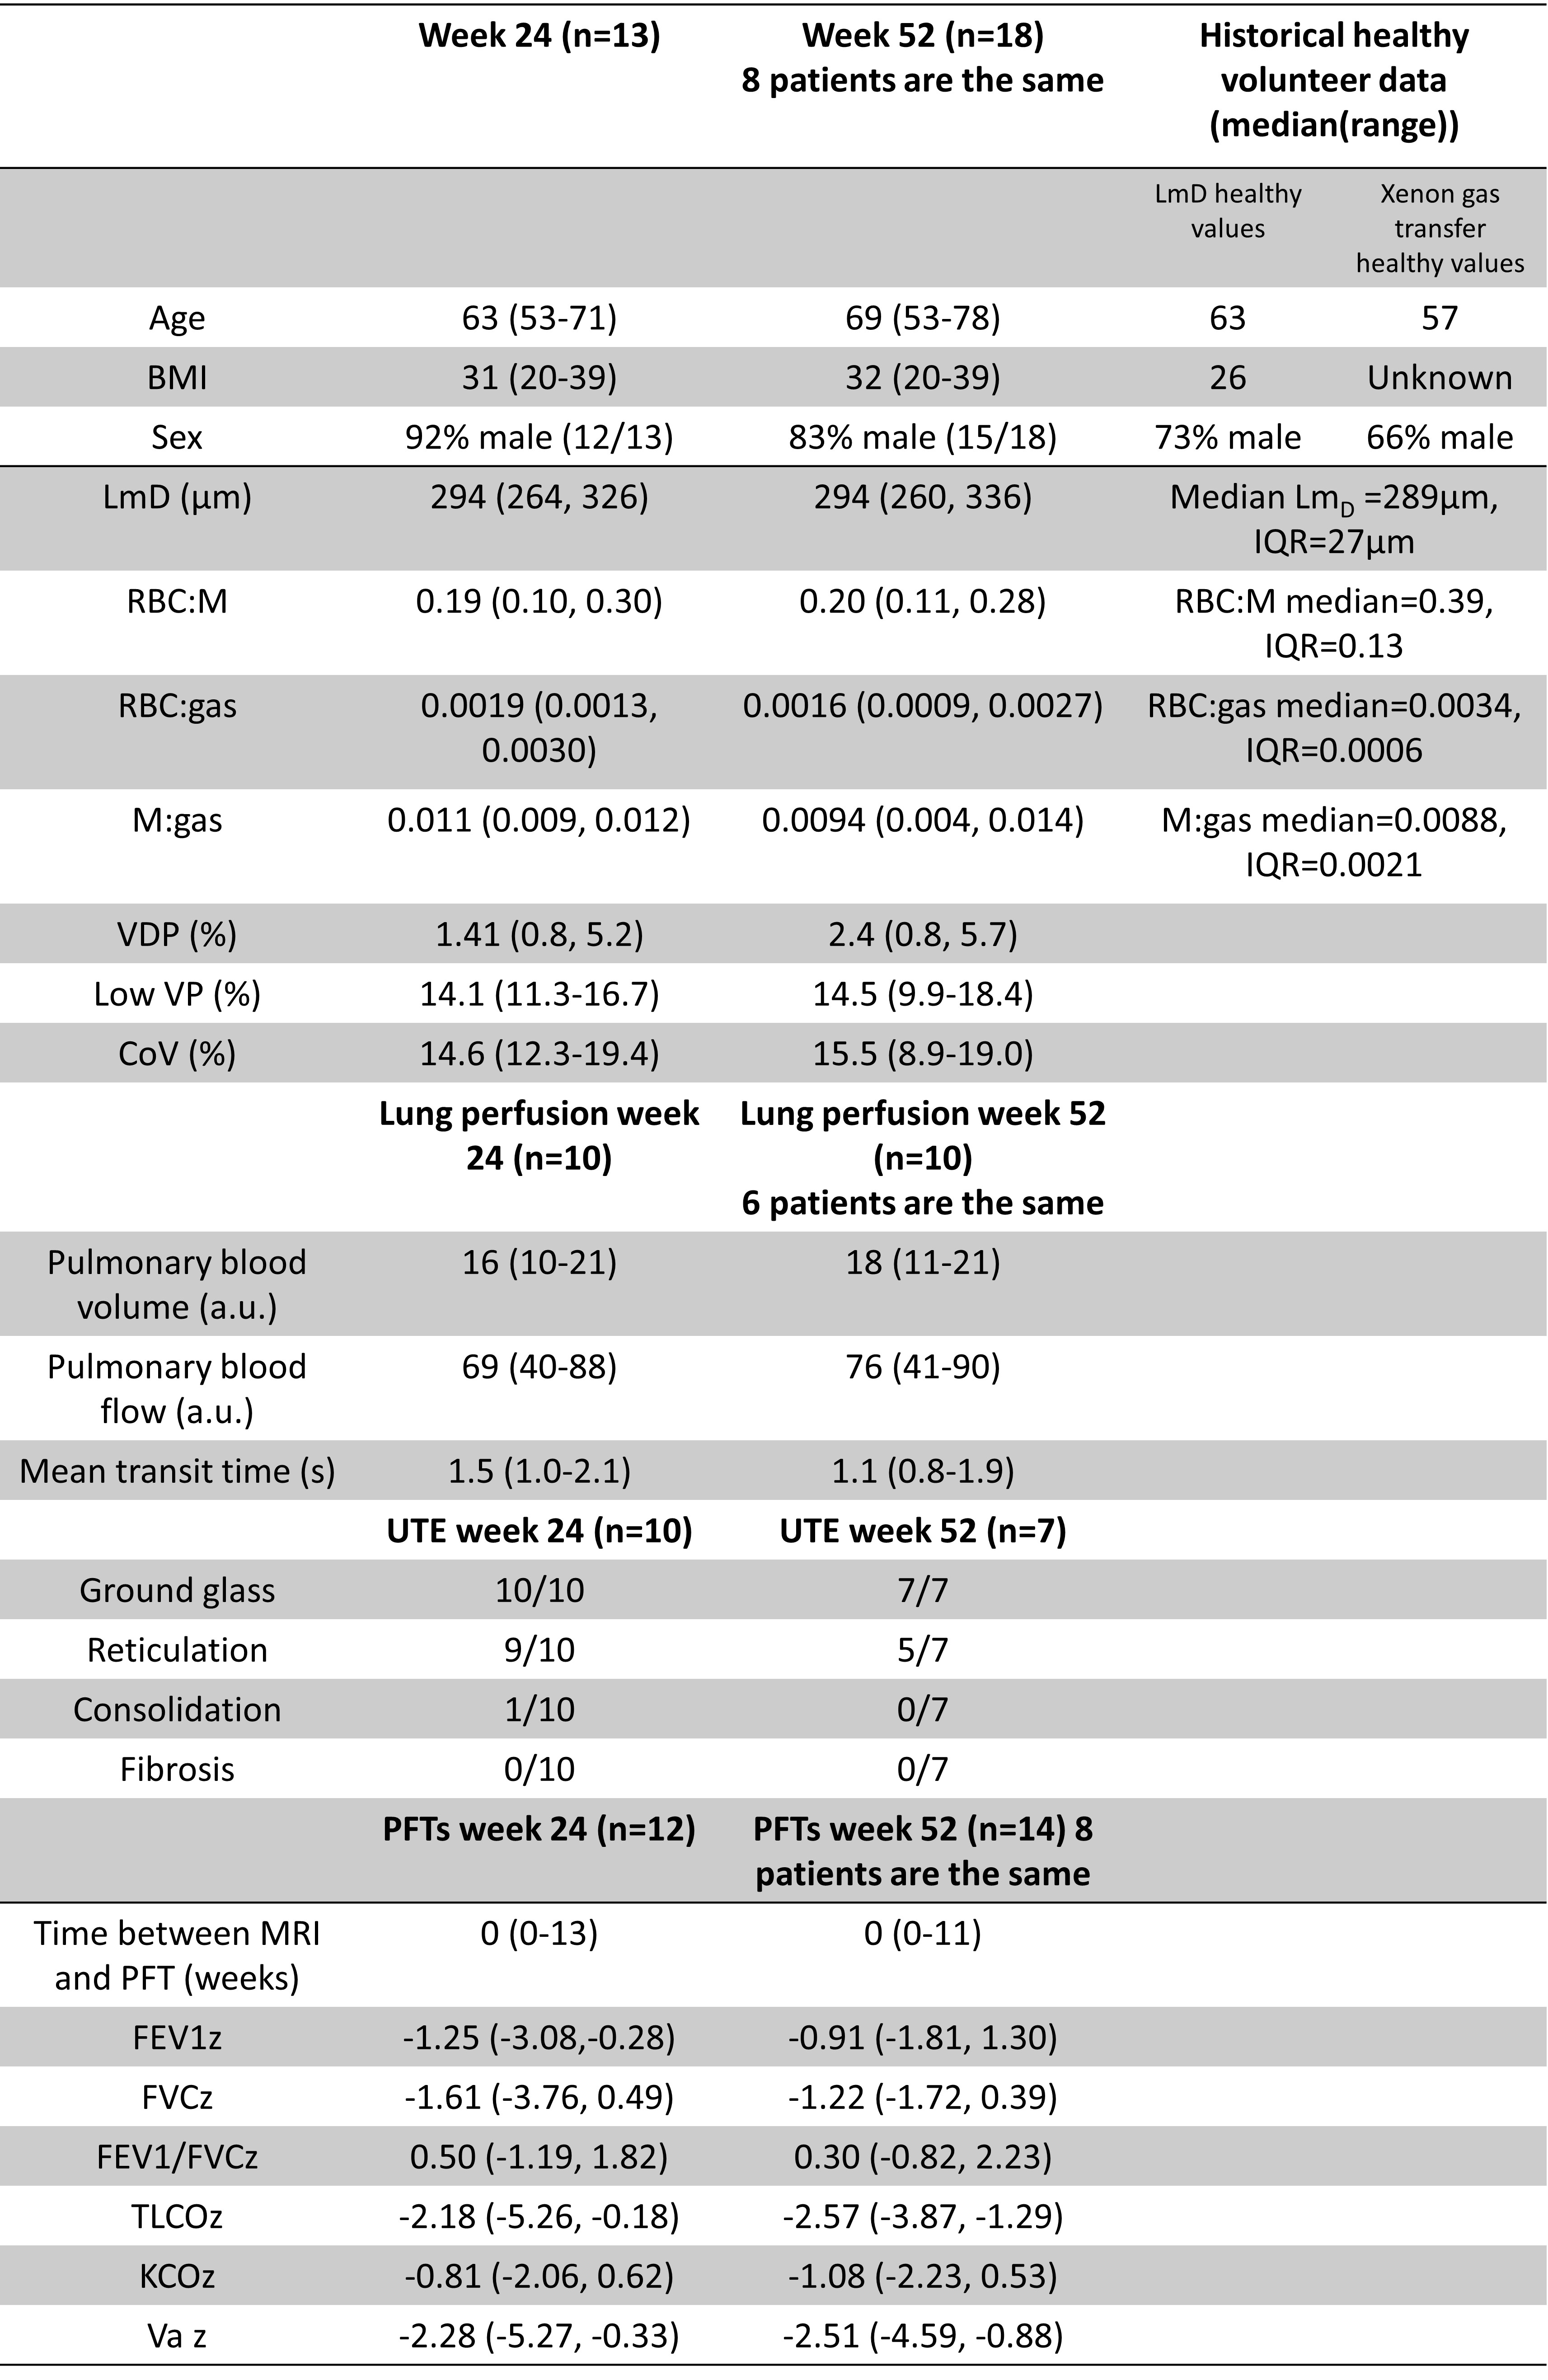
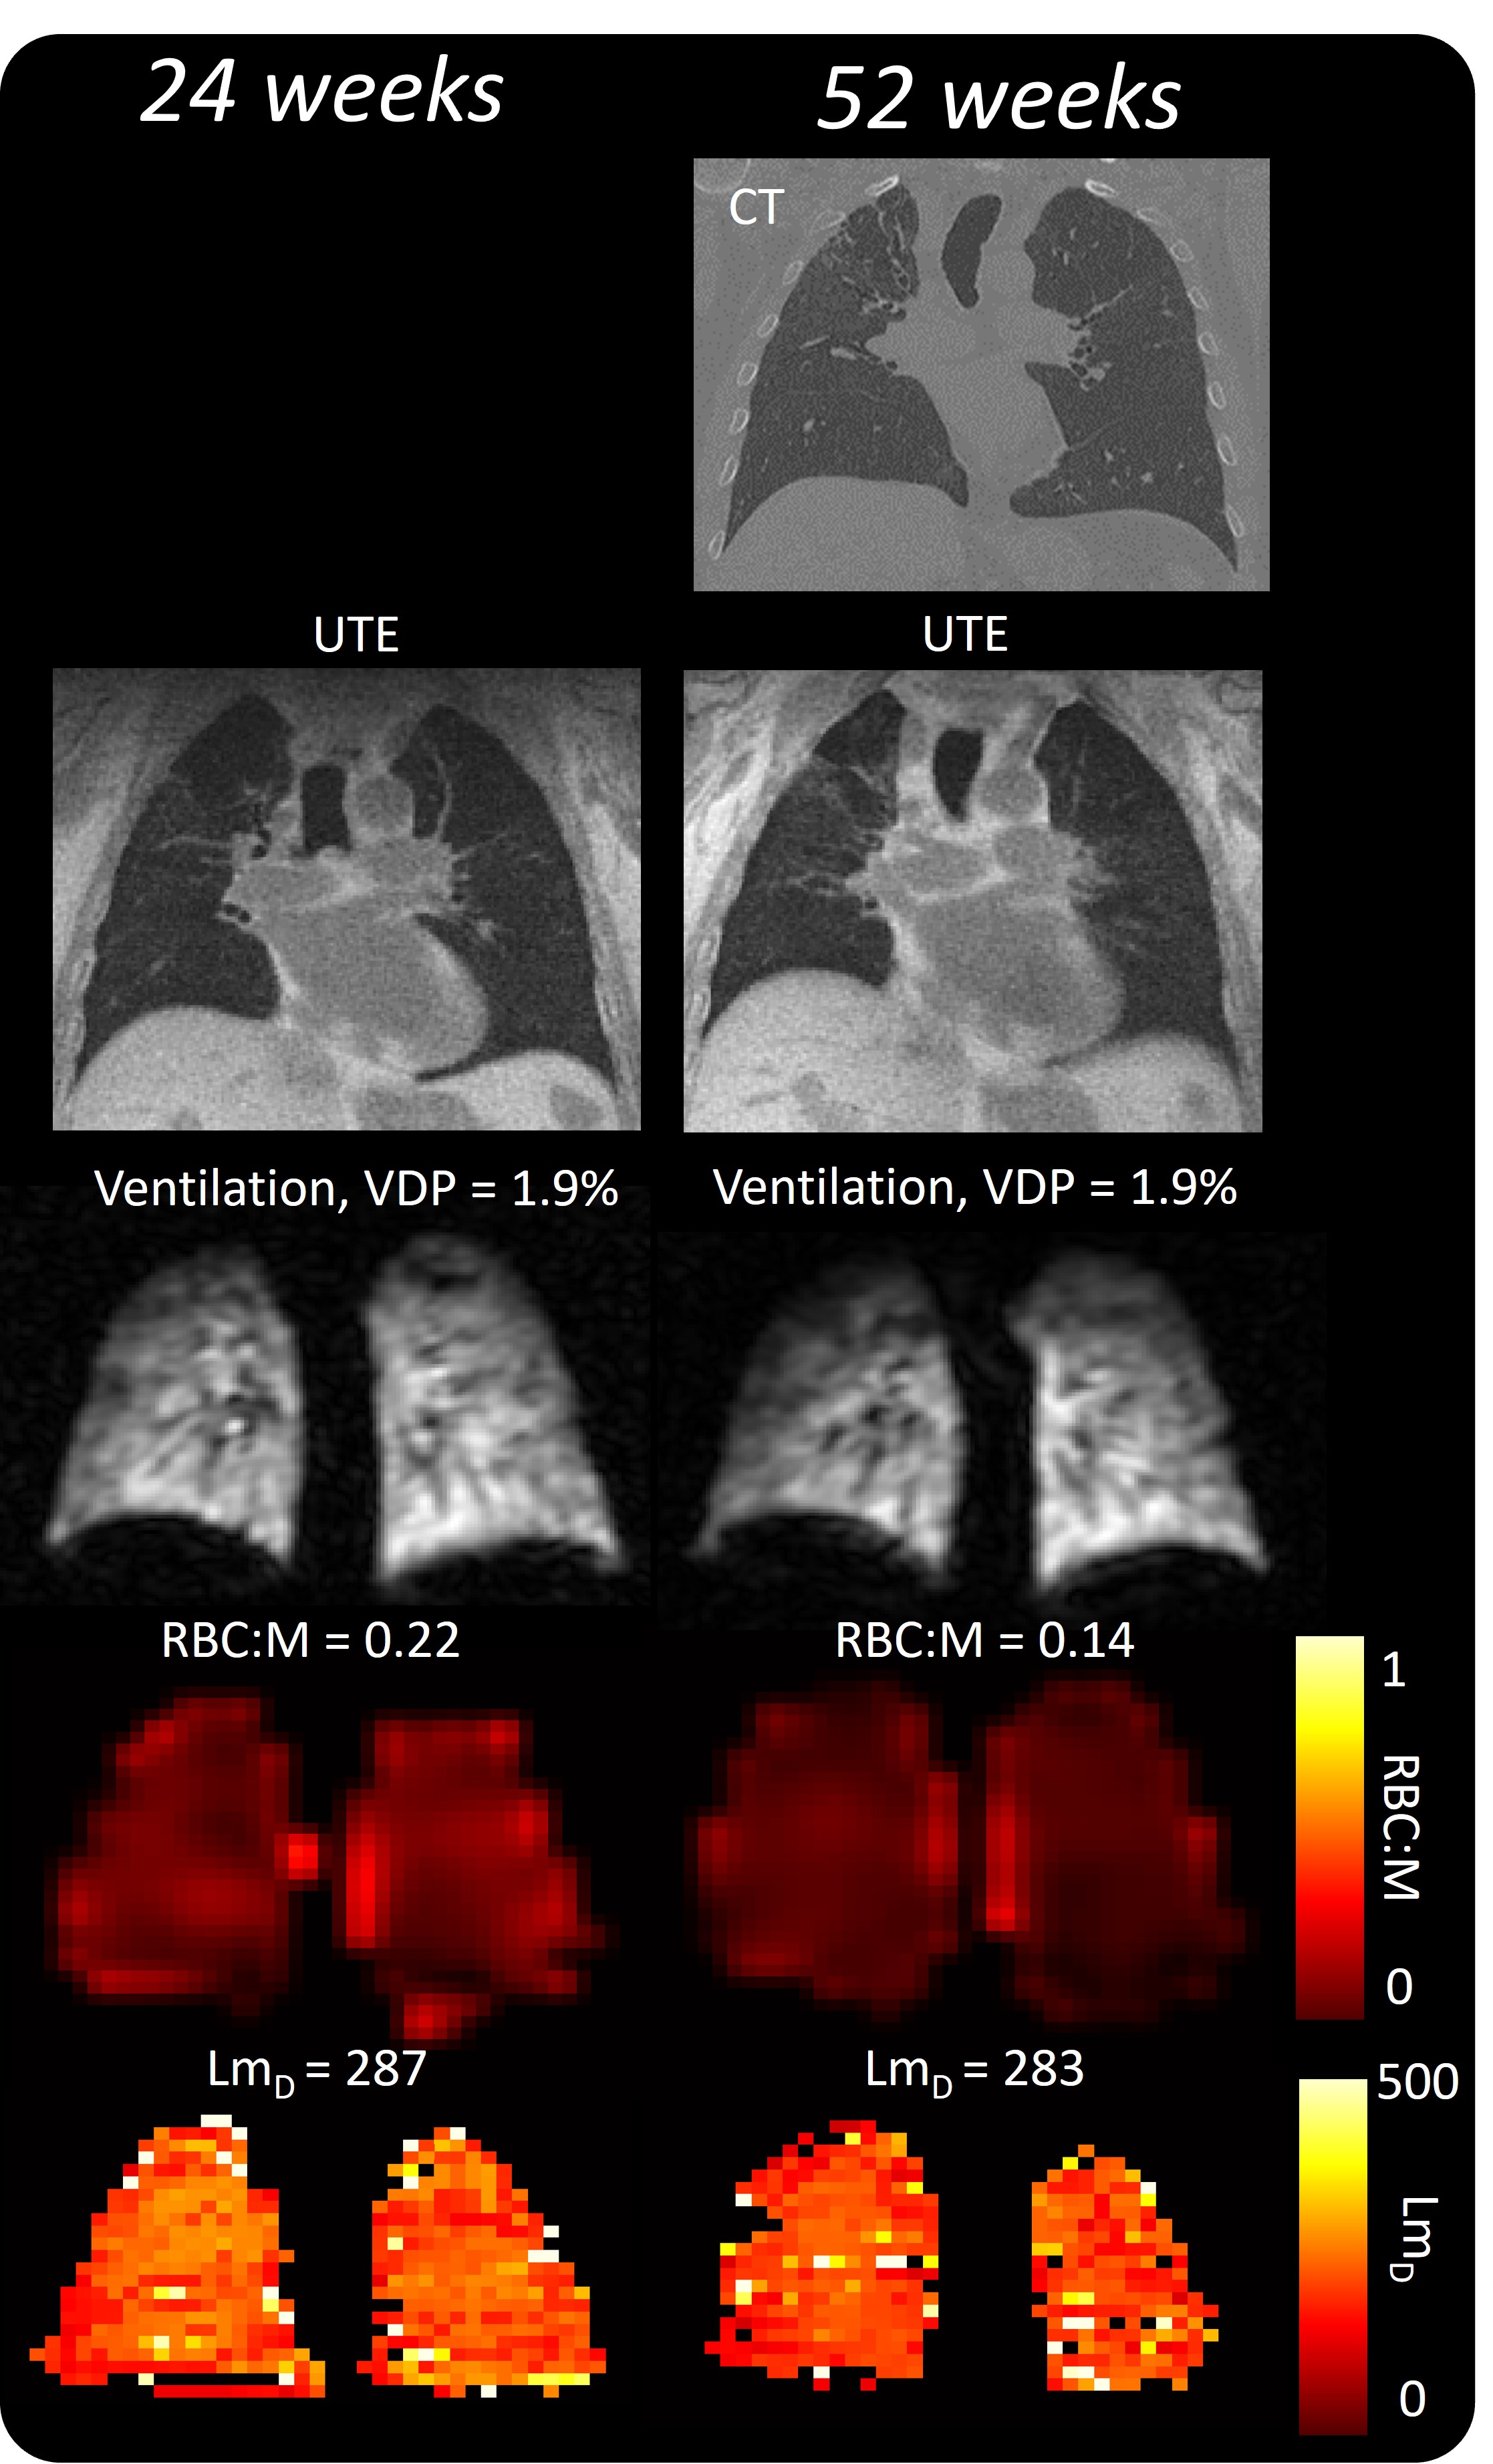
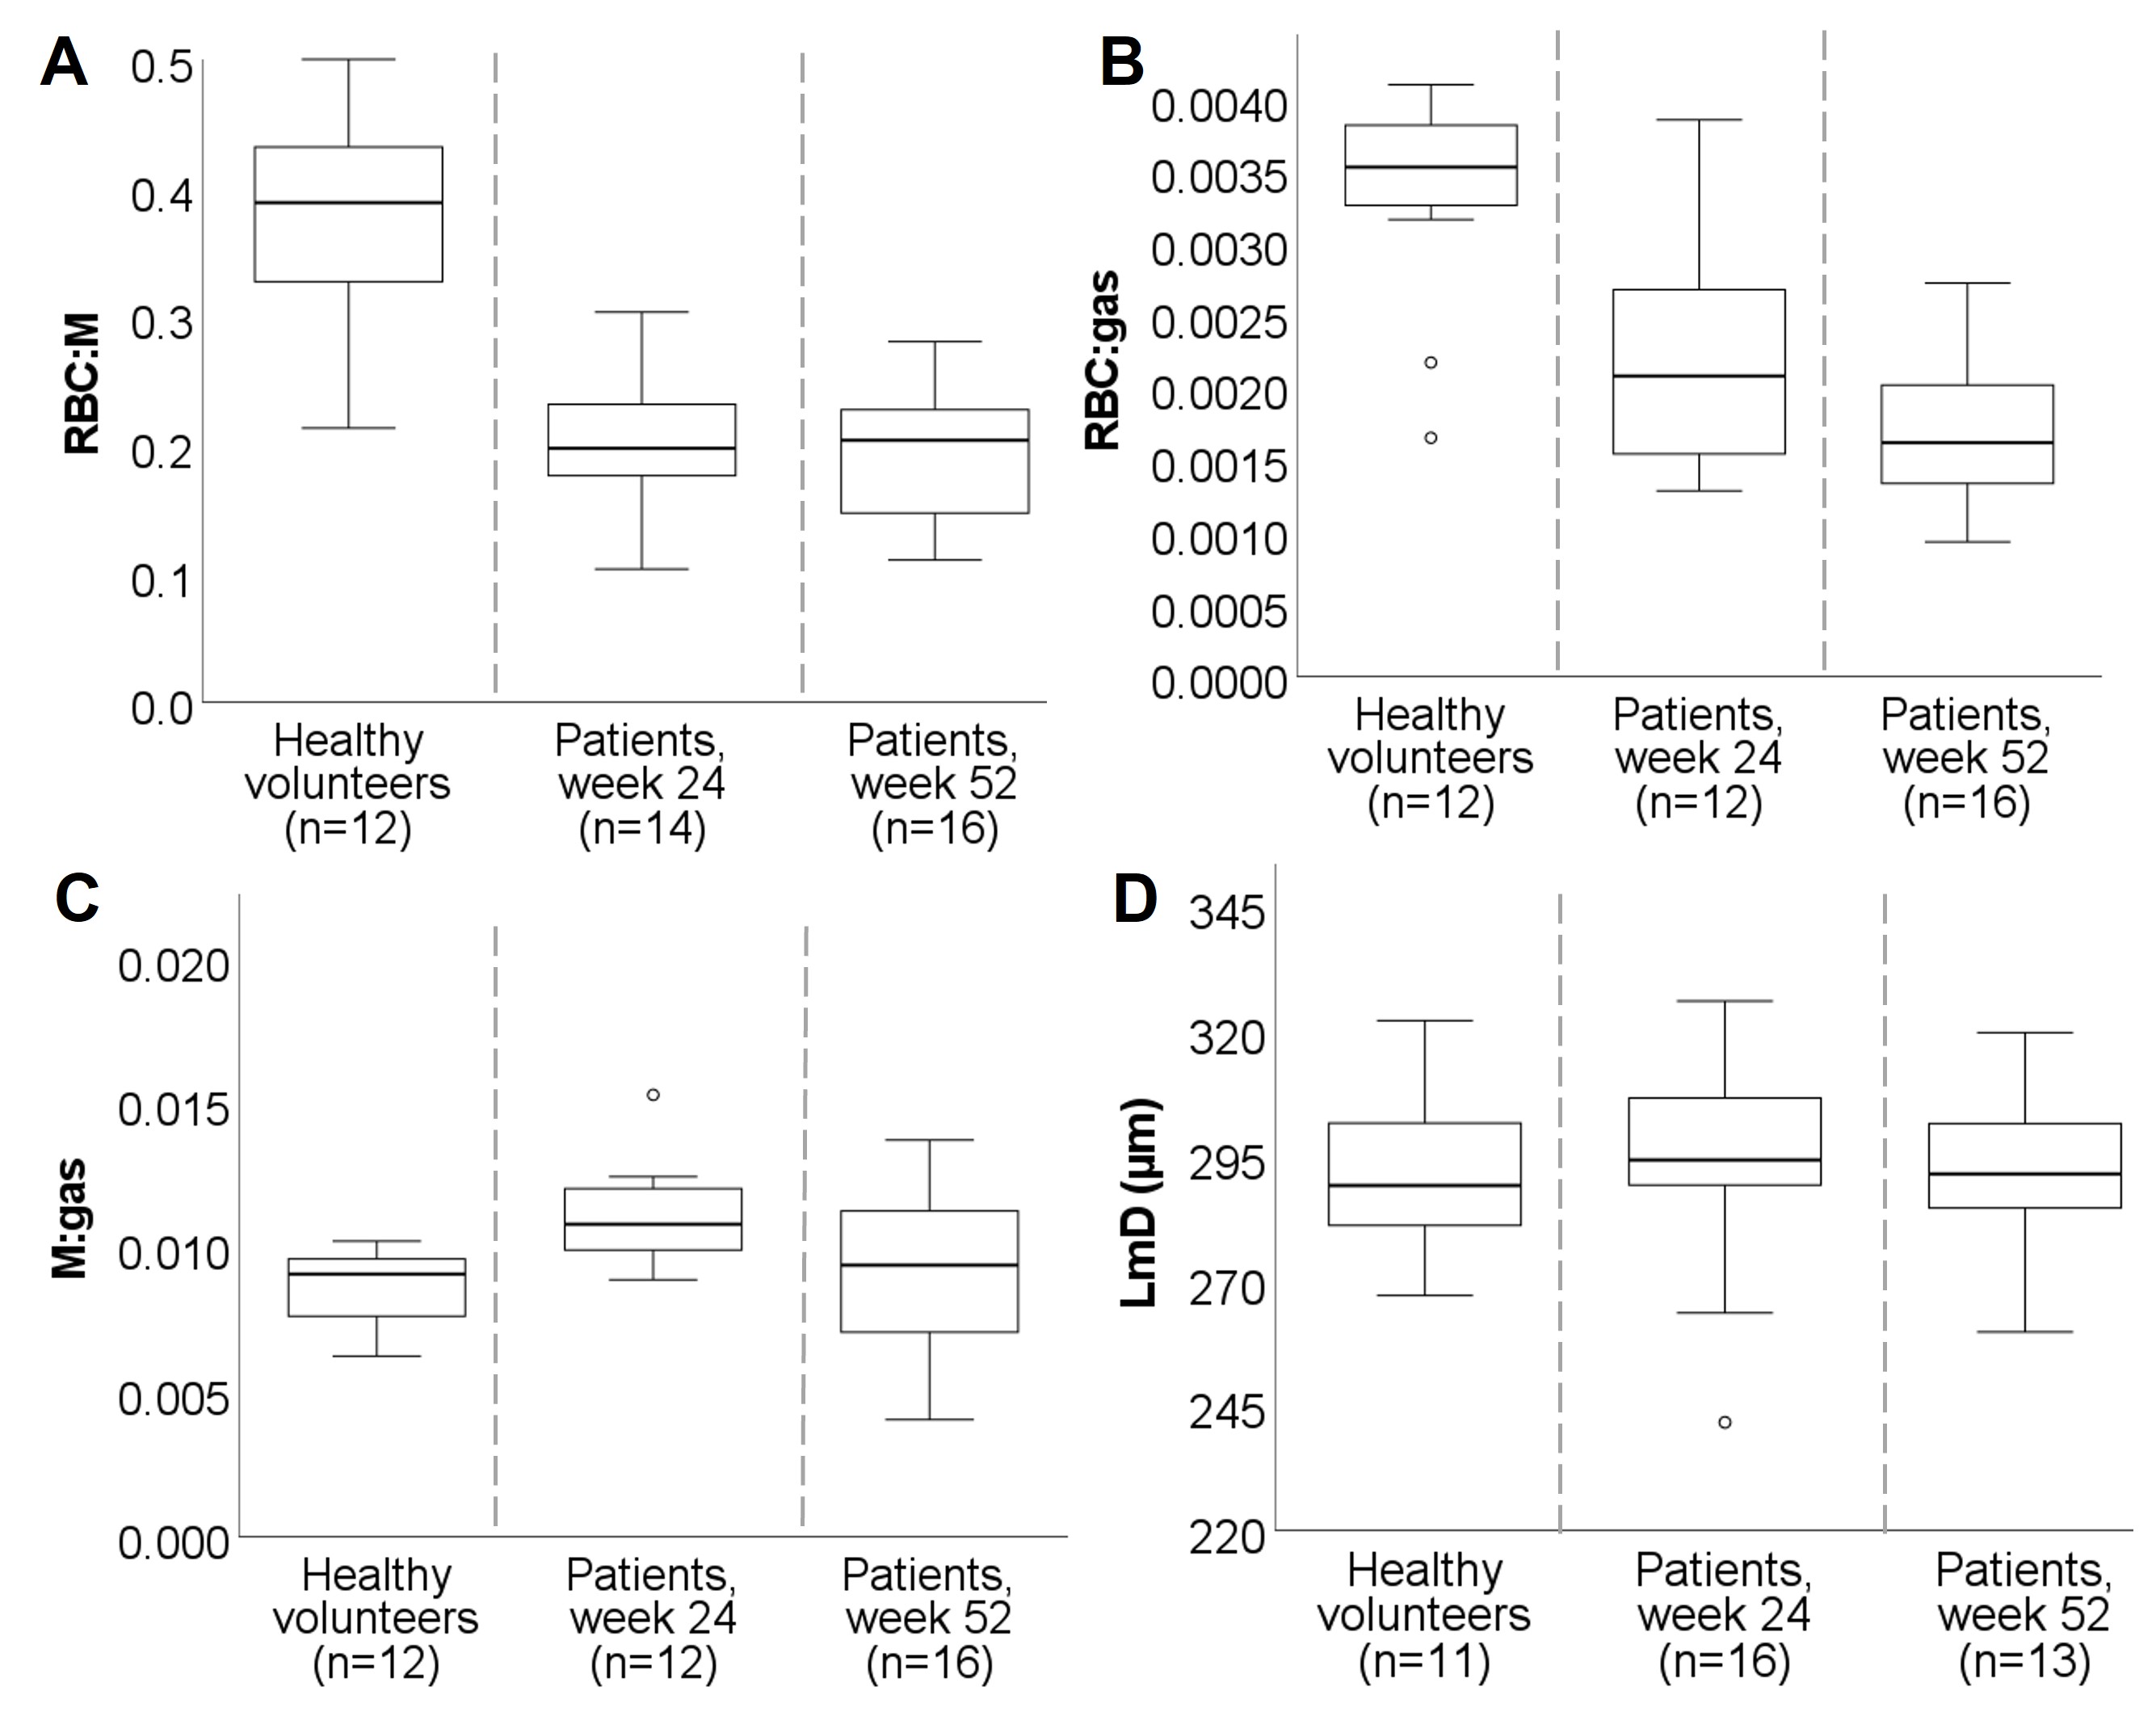
23 patients were recruited, who were admitted to hospital for a duration of 4.0(0-19) weeks. MRI was acquired at 23(6-33) weeks (n=13) and 52(23-96)(n=18) weeks after hospital admission. 8 patients had MRI at both 24 and 52 weeks. 6 patients were mechanically ventilated.Patient demographic, PFT and MRI are shown in Table 1, alongside reference data from healthy volunteers where possible[10]. Example images are shown in Figure 1. Patients had decreased RBC:M, RBC:gas and increased M:gas at 24 and 52 weeks (Figure 2) compared to healthy reference data.
All patients had VDP<6%. At 24 weeks 11/14 patients had abnormal TLCOz (Z-score<-1.64), 2/14 patients had abnormal KCOz and 12/14 patients had abnormal VAz. At 52 weeks 11/14 had abnormal TLCOz and 6/14 patients had abnormal KCOz.
Minor perfusion defects were identified by a radiologist in 3/10 patients at 24 weeks and 2/10 patients at 52 weeks.
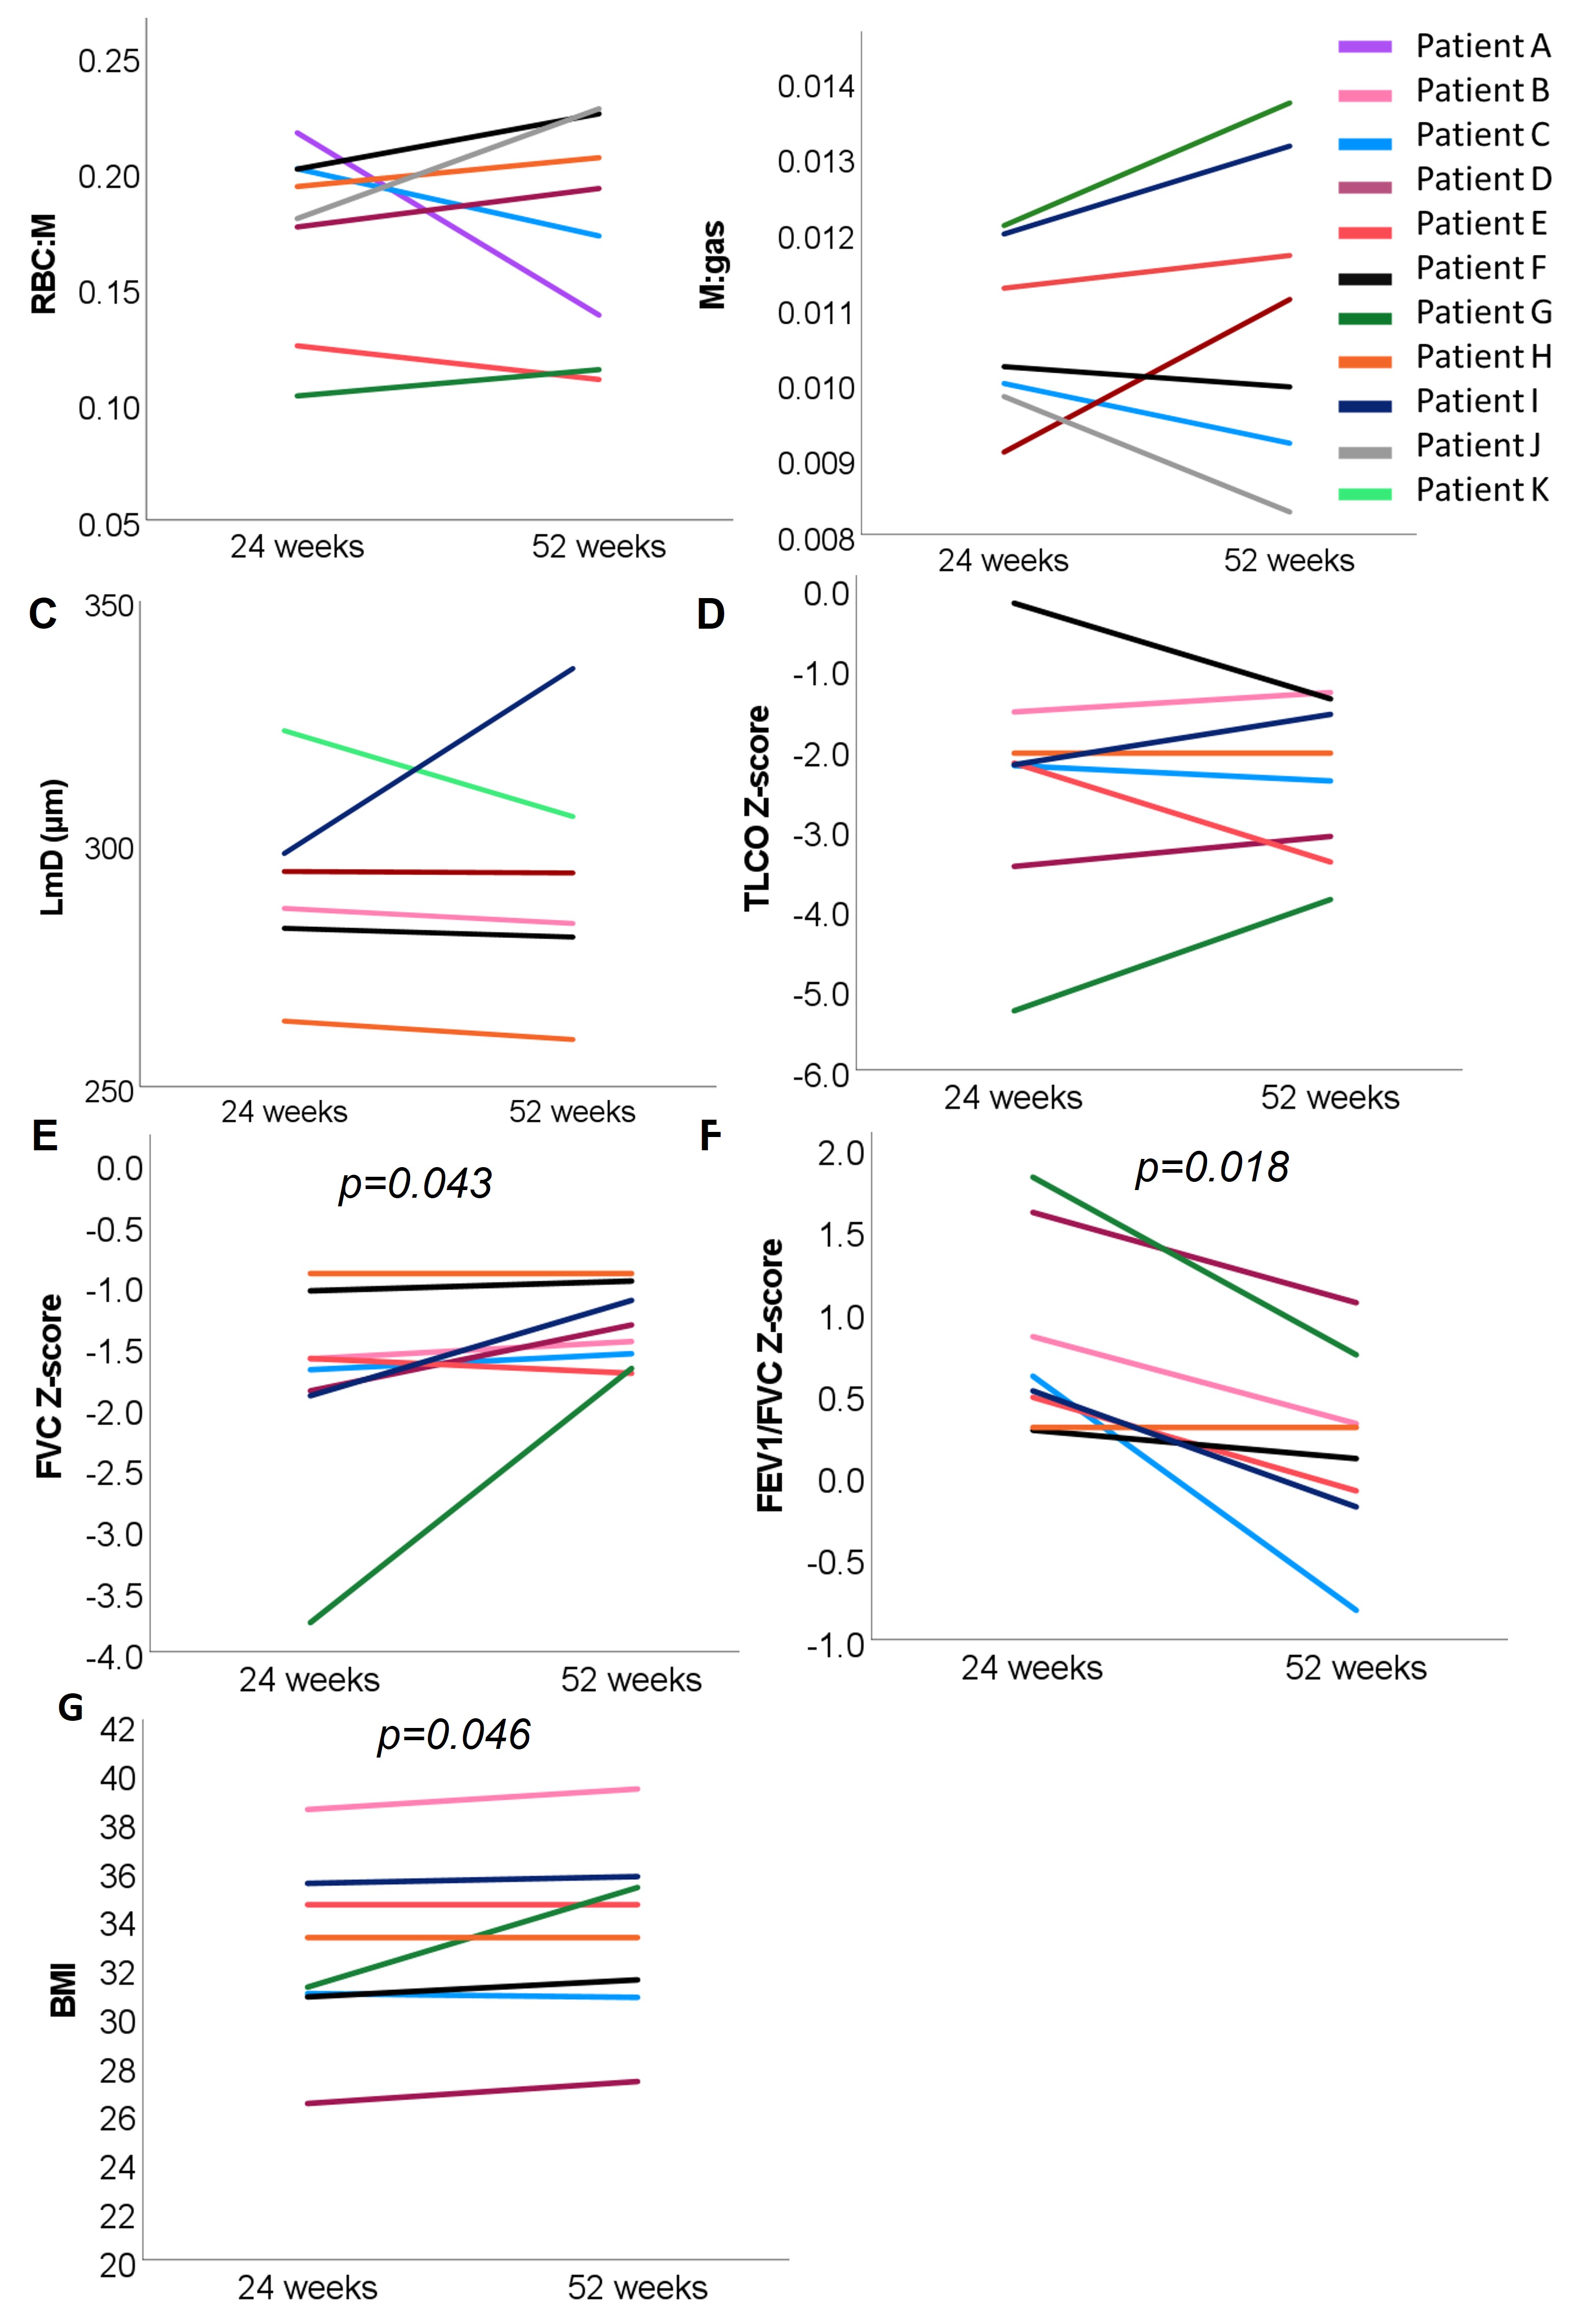
8 patients had MRI examinations at both 24 and 52 weeks after hospital admission. There was no significant change in dissolved phase xenon MRI metrics of gas transfer, diffusion weighted MRI metrics of alveolar dimension or transfer factor (TLCOz, KCOz). There was a significant decrease in FEV1/FVCz and an increase in FVCz (Figure 3).
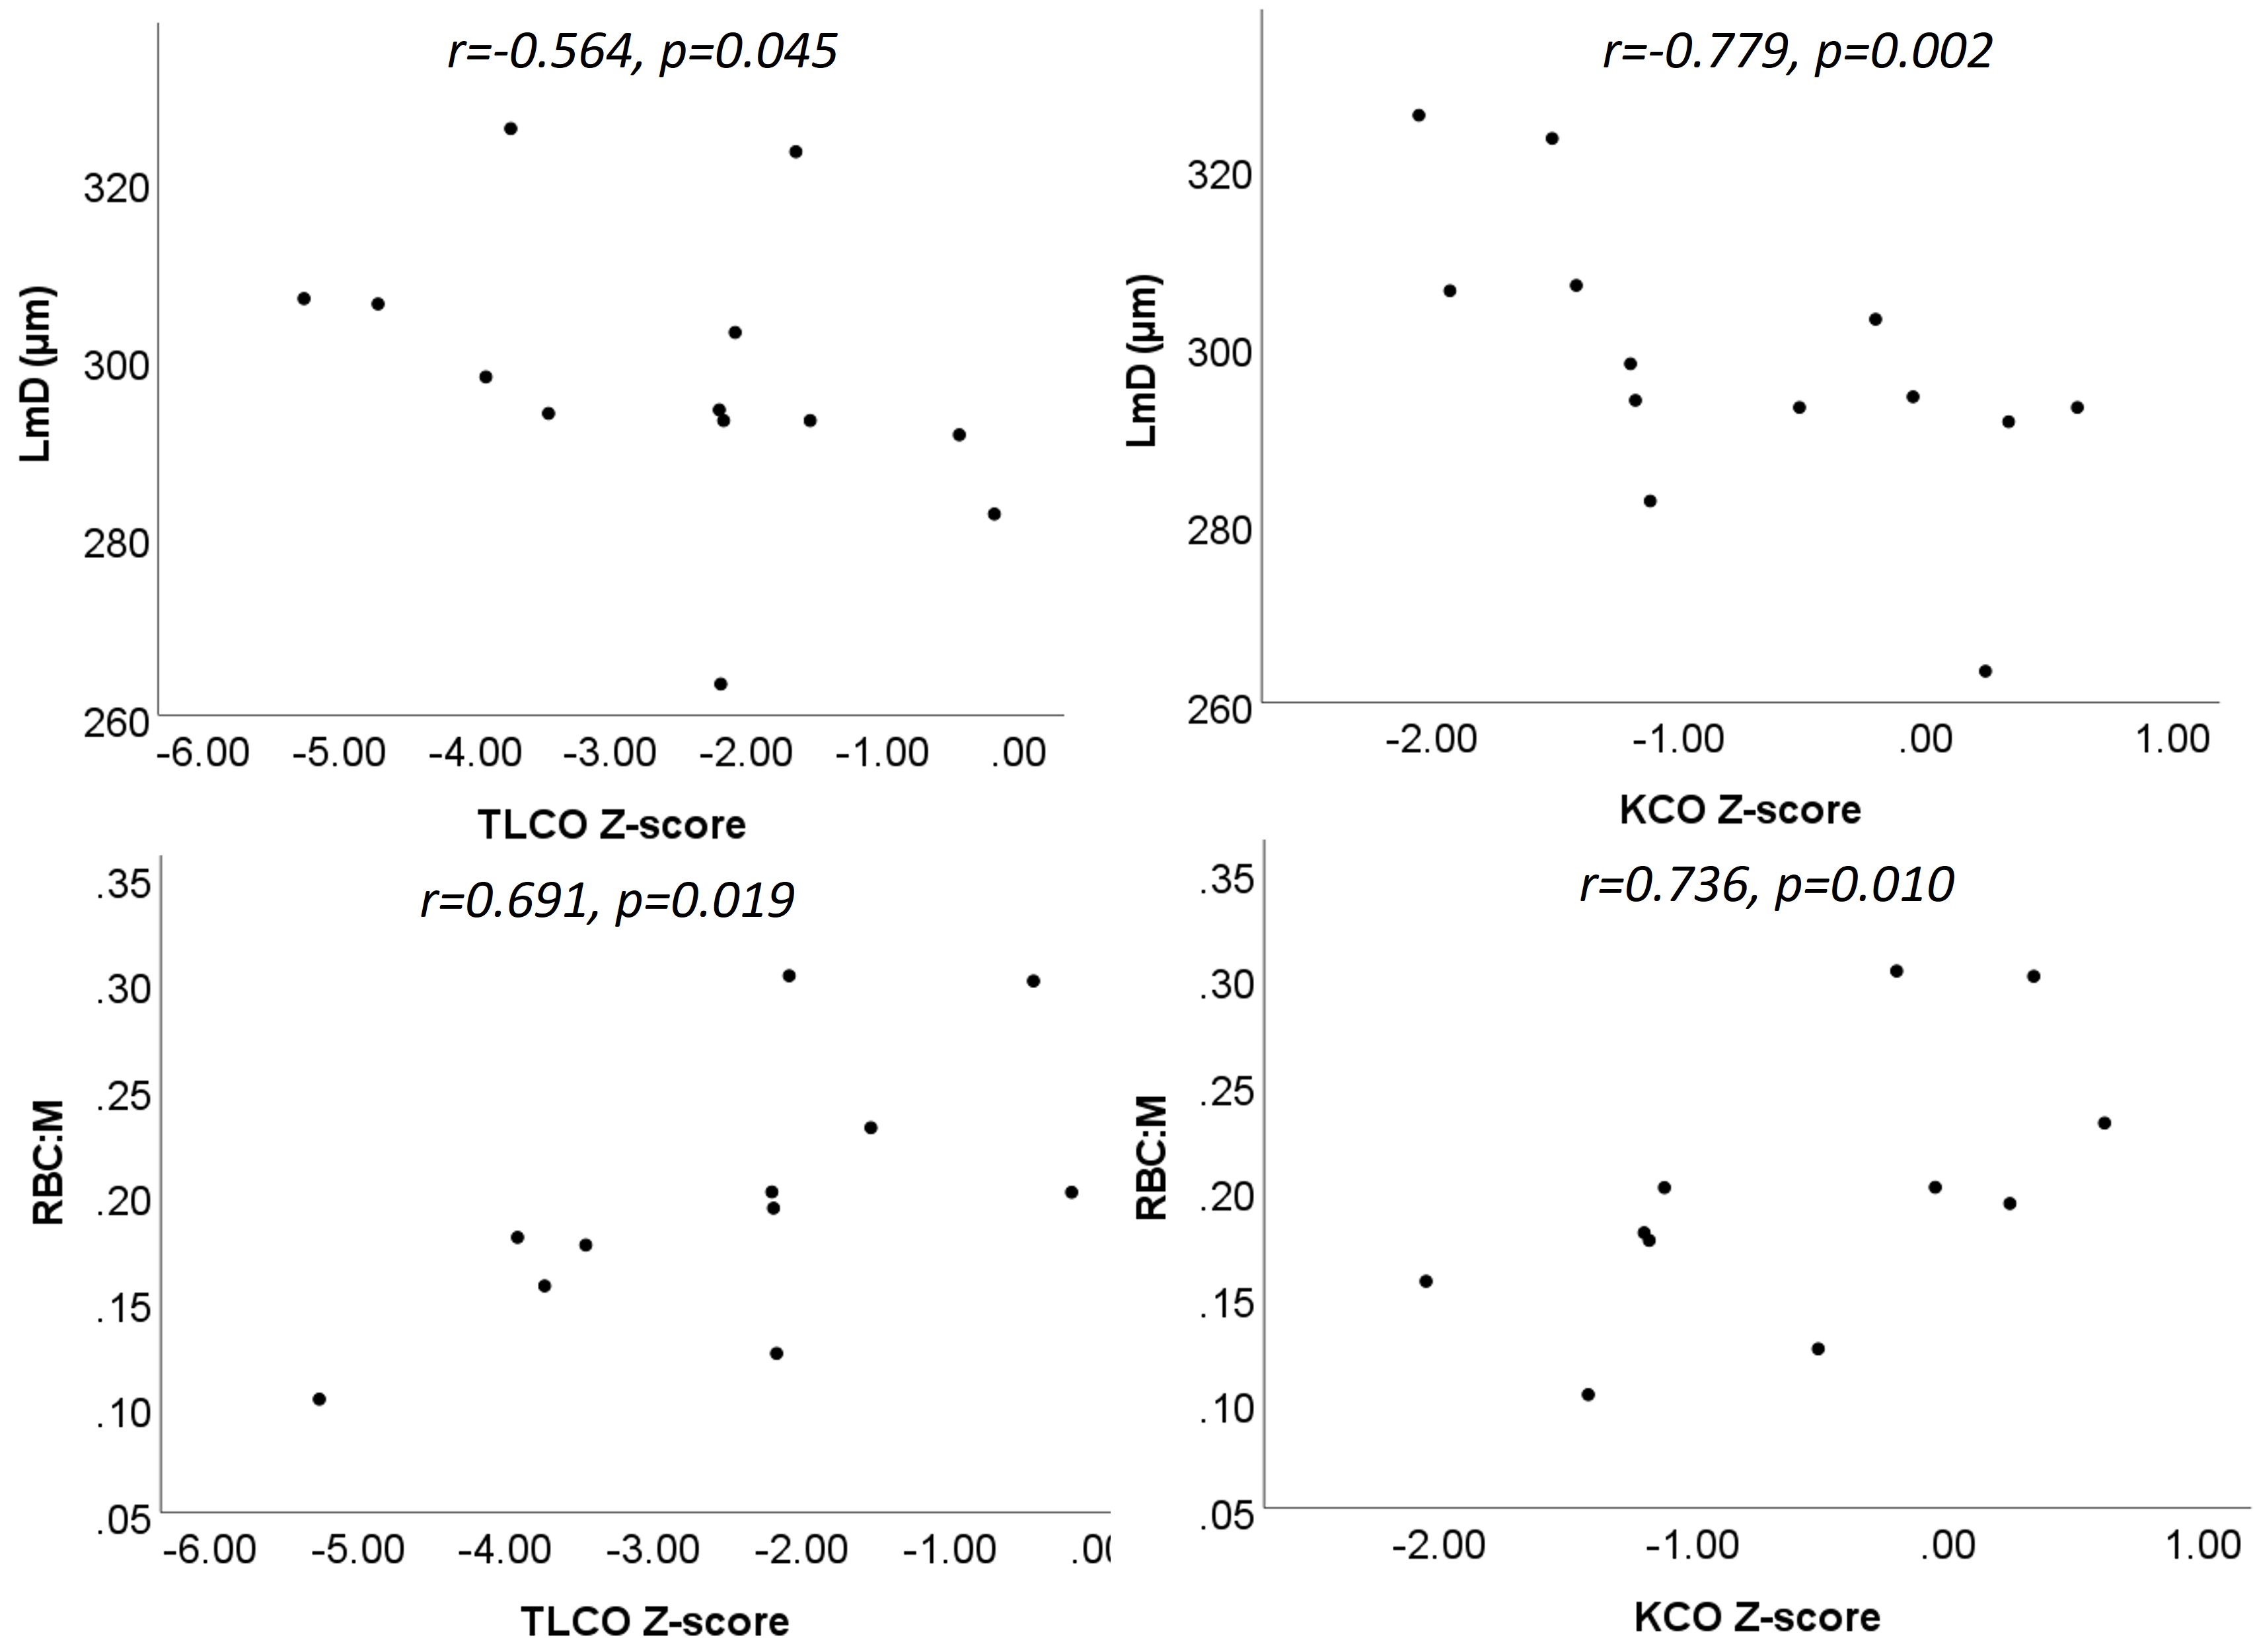
At 24 weeks, significant correlations were seen between dissolved phase xenon metrics and PFTs, see Figure 4. LmD correlated with TLCOz and KCOz (r=-0.564, p=0.045; r=-0.779, p=0.002, n=13), RBC:M correlated with TLCOz and KCOz (r=0.691, p=0.019; r=0.736, p=0.010, n=11), RBC:gas correlated with TLCOz and KCOz (r=0.745, p=0.013; r=0.830, p=0.003, n=10).
At 52 weeks, LmD correlated with TLCOz (r=-0.667, p=0.05), RBC:M correlated with TLCOz (r=0.797, p=0.002, n=12), RBC:gas correlated with KCOz (r=0.657, p=0.020, n=12). M:gas correlated significantly with BMI (r=0.604, p=0.022, n=12). No other significant correlations were observed.
Of patients scanned at 52 weeks, patients had WHO ordinal scale score ≥6 (n=4/14) had significantly higher FEV1/FVCz than those with score 4-5 (WHO score 4-5: -0.07 (-0.82, 2.23), WHO score 6-7: 0.97 (0.84, 1.24), p=0.024). There were no other significant differences between these groups at either 24 or 52 weeks.
Discussion
This preliminary work indicates that xenon gas transfer (RBC:M, RBC:gas) and transfer factor are impaired one year after hospitalisation due to COVID-19 in patients who had persistent interstitial changes on chest imaging. The reduction in RBC:M and RBC:gas is consistent with abnormalities related to the vascular component of gas exchange physiology. While there was no longitudinal change in gas transfer metrics, we observed a significant reduction in FEV1/FVCz at 52 weeks, indicating improved lung compliance. These data imply that despite a return of mechanical function to the lung, there are ongoing abnormalities potentially caused by microvascular dysfunction.LmD was elevated when compared to our previously published healthy volunteer data, however LmD was higher than observed in our data in post-COVID patients who did not have signs of interstitial lung changes[10]. The cause of this is unclear.
Conclusion
Impaired xenon gas transfer was observed (RBC:M and RBC:gas) at 24 and 52 weeks after hospital admission in patients with interstitial lung changes observed at 12 weeks, with no longitudinal change between 24 and 52 weeks observed in 129Xe MRI metrics or PFT transfer factor.Xenon MRI metrics correlated significantly with PFT transfer factor at both 24 and 52 weeks.
Acknowledgements
JMW Medical Research Council grant “Expansion of state-of-the-art MR imaging infrastructure for pulmonary disease stratification: POLARIS” MR/M008894/1 GSK and GE for investigator led grant funding AART was supported by a BHF Intermediate Clinical Fellowship (FS/18/13/33281)References
1. Myall, K.J., et al., Persistent Post-COVID-19 Interstitial Lung Disease. An Observational Study of Corticosteroid Treatment. Ann Am Thorac Soc, 2021. 18(5): p. 799-806.
2. Wild, J.M., et al., Understanding the burden of interstitial lung disease post-COVID-19: the UK Interstitial Lung Disease-Long COVID Study (UKILD-Long COVID). BMJ Open Respir Res, 2021. 8(1). 3. Johnson, K.M., et al., Optimized 3D ultrashort echo time pulmonary MRI. Magn Reson Med, 2013. 70(5): p. 1241-50.
4. Chan, H.F., et al., 3D diffusion-weighted (129) Xe MRI for whole lung morphometry. Magn Reson Med, 2018. 79(6): p. 2986-2995.
5. Collier, G.J., et al., Dissolved (129) Xe lung MRI with four-echo 3D radial spectroscopic imaging: Quantification of regional gas transfer in idiopathic pulmonary fibrosis. Magn Reson Med, 2021. 85(5): p. 2622-2633.
6. Stewart, N.J., et al., Feasibility of human lung ventilation imaging using highly polarized naturally abundant xenon and optimized three-dimensional steady-state free precession. Magn Reson Med, 2015. 74(2): p. 346-52.
7. Sourbron, S.P. and D.L. Buckley, Classic models for dynamic contrast-enhanced MRI. NMR Biomed, 2013. 26(8): p. 1004-24.
8. Chan, H.F., et al., Image Phenotyping of Preterm-born Children using Hyperpolarised (129)Xe Lung MRI and Multiple-breath Washout. Am J Respir Crit Care Med, 2022.
9. Rubio-Rivas, M., et al., WHO Ordinal Scale and Inflammation Risk Categories in COVID-19. Comparative Study of the Severity Scales. J Gen Intern Med, 2022. 37(8): p. 1980-1987.
10. Saunders, L.C., et al., Longitudinal lung function assessment of patients hospitalised with COVID-19 using <sup>1</sup>H and <sup>129</sup>Xe lung MRI. medRxiv, 2022: p. 2022.04.06.22242447.
Figures