1399
Double-echo Oxygen Enhanced MRI at 1.5 T correlates with clinical lung function in CF patients1Bioxydyn Ltd, Manchester, United Kingdom, 2National Heart & Lung Institute, Imperial College London, London, United Kingdom, 3Royal Brompton Hospital, Guy's & St Thomas’ Trust, London, United Kingdom, 4MCMR, Manchester University NHS Foundation Trust, Wythenshawe, United Kingdom, 5Centre for Paediatric and Child Health, Imperial College London, London, United Kingdom, 6Royal Brompton Hospital, , Guy's & St Thomas’ Trust, London, United Kingdom, 7Centre for Medical Image Computing, Department of Medical Physics and Biomedical Engineering, University College London, London, United Kingdom
Synopsis
Keywords: Lung, Oxygenation
This study presents the first results from a population with cystic fibrosis (CF) of a novel, easy-to-implement, multi-slice, free breathing OE-MRI acquisition method based on measuring R2* changes in the lung with varying level of oxygen delivered to the patients.
The oxygen ventilated volume fraction obtained presents a very good correlation with lung clearance index (LCI) obtained by multiple breath N2 washout. LCI is a marker of overall lung ventilation inhomogeneity, which has been shown to be a sensitive marker of lung disease severity in CF, particularly in the early stage of the disease when spirometry outcomes are normal.
Introduction
Dynamic oxygen-enhanced MRI (OE-MRI) uses changing levels of oxygen administered to the subjects to provide contrast to quantify regional lung function. The most common OE-MRI acquisition methods monitor T1 changes in lung tissue, but a change in airway and alveolar oxygen partial pressure also gives rise to a measurable change in tissue T2* / R2*1.Cystic fibrosis (CF), a multi-systemic genetic disease, is characterised by morbidity and mortality primarily related to progressive lung disease, which may start at an early age. Radiation-free imaging techniques that are able to monitor lung function in a wide range of ages are therefore important2.
In this work we employed an easy to implement imaging acquisition method based on measuring R2* changes over different oxygen levels in a population of CF patients. We also explore the relationship between the obtained imaging biomarkers, the lung clearance index (LCI) and spirometry.
Methods
Thirty-nine CF patients (mean age 18 yo, range 8-46 yo) were recruited, and informed consent was obtained. Imaging was carried out on a 1.5 T Siemens Aera MRI scanner and consisted of a 9 min long dynamic 2D multi-slice double-echo T1-FFE sequence (TEs = 0.98 / 2 ms, TR = 16 ms, FA = 5 deg, FOV 450 x 450 mm2, in plane spatial resolution 4.7 x 4.7 mm2, 360 time points acquired with a temporal resolution 1.5 s). Five coronal 10 mm thick slices were acquired. Breathing gases were delivered to the subject at 15 L/min via a non-rebreather mask (Intersurgical EcoliteTM, Intersurgical) and switched from air to 100% after 1.5 min and back to air at 5 min. Subjects breathed freely during the scan.Images were registered to a reference expiratory image using ANTS3 and segmented manually to identify the lung cavity. Dynamic pixelwise R2* values were then extracted from the double echo images and a median filter with 3x3x3 kernel (in plane and in time) applied. The R2* images from the second half of the oxygen delivery period were averaged to obtain R2*O2, and the images before the oxygen was switched off (the first 10 images are excluded to guarantee a steady state is reached) were averaged to obtain R2*air. Oxygen enhancement was then extracted as ∆R2* = R2*O2 - R2*air and the whole lung median was extracted. ∆R * images were then thresholded as suggested by Obert et al4 to obtain the Ventilated Volume Fraction (VVF). Subjects also underwent pulmonary function testing (PFT) to obtain FEV1%predicted (p) and FVC%p from spirometry and the lung clearance index (LCI2.5) from multiple breath N2 washout. Spearman’s rank correlation between ∆R2* and VVF and PFT parameters was calculated, as ∆R2* and VVF were not normally distributed as shown by a Shapiro test. Subjects were also divided into ‘Abnormal LCI’ and ‘Normal LCI’ based on a threshold of LCI2.5 = 8.1, and a Wilcoxon rank-sum test was performed; p-values < 0.05 were considered significant
Results
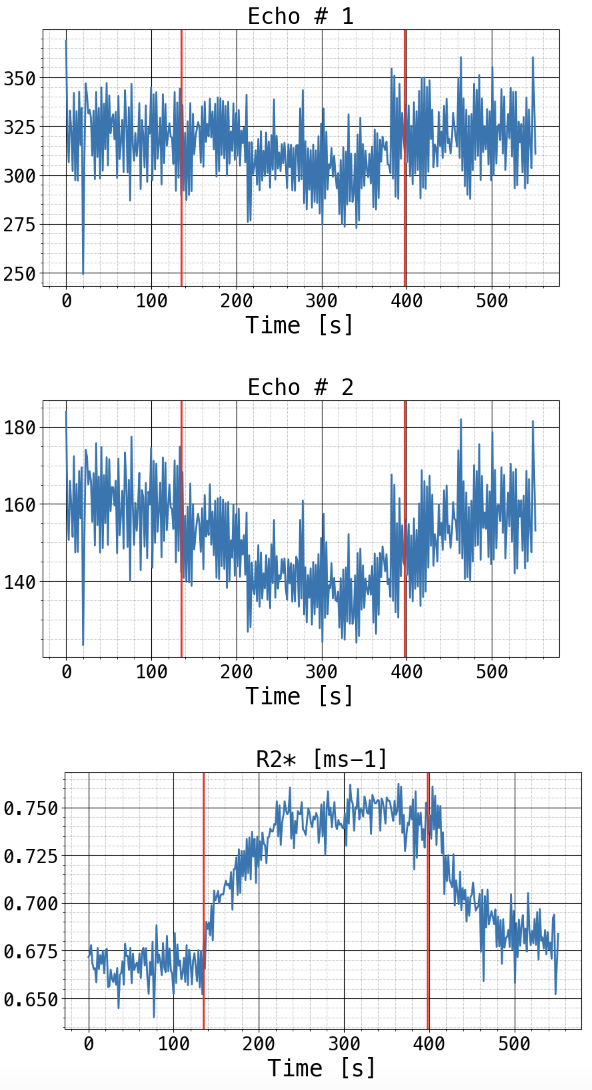
All subjects completed the imaging successfully. The mean +/- std for the considered parameters were: LCI2.5 = 9.4 ± 4.2, FEV1%p = 88.2 ± 17.6, FVC%p = 96.6 ± 15.1, ∆R2* = 0.076 ± 0.022 ms-1, VVF = 81.86 ± 15.5%.Figure 1 shows an example of whole lung signal from the first echo images, the second echo and the obtained R2*. Oxygen enhancement is more easily identified in the R
* signals.
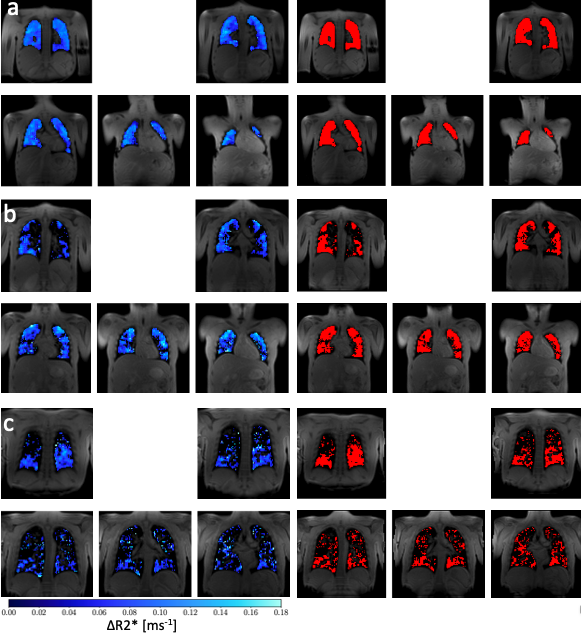
Figure 2 presents representative images of ∆R2* and VVF in three representative subjects with varying LCI and FEV1% values.
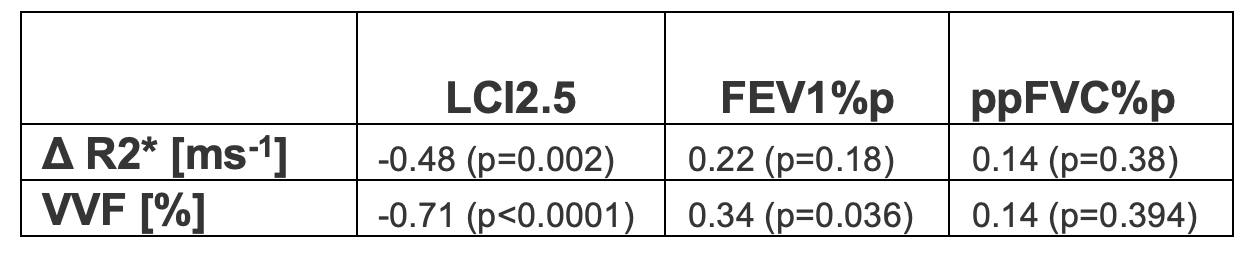
Table 1 presents the Spearman’s rank correlation coefficient and p-values between ∆R2* and VVF and PFT biomarkers.
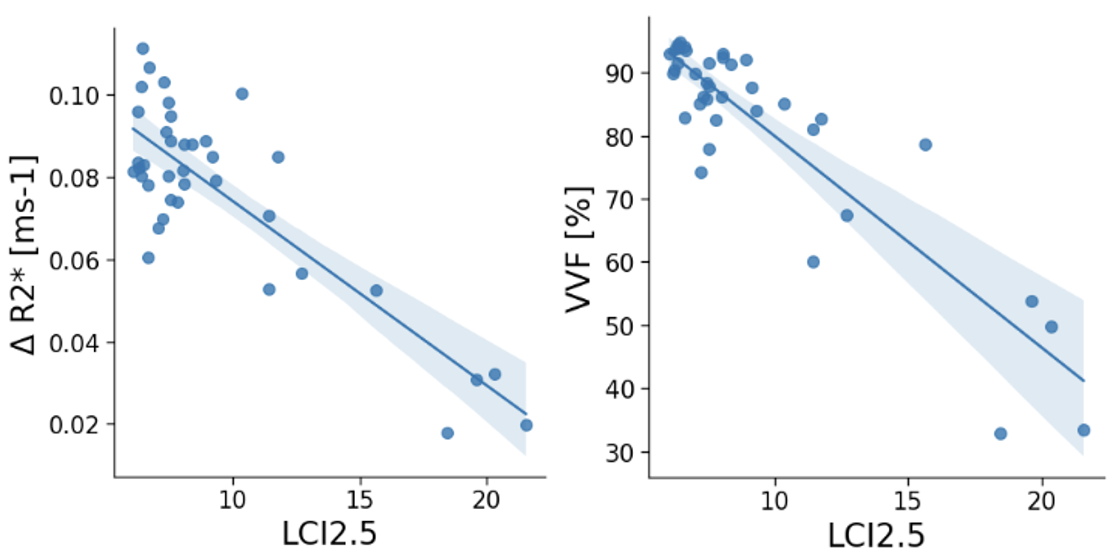
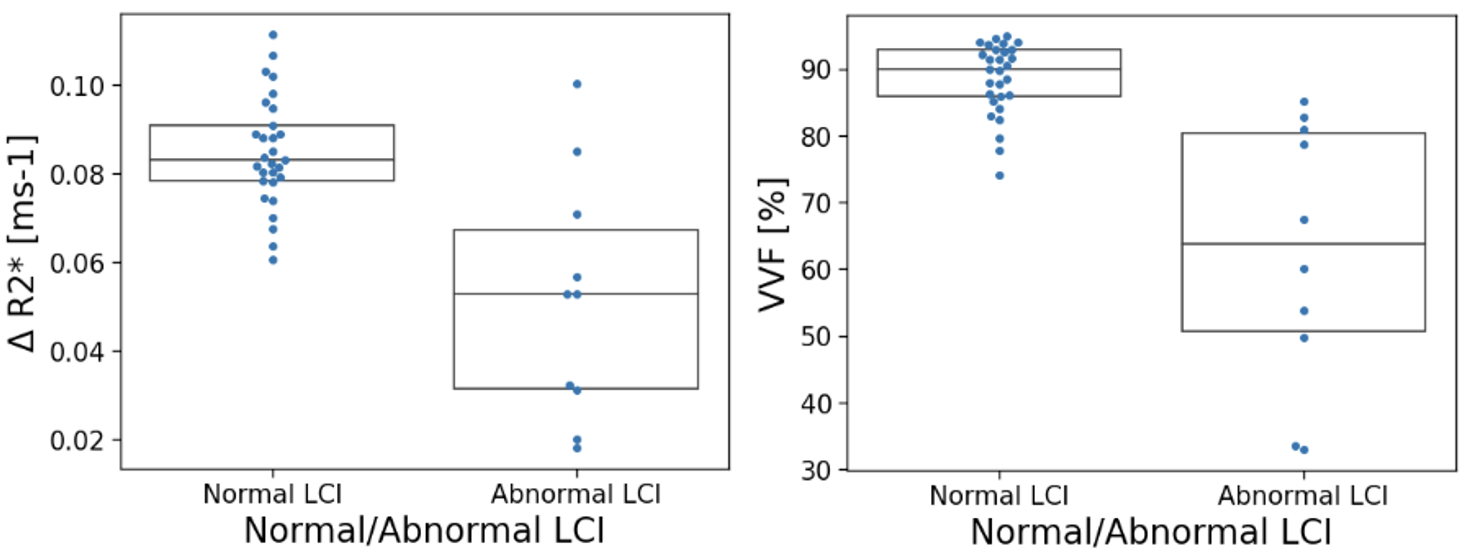
Figure 3 presents the linear correlation of both ∆R2* and VVF with LCI2.5. Correlation between VVF biomarkers and LCI2.5 was very good, while the correlations between ∆R2* and LCI2.5 were fair. Only VVF correlated significantly with FEV1%p and FVC%p did not significantly correlate with the OE-biomarkers. Figure 4 presents a boxplot of ∆R2* and VVF values in the ‘Abnormal LCI2.5’ and ‘Normal LCI2.5’ population. Both imaging parameters significantly distinguish the two categories (∆R2*: p=0.017, VVF: p<0.001).
Discussion
This study presents the first results from a population with CF of a novel, easy-to-implement, free breathing OE-MRI acquisition method based on measuring R2* changes in the lung with varying level of oxygen delivered to the patients.The oxygen ventilated volume fraction obtained presents a very good correlation with LCI2.5. LCI2.5 is a marker of overall lung ventilation inhomogeneity which has been shown to be a sensitive marker of lung disease severity in CF, particularly in the early stage of the disease when FEV1% is normal2.
Conclusion
Oxygen-enhanced MRI biomarkers derived by a 2D multislice free-breathing double-echo T1-FFE sequence at 1.5 T present excellent correlation with the lung clearance index in a cystic fibrosis population.Acknowledgements
Cystic Fibrosis Foundation, grant number 0208A120References
1) Hemberger, K. R., Jakob, P. M., & Breuer, F. A. (2015). Multiparametric oxygen-enhanced functional lung imaging in 3D. Magnetic Resonance Materials in Physics, Biology and Medicine, 28(3), 217-226.
2) Davies, J. C., Cunningham, S., Alton, E. W., & Innes, J. A. (2008). Lung clearance index in CF: a sensitive marker of lung disease severity. Thorax, 63(2), 96-97.
3) Avants, B.B.; Tustison, N.J.; Stauffer, M.; Song, G.; Wu, B.; Gee, J.C. The Insight ToolKit Image Registration Framework. Frontiers in Neuroinformatics 2014, 8, doi:10.3389/fninf.2014.00044.
4) Obert, A. J., Kern, A. L., Gutberlet, M., Voskrebenzev, A., Kaireit, T. F., Crisosto, C., ... & Vogel‐Claussen, J. (2022). Volume‐Controlled 19F MR Ventilation Imaging of Fluorinated Gas. Journal of Magnetic Resonance Imaging.
Figures