1397
Functional connectome allows individual prediction of gait function within Parkinson’s disease and is linked to molecular architecture
Haoting Wu1 and Minming Zhang1
1Radiology, Medical school of Zhejiang university, Hangzhou, China
1Radiology, Medical school of Zhejiang university, Hangzhou, China
Synopsis
Keywords: Parkinson's Disease, fMRI (resting state)
The predictive connectome of PD gait overlapped with the dopaminergic and cholinergic systems.Introduction
In Parkinson's disease (PD), gait dysfunction is one of the main disease characteristics that affects independence and quality of life1. While PD clinical presentation varies significantly across individuals, the extent to which individual gait function is influenced by functional variability in brain networks remains unclear. To this end, this study aimed to identify connectome to predict individual gait function within PD patients. Analyses of the associated receptor/transporter are carried out to detect the potential target of the treatment.Methods
Resting-state functional magnetic resonance imaging (Rs-MRI) of 78 PD patients were included. The gait function was assessed via 10m-walking time. A longer walking time presents a worse gait function. The connection matrix of each patient included 268 nodes belonging to seven functional networks, which included frontoparietal, default mode, motor, visual-related, limbic, basial-ganglia, and cerebellum networks. The functional connectome was first detected within untreated patients (N=48) by using connectome-based predictive modeling (CPM) following leave-one-out cross-validation2, and then validated within treated patients(N=30). The identified connectome was spatially correlated with a density map of 11 receptors/transporter from prior molecular imaging in healthy adults 3.Results
The connectome successfully predicted the walking time of untreated patients (r=0.309, ppermu=0.044). This prediction remained in treated patients (r=0.381, p=0.038). The lesioned CPM analyses revealed that after excluding motor, basial-ganglia, and visual-related networks, the connectome failed to predict gait function within patients. The motor network contained more negative connections (whose strength was negatively correlated with walking time), which mainly connected regions within itself and regions belonging to the limbic network. Both basial-ganglia and visual networks contained more positive connections (whose strength was positively correlated with walking time), and most of these connections connected regions belong to these two networks and regions belong to the visual network. The pattern of negative connections was positively associated with the density of D2/3 receptor (r = 0.237, p <0.00, q=0.002) and vesicular acetylcholine transporter (r = 0.217, p <0.001, q=0.002).Discussions
In PD patients, deceased gait function was linked to dysfunctional motor networks as well as overactivated non-motor networks. The increased connection strength between and within non-motor networks revealed the potential compensatory mechanism to overcome gait impairment. And the network dysfunction related to PD gait impairment might be caused by the alternation of the dopaminergic and cholinergic systems.Conclusion
A robust association between the functional connectome and gait function was detected in PD patients. The connection pattern of the connectome revealed the underlying network mechanism leading to PD gait impairment and associated molecular architecture, which aid in developing target treatment for gait dysfunction among PD patients.Acknowledgements
NoneReferences
- Mirelman A, Bonato P, Camicioli R, et al. Gait impairments in Parkinson's disease. The Lancet Neurology. 2019;18(7):697-708.2.
- Shen X, Finn ES, Scheinost D, et al. Using connectome-based predictive modeling to predict individual behavior from brain connectivity. Nature protocols. 2017;12(3):506-518.3.
- Dukart J, Holiga S, Rullmann M, et al. JuSpace: A tool for spatial correlation analyses of magnetic resonance imaging data with nuclear imaging derived neurotransmitter maps. Human brain mapping. 2021;42(3):555-566.
Figures
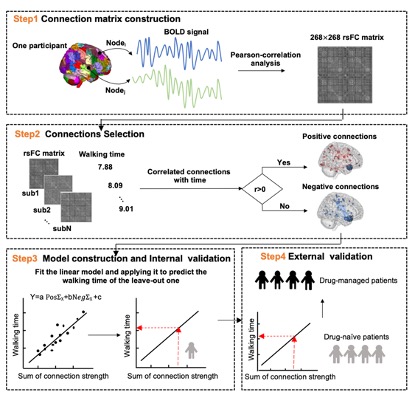
Figure1 The flow chat of identifying connectome for predicting gait function within PD patients.
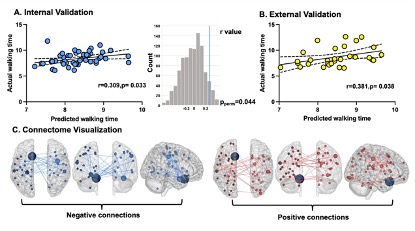
Figure2 A) Using the leave-one-out cross validation for internal validation within drug-naïve group, the prediction of connectome was assessed via Pearson-correlation between actual and predicted walking time. The significance of prediction was confirmed within 1000-times permutation test. B) Connections selected at least 80% iteration during cross-validation were enrolled for final connectome and further validated within drug-managed group. C) The final connectome including 108 positive (red) and 94 negative (blue) connections
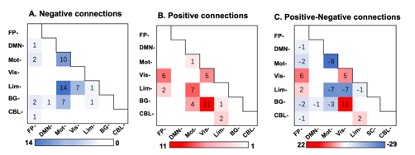
Figure3 Within- and between-network negative connections (A), positive connections (B) and the positive minus the negative connections (C) are summarized based on networks. In graph A and B, cells represent the total number of connections connect nodes within (and between) each network, with darker colors indicating a greater number of connections. In graph C, cells represent the number of positive versus negative connections connecting nodes within (and between) each network.
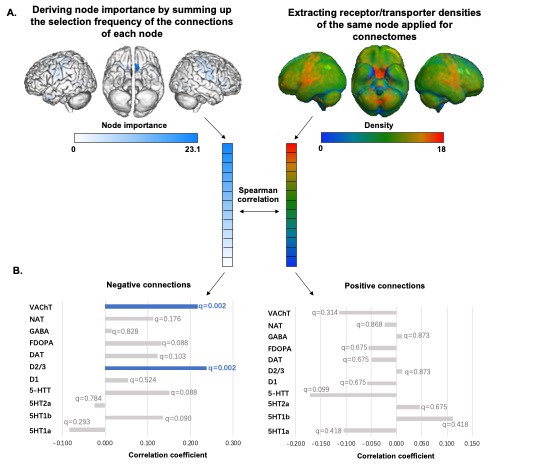
Figure4 A) The spatial correlation between identified connectome and receptor/transporter densities was conducted by calculating the spearman correlation between node importance and receptor/transporter densities calculated for these nodes. B) The bar presented the spearman correlation coefficients between node importance and receptor/transporter densities. Node importance (within negative connections) positively correlated with densities of D2/3 and VAChT, which presented in blue bars.
DOI: https://doi.org/10.58530/2023/1397