1392
Multiparametric qMRI and dMRI gradients in the striatum are associated with Parkinson’s disease motor dysfunction
Elior Drori1, Lee Cohen1, Einat Kohn2, David Arkadir3, Gilad Yahalom2, and Aviv A Mezer1
1The Edmond and Lily Safra Center for Brain Sciences, The Hebrew University of Jerusalem, Jerusalem, Israel, 2The Department of Neurology, Shaare Zedek Medical Center, Jerusalem, Israel, 3The Department of Neurology, Hadassah Medical Center, The Hebrew University of Jerusalem, Jerusalem, Israel
1The Edmond and Lily Safra Center for Brain Sciences, The Hebrew University of Jerusalem, Jerusalem, Israel, 2The Department of Neurology, Shaare Zedek Medical Center, Jerusalem, Israel, 3The Department of Neurology, Hadassah Medical Center, The Hebrew University of Jerusalem, Jerusalem, Israel
Synopsis
Keywords: Parkinson's Disease, Quantitative Imaging, striatum
Parkinson’s disease (PD) is associated with degeneration in the striatum, a deep brain structure. It was recently shown with clinical MRI that in vivo gradients in the striatum of PD patients are related to the early-stage symptoms and pathology. However, the spatial variation in quantitative biophysical properties in PD is still unknown. Here, we collected multiparametric quantitative MRI of PD patients. We reveal distinct spatial profiles in the striatum that corroborate previous findings and show a relationship between putamen water fraction and motor behavior. Thus, our study provides new insights for the biological mechanisms associated with PD behavior.
Introduction
The striatum is involved in motor control and goal-directed behavior, which are affected in neurodegenerative diseases such as Parkinson’s disease (PD) 1. Using semi-quantitative ratio of clinical T1 and T2 weighted images (T1w/T2w), it was recently shown that microstructural gradients in the putamen change in early-stage PD patients 2. To shed light on the biological sources of this observation quantitatively, we scanned a dataset of PD and control subjects (N=85) for multiparametric quantitative MRI (qMRI) and diffusion MRI (dMRI) mappings. We apply the same gradient method to measure the spatial variation of quantitative biophysical measurements such as the relaxometry rates R1, R2 and R2*, magnetization transfer saturation (MTsat), the macromolecular tissue volume (MTV), the mean diffusivity (MD) and the fractional anisotropy (FA). We uncover distinct spatial profiles of these different measurements in the striatum, as well as different PD-related changes in these profiles. Moreover, we corroborate the previous findings by showing relationships between profile asymmetry and the asymmetry in motor dysfunction, assessed clinically using MDS-UPDRS-III. Importantly, this relationship is dependent both on the biophysical measurement and the degree of symptom asymmetry. Hence, our multiparametric qMRI data provides an important framework for understanding specific tissue sources underlying PD phenotype in the single subject, which may prove useful for diagnostic applications.Methods
Subjects. Participants were 59 PD patients (aged 69.5±8.7 years, 22 females) and 26 healthy controls (aged 68.6±7.3 years, 9 females). For the PD group, disease stage (Hoehn & Yahr) was 2.1±0.8, disease duration was 6±5.2 years, MDS-UPDRS-III score was 31.3±12.4 and MoCA score was 23±3.9.Imaging. Whole-brain 3T MRI scans were performed for quantitative mappings of R1, R2, R2*, MTV and MTsat, as described in Filo et al.3 For R1, MTV, R2* and MTsat, we used siemens FLASH sequence in 1-mm3 with SEIR data for B1+ bias correction 4. R1 and MTV were estimated using mrQ 4, R2* was fitted using MPM 5, and MTsat was computed as described in Helms et al.6 For R2 mappings, multi-SE 2-mm3 images were acquired. Single-exponent R2 was linearly fitted using 9 equally spaced TEs (24-120 ms) 7. For MD and FA, whole-brain DTI measurements were performed using a diffusion-weighted spin-echo EPI sequence with 1.5-mm3 resolution and gradients applied at 64 directions, as described in Filo et al.3 Diffusion parameters were estimated using FSL’s dtifit with topup and eddy corrections 8,9.
Motor assessment. Motor symptoms were assessed through MDS-UPDRS-III. Motor asymmetry was calculated as the raw score for left body-side items minus the raw score for right body-side items.
Structural gradients. We applied a recently developed gradient analysis for the striatum (see https://github.com/MezerLab/mrGrad) 2. This method yields quantitative MRI profiles along the three main axes of the putamen and caudate, on the single subject level.
Results
We found distinct spatial profiles of qMRI parameters (R1, R2, R2*, MTV, MTsat), and dMRI parameters (MD, FA) in the putamen and caudate of our subjects (Fig.1). In both healthy controls (N=26) and PD patients (N=59) we found increasing R1, R2, R2*, MTV and MTsat gradients along the anterior-posterior (AP) axis of the left and right putamen (mixed-effects linear models, p < 0.001). Moreover, all these qMRI gradients were correlated with the mean T1w/T2w gradient reported recently in an independent PD dataset 2, suggesting that T1w/T2w spatial variability in the striatum indeed reflects variability in biophysical properties (Fig.2).Importantly, we found that R1, R2 and MTV gradients were less steep in PD compared to healthy controls, and the largest difference between groups was in the posterior putamen. In these three qMRI parameters, we found that the interhemispheric asymmetry in the posterior putamen was contralaterally correlated with motor symptoms asymmetry (assessed with MDS-UPDRS-III), in PD patients with mild motor asymmetry (Fig.3A, B). All these qMRI results replicate previous findings in T1w/T2w 2.
Including patients with extreme motor asymmetry tampered the relationship, though it remained significant in MTV (Fig.3C). Importantly, the relationship between MTV and motor dysfunction suggests that the measured structural change associated with motor dysfunction mainly reflects decreased tissue density, i.e., increased water fraction.
While R1, R2 and MTV showed associations with motor asymmetry – R2*, MTsat and diffusion parameters (MD, FA) did not show such relationships. However, MD was increased in the posterior putamen of PD patients, providing further evidence for an increased water fraction.
Conclusions
Our study provides quantitative multiparametric mapping of the biophysical spatial variability in the striatum of PD patients. We uncover a relationship between local water fraction increases in the putamen and motor dysfunction. Importantly, our results corroborate previous findings in semi-quantitative MRI images, providing new insights for the tissue sources of variation and its relation to behavior in PD. Our approach provides another crucial contribution to non-invasive characterization of PD biological mechanisms in individual patients, and may promote early diagnosis and personalized medicine. Future research may apply the current methods in other basal-ganglia diseases such as Huntington’s disease and addictive disorders.Acknowledgements
No acknowledgement found.References
- Redgrave, P. et al. Goal-directed and habitual control in the basal ganglia: Implications for Parkinson’s disease. Nature Reviews Neuroscience 11, 760–772 (2010).
- Drori, E., Berman, S. & Mezer, A. A. Mapping microstructural gradients of the human striatum in normal aging and Parkinson’s disease. Sci. Adv. 8 (2022).
- Filo, S. et al. Disentangling molecular alterations from water-content changes in the aging human brain using quantitative MRI. Nat. Commun. 10 (2019).
- Mezer, A. et al. Quantifying the local tissue volume and composition in individual brains with magnetic resonance imaging. Nat. Med. 19, 1667–1672 (2013).
- Weiskopf, N. et al. Quantitative multi-parameter mapping of R1, PD*, MT, and R2* at 3T: a multi-center validation. Front. Neurosci. 7 (2013).
- Helms, G., Dathe, H., Kallenberg, K. & Dechent, P. High-resolution maps of magnetization transfer with inherent correction for RF inhomogeneity and T1 relaxation obtained from 3D FLASH MRI. Magn. Reson. Med. 60, 1396–1407 (2008).
- Dowell, N. G. and Wood, T. C. T2: Transverse Relaxation Time. in Quantitative MRI of the Brain: Principles of Physical Measurement (eds. Cercignani, M., Dowell, N. G., and Tofts, P. S.) 83-96 (CRC Press, Boca Raton, 2018)
- Smith, S. M. et al. Advances in functional and structural MR image analysis and implementation as FSL. NeuroImage 23, S208–S219 (2004).
- Andersson, J. L. R. & Sotiropoulos, S. N. An integrated approach to correction for off-resonance effects and subject movement in diffusion MR imaging. Neuroimage 125, 1063–1078 (2016).
Figures
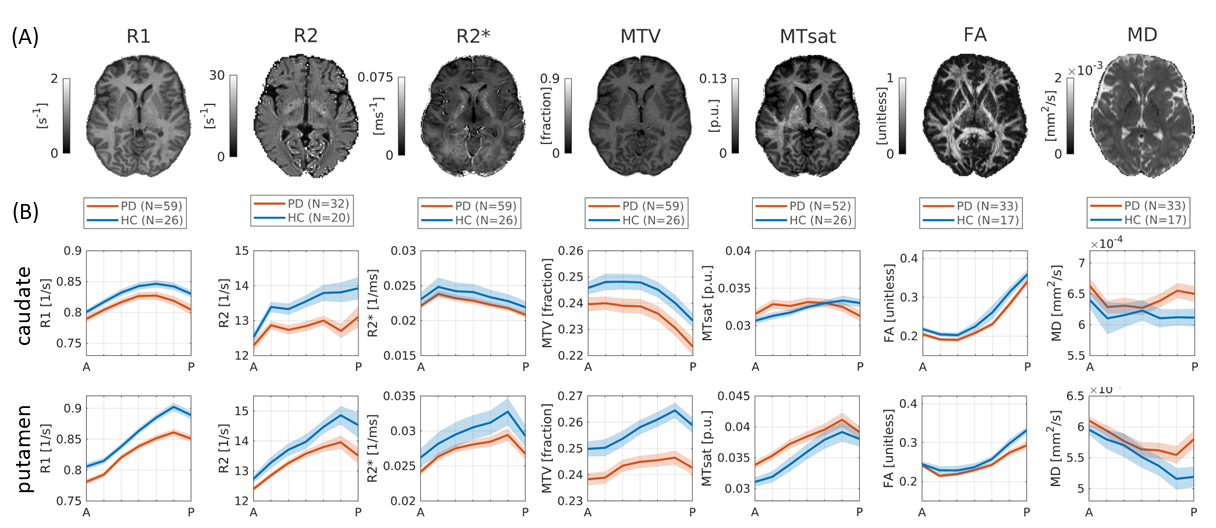
Figure 1 - quantitative
multiparametric gradients in the striatum and PD-related changes. (A) Representative axial slices of qMRI and dMRI
brain maps of a single subject. (B) Multiparameter spatial profiles along the
AP axis of the caudate (top) and the putamen (bottom) in healthy controls
(blue) and PD patients (red).
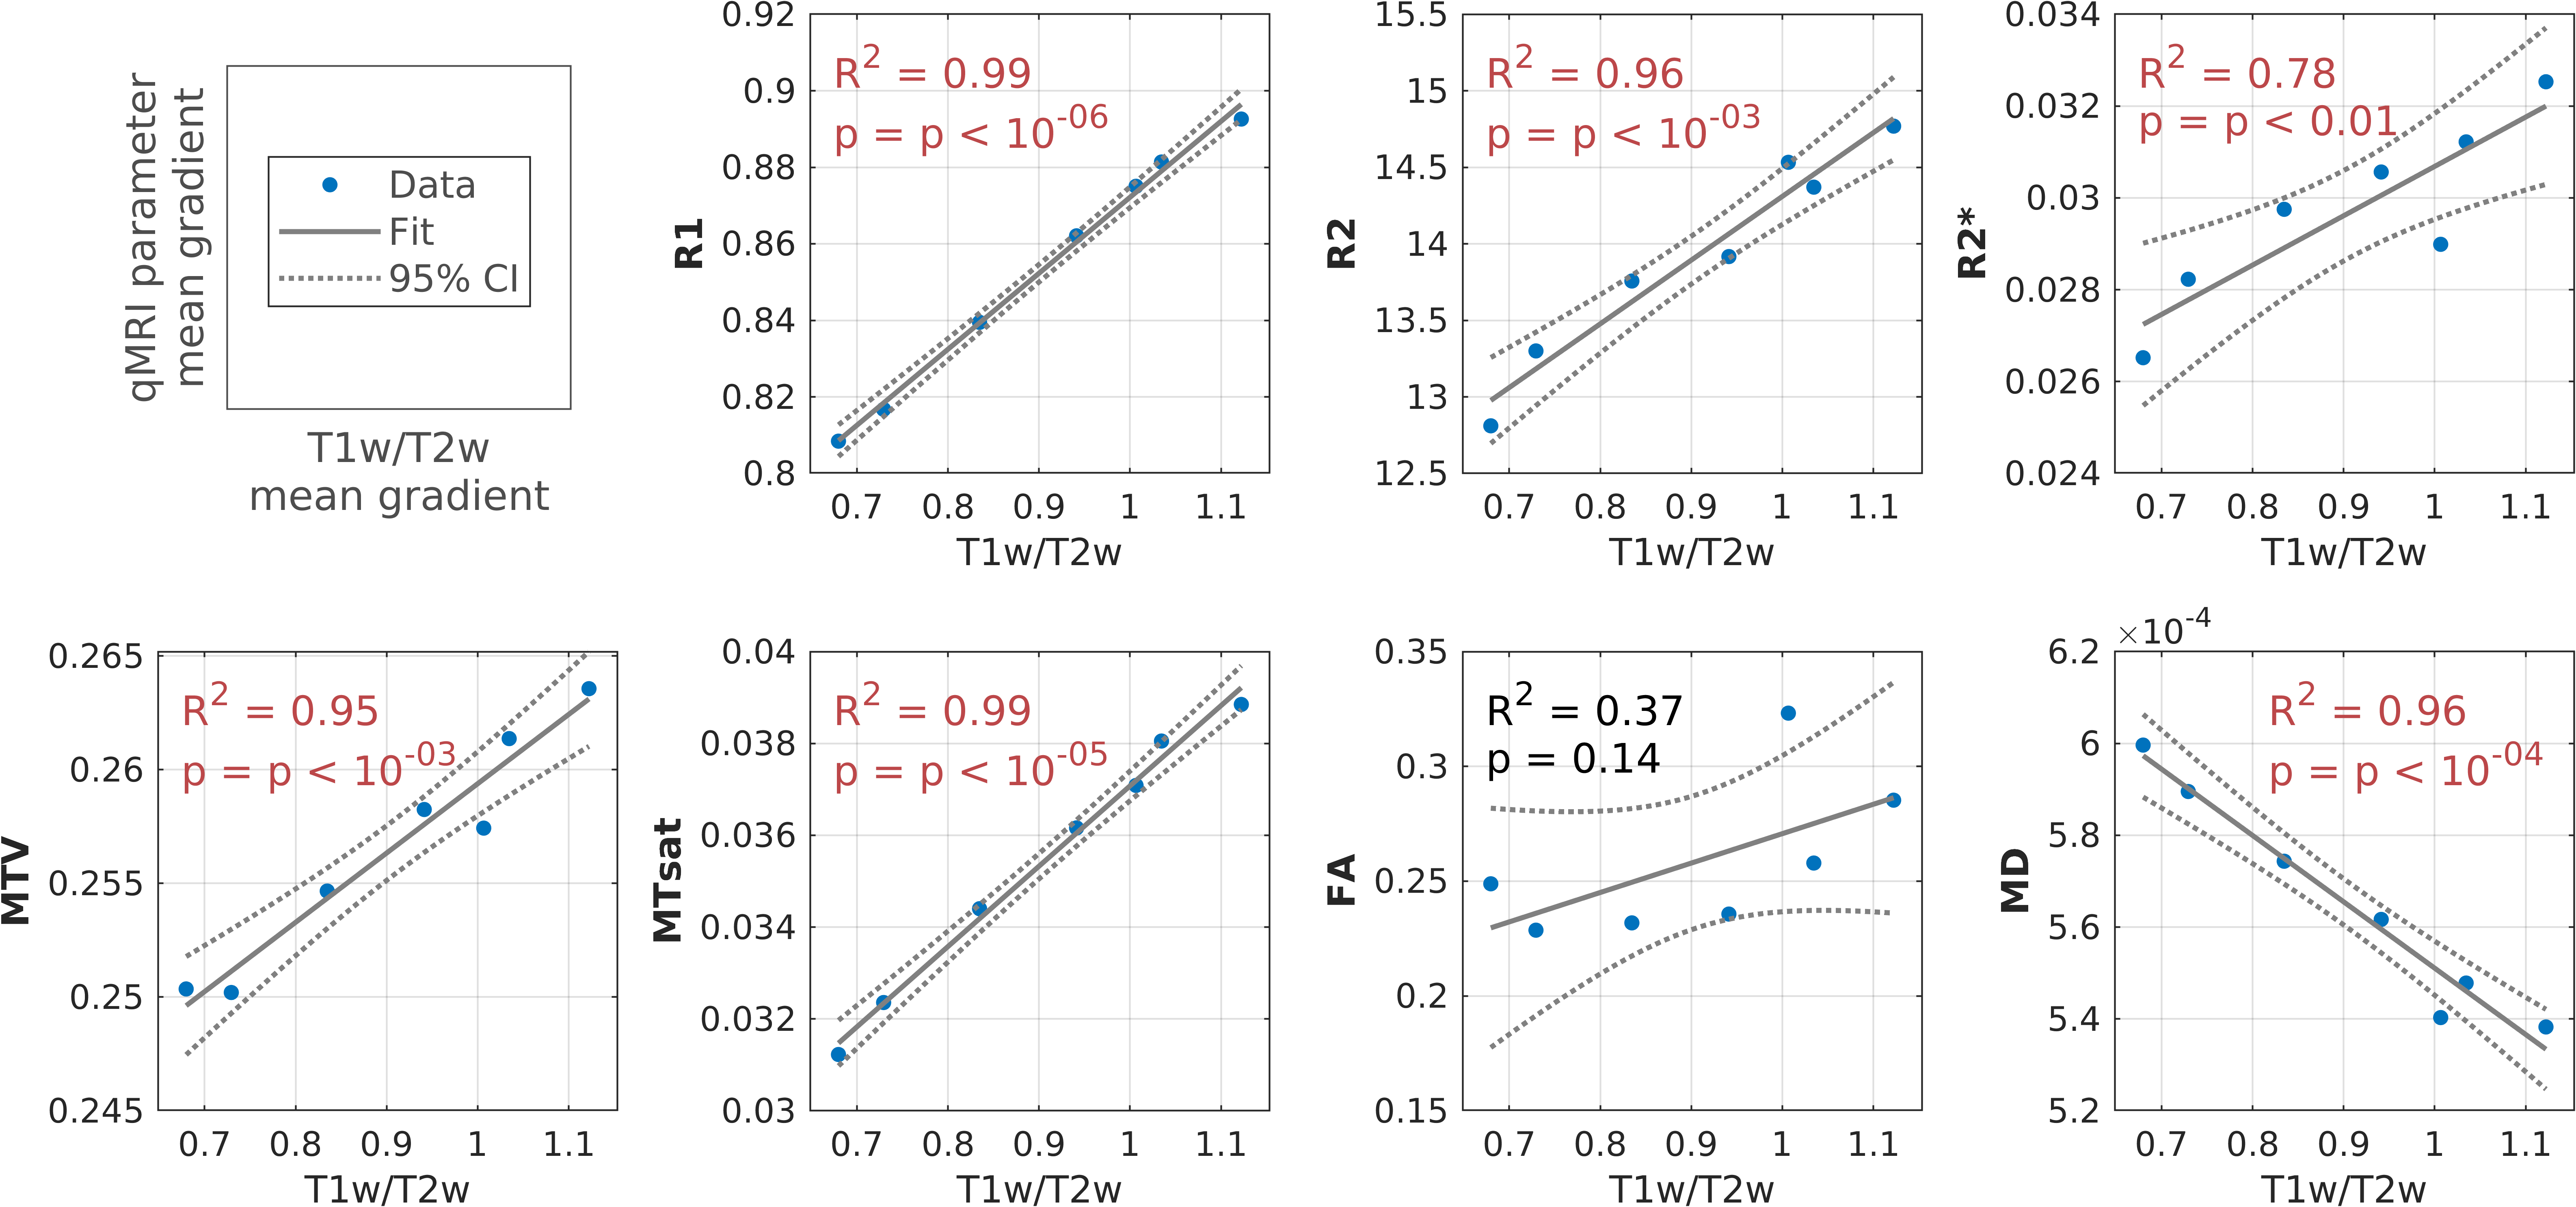
Figure
2 – qMRI gradients in the putamen are correlated
with T1w/T2w gradients. In
each panel the correlation along the AP axis of the putamen is shown between
the mean T1w/T2w gradient found previously in Drori et al.2 (healthy controls, N=46; x-axis), and the mean
spatial variation of the qMRI or dMRI parameter in the new dataset (y-axis).
Positive linear correlations were found between the T1w/T2w gradient and either
R1, R2, R2*, MTV and MTsat gradients, and a negative correlation was found
between T1w/T2w and MD.
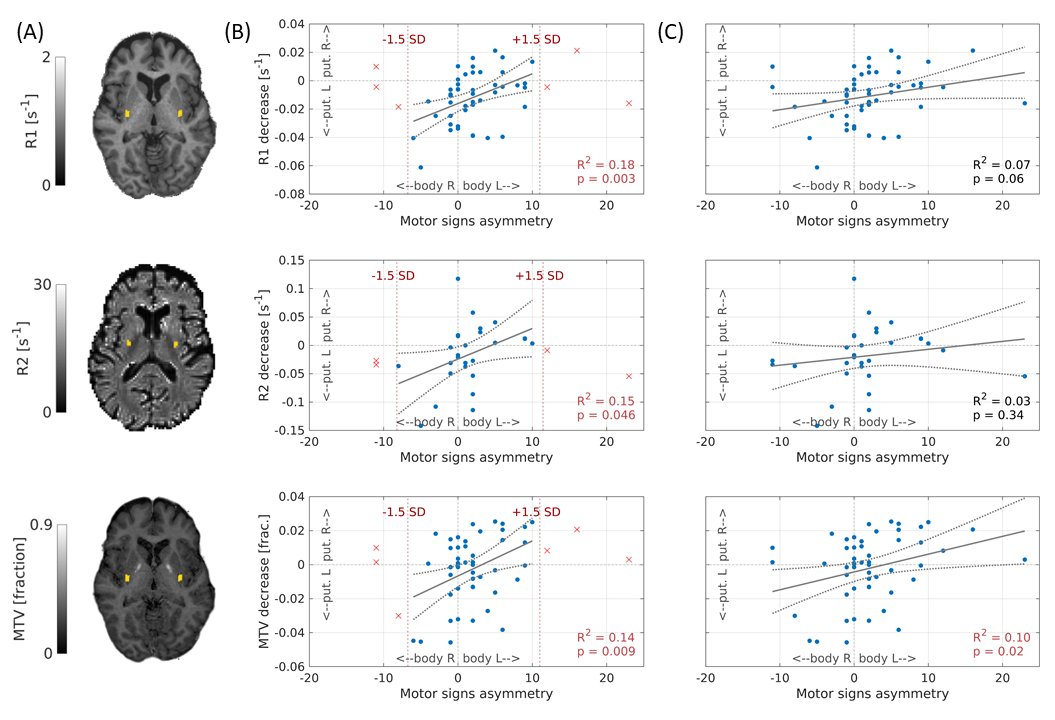
Figure
3 – qMRI gradient asymmetry is correlated with motor
dysfunction asymmetry in non-extreme patients. (A) Representative axial slices of R1, R2 and MTV
maps. The posterior part of the putamen is masked in yellow. (B) When
considering patients with motor asymmetry within the range of ±1.5 SD,
significant correlations are found between the motor asymmetry and either R1,
R2, and MTV asymmetries in the posterior putamen. (C) Considering all PD
patients, including outliers of motor asymmetry, tampers the correlations.
However, it remains significant for MTV.
DOI: https://doi.org/10.58530/2023/1392