1390
A 3D nigrosome atlas based on multi-modal histology and multi-parametric quantitative MRI1Department of Neurophysics, Max Planck Institute for Human Cognitive and Brain Sciences, Leipzig, Germany, 2Center for Cognitive Neuroscience Berlin, Freie Universität Berlin, Berlin, Germany, 3Integrative Model-based Cognitive Neuroscience Research Unit, University of Amsterdam, Amsterdam, Netherlands, 4Paul Flechsig Institute - Center of Neuropathology and Brain Research, Leipzig University, Leipzig, Germany, 5Department of Anatomy and Embryology, Maastricht University, Maastricht, Netherlands, 6Felix Bloch Institute for Solid State Physics, Leipzig University, Leipzig, Germany
Synopsis
Keywords: Parkinson's Disease, Multimodal, Atlas, Subcortex
MRI holds great promise to unravel the selective vulnerability and functional differentiation of the nigrosomes in the human substantia nigra pars compacta. Based on block-face imaging and calbindin-D28K immunohistochemistry, we constructed a 3D nigrosome atlas. Using this atlas, we demonstrate several nigrosomes to show increased R2* values in post mortem tissue. Our results further challenge the common identification of the nigrosomes with hyperintense structures in in vivo MRI, particularly nigrosome 1 and the swallow tail sign.
Introduction
Dopaminergic neurons (DNs) in human substantia nigra pars compacta (SNpc) form five DN-dense clusters called the nigrosomes.1 Defined by low calbindin immunoreactivity,1 the five nigrosomes differ in their vulnerability to Parkinson’s disease, as indicated by differences in severity and temporal onset of neurodegeneration.2 Moreover, nigrosomes probably differ in their functional specializations, as was extrapolated from primate studies.3 Hence, in vivo mapping of nigrosomes promises a unique window into human dopaminergic function and pathology.MRI is a promising, non-invasive technique for imaging the internal anatomy of the SN. Past research leveraged two MRI techniques for SN imaging: T2*-weighted (T2*w) imaging,4 which is sensitive to iron in DNs,5 and a sequence sensitive to neuromelanin, an important iron storage polymer in DNs6. Despite studies correlating altered MRI signal with nigral pathology,7,8 9 the relation between the observed nigral MRI contrast and the nigrosomes is not fully clear. Early studies identified putative nigrosomes with hyperintense areas in T2*w images.8 Later results challenged this identification.10 Recent progress in neuromelanin-sensitive MRI at 7T visualized rich contrast features within the SN.11. Nevertheless, the relation of these contrast features to the nigrosomes is not yet clear. A 3D histological nigral atlas would help to answer these questions.
Due to the nigrosomes’ small size and complex arrangement in the bean-sized SN, these areas are not part of state-of-the-art MRI subcortical atlases.12 That complicates the translation of the nigrosome definition from 2D histological sections to 3D MRI space while preserving the fine-grained nigrosome anatomy.
We build a 3D histological nigrosome atlas for imaging the SN, using 3D-reconstructed block-face imaging and immunohistochemistry. Using this atlas, we measure an increased effective transverse relaxation rate R2* in several nigrosomes, in contrast to their widespread identification as hyperintense areas in T2*w images in vivo.
Methods
We analyzed published post mortem multi-modal 3D histology datasets13 combining block face imaging, histological and immunohistochemical stains, and ultra-high resolution multi-parametric mapping.3D block-face images (BFI) from three post mortem brains13 (79y male, 80y male, 75y female) with a resolution of 150x150x200µm3 were analyzed. We segmented areas with a high density of neuromelanin-pigmented DNs and the morphology of the nigrosomes following Damier et al.1 on BFI (Fig. 1). We defined these DN-rich regions as the nigrosomes. We confirmed low calbindin immunoreactivity in donor 2 (80y male, Fig 1C, 1D). We created a mask of the region directly surrounding each nigrosome by dilating the respective mask with a (0.3mm)3 cubic kernel.
We generated a nigrosome atlas by transforming nigrosome segmentations from the three donors into the space of donor brain 2. A previously published transformation of donor brain 2 translated the nigrosome atlas to MNI space.13
The post mortem T2*w images were acquired on three whole heads13 at 7T (Magnetom 7T, Siemens Healthineers, Erlangen) as a part of a multiparametric mapping acquisition13 (0.4mm isotropic resolution; flip angle 7°; echo times TE1-8=3.44, 6.04, ..., 21.6ms; repetition time TR=31.8ms). Quantitative R2* maps were calculated from the signal’s logarithm using an ordinary least-squares algorithm. For each donor's brain, post mortem T2*w MRI data and BFI were affinely registered based on anatomical landmarks, including small vessels, outside of SN. Between donors' brains, we registered T2*w MRI data using non-linear registration of the ANTs software.
Results
We observed a consistent 3D arrangement of the nigrosomes for all three donor brains (Fig 1E).The volumes of nigrosomes were greater for nigrosomes containing larger numbers of DNs according to Damier et al.: N1>N2>N4>N3≅N5 for both volume and DN count (Fig 2).1
We evaluated R2* in the nigrosomes (Fig 3A, 3B). We found consistently high rates ranging from 55s⁻¹ to 75s⁻¹ (Fig 3C). Comparing the R2* rates in the nigrosomes to the rates in the directly surrounding tissue, we found significantly increased R2* rates in the larger nigrosomes N1, N2, and N4 (Fig 3D). The smaller nigrosomes N3 and N5 showed inconsistent R2* differences to their surrounding tissue.
Discussion and Conclusion
We establish the first histology-based 3D nigrosome atlas for a wide variety of neuroscience and neuroimaging applications. This atlas will help study the functional specialization and connectivity of the nigrosomes and understand their vulnerability in Parkinsonism.The spatial relation of the nigrosomes in our atlas, generated following the original definition,1 closely mirrored nigrosome arrangement shown on 2D MR images.14 Similarly, our nigrosome atlas closely resembled an earlier histology-based 3D rendering of the SNpc, even though the segmentation approach differed.15
The increased R2* rate of the larger nigrosomes is in line with several previous post mortem studies reporting increased rates in areas of high DN density.10
Our 3D nigrosome atlas will help us to quantity changes in the nigrosomes in vivo in healthy aging and pathologies such as PD when revisiting previous studies8 and current trials. Integrating this atlas into state-of-the-art brainstem atlases enables studying pathologic changes in the nigrosomes2 by increasing the spatial specificity of MRI measures. This atlas may enable revealing the functional segregation of the nigrosomes in humans, as was observed in non-human primates.3 Our precise understanding of 3D nigrosome anatomy provides crucial guidance for advancing MRI nigrosome imaging.
Acknowledgements
We thank the whole-body donation program at the University of Maastricht for providing post mortem brain samples.13
The research leading to these results has received funding from the European Research Council under the European Union's Seventh Framework Program (FP7/2007-2013) / ERC grant agreement n° 616905. This project has received funding from the European Union's Horizon 2020 research and innovation programme under grant agreement No 681094 and is supported by the Swiss State Secretariat for Education, Research and Innovation (SERI) under contract number 15.0137. This project has also received funding from the BMBF (01EW1711A & B) in the framework of ERA-NET NEURON. This research was financially supported by STW/NWO, NWO VICI, the European Research Council (no. 616905), Brain Foundation of the Netherlands, and Stichting Internationaal Parkinson Fonds. The research leading to parts of these results has received funding from the DFG, PP 2041 Computational Connectomics (MO 2249/3-1, MO 2249/3-2 and KI 1337/2-2), and the Alzheimer Forschung Initiative (AFI#18072) to M.M.
M. Brammerloh has received funding from the International Max Planck Research School on Neuroscience of Communication: Function, Structure, and Plasticity.
References
1. Damier P, Hirsch EC, Agid Y, Graybiel AM. The substantia nigra of the human brain. I. Nigrosomes and the nigral matrix, a compartmental organization based on calbindin D(28K) immunohistochemistry. Brain. 1999;122(8):1421-1436. doi:10.1093/brain/122.8.1421
2. Damier P, Hirsch EC, Agid Y, Graybiel AM. The substantia nigra of the human brain. II. Patterns of loss of dopamine-containing neurons in Parkinson’s disease. Brain J Neurol. 1999;122(8):1437-1448.
3. Haber SN, Knutson B. The Reward Circuit: Linking Primate Anatomy and Human Imaging. Neuropsychopharmacology. 2010;35(1):4-26. doi:10.1038/npp.2009.129
4. Lehericy S, Vaillancourt DE, Seppi K, et al. The role of high-field magnetic resonance imaging in parkinsonian disorders: Pushing the boundaries forward. Mov Disord. 2017;32(4):510-525. doi:10.1002/mds.26968
5. Brammerloh M, Morawski M, Friedrich I, et al. Measuring the iron content of dopaminergic neurons in substantia nigra with MRI relaxometry. NeuroImage. 2021;239:118255. doi:10.1016/j.neuroimage.2021.118255
6. Sasaki M, Shibata E, Tohyama K, et al. Neuromelanin magnetic resonance imaging of locus ceruleus and substantia nigra in Parkinson’s disease. NeuroReport. 2006;17(11):1215-1218. doi:10.1097/01.wnr.0000227984.84927.a7
7. Gaurav R, Yahia‐Cherif L, Pyatigorskaya N, et al. Longitudinal Changes in Neuromelanin MRI Signal in Parkinson’s Disease: A Progression Marker. Mov Disord. n/a(n/a). doi:https://doi.org/10.1002/mds.28531
8. Schwarz ST, Mougin O, Xing Y, et al. Parkinson’s disease related signal change in the nigrosomes 1–5 and the substantia nigra using T2* weighted 7T MRI. NeuroImage Clin. 2018;19:683-689. doi:10.1016/j.nicl.2018.05.027
9. Cassidy CM, Zucca FA, Girgis RR, et al. Neuromelanin-sensitive MRI as a noninvasive proxy measure of dopamine function in the human brain. Proc Natl Acad Sci. 2019;116(11):5108-5117. doi:10.1073/pnas.1807983116
10. Brammerloh M, Kirilina E, Alkemade A, et al. Swallow Tail Sign: Revisited. Radiology. Published online August 16, 2022:212696. doi:10.1148/radiol.212696
11. Rua C, O’Callaghan C, Ye R, et al. Substantia nigra ferric overload and neuromelanin loss in Parkinson’s disease measured with 7T MRI. Published online April 20, 2021:2021.04.13.21255416. doi:10.1101/2021.04.13.21255416
12. Bazin PL, Alkemade A, Mulder MJ, Henry AG, Forstmann BU. Multi-contrast anatomical subcortical structures parcellation. Verstynen T, Frank MJ, Verstynen T, Neumann WJ, eds. eLife. 2020;9:e59430. doi:10.7554/eLife.59430
13. Alkemade A, Bazin PL, Balesar R, et al. A unified 3D map of microscopic architecture and MRI of the human brain. Sci Adv. 2022;8(17):eabj7892. doi:10.1126/sciadv.abj7892
14. Massey L, Miranda M, Al-Helli O, et al. 9.4T MR microscopy of the substantia nigra with pathological validation in controls and disease. NeuroImage Clin. 2017;13:154-163. doi:10.1016/j.nicl.2016.11.015
15. Di Lorenzo Alho AT, Suemoto CK, Polichiso L, et al. Three-Dimensional and Stereological Characterization of the Human Substantia Nigra During Aging. Brain Struct Funct. 2016;221(7):3393-3403. doi:10.1007/s00429-015-1108-6
Figures
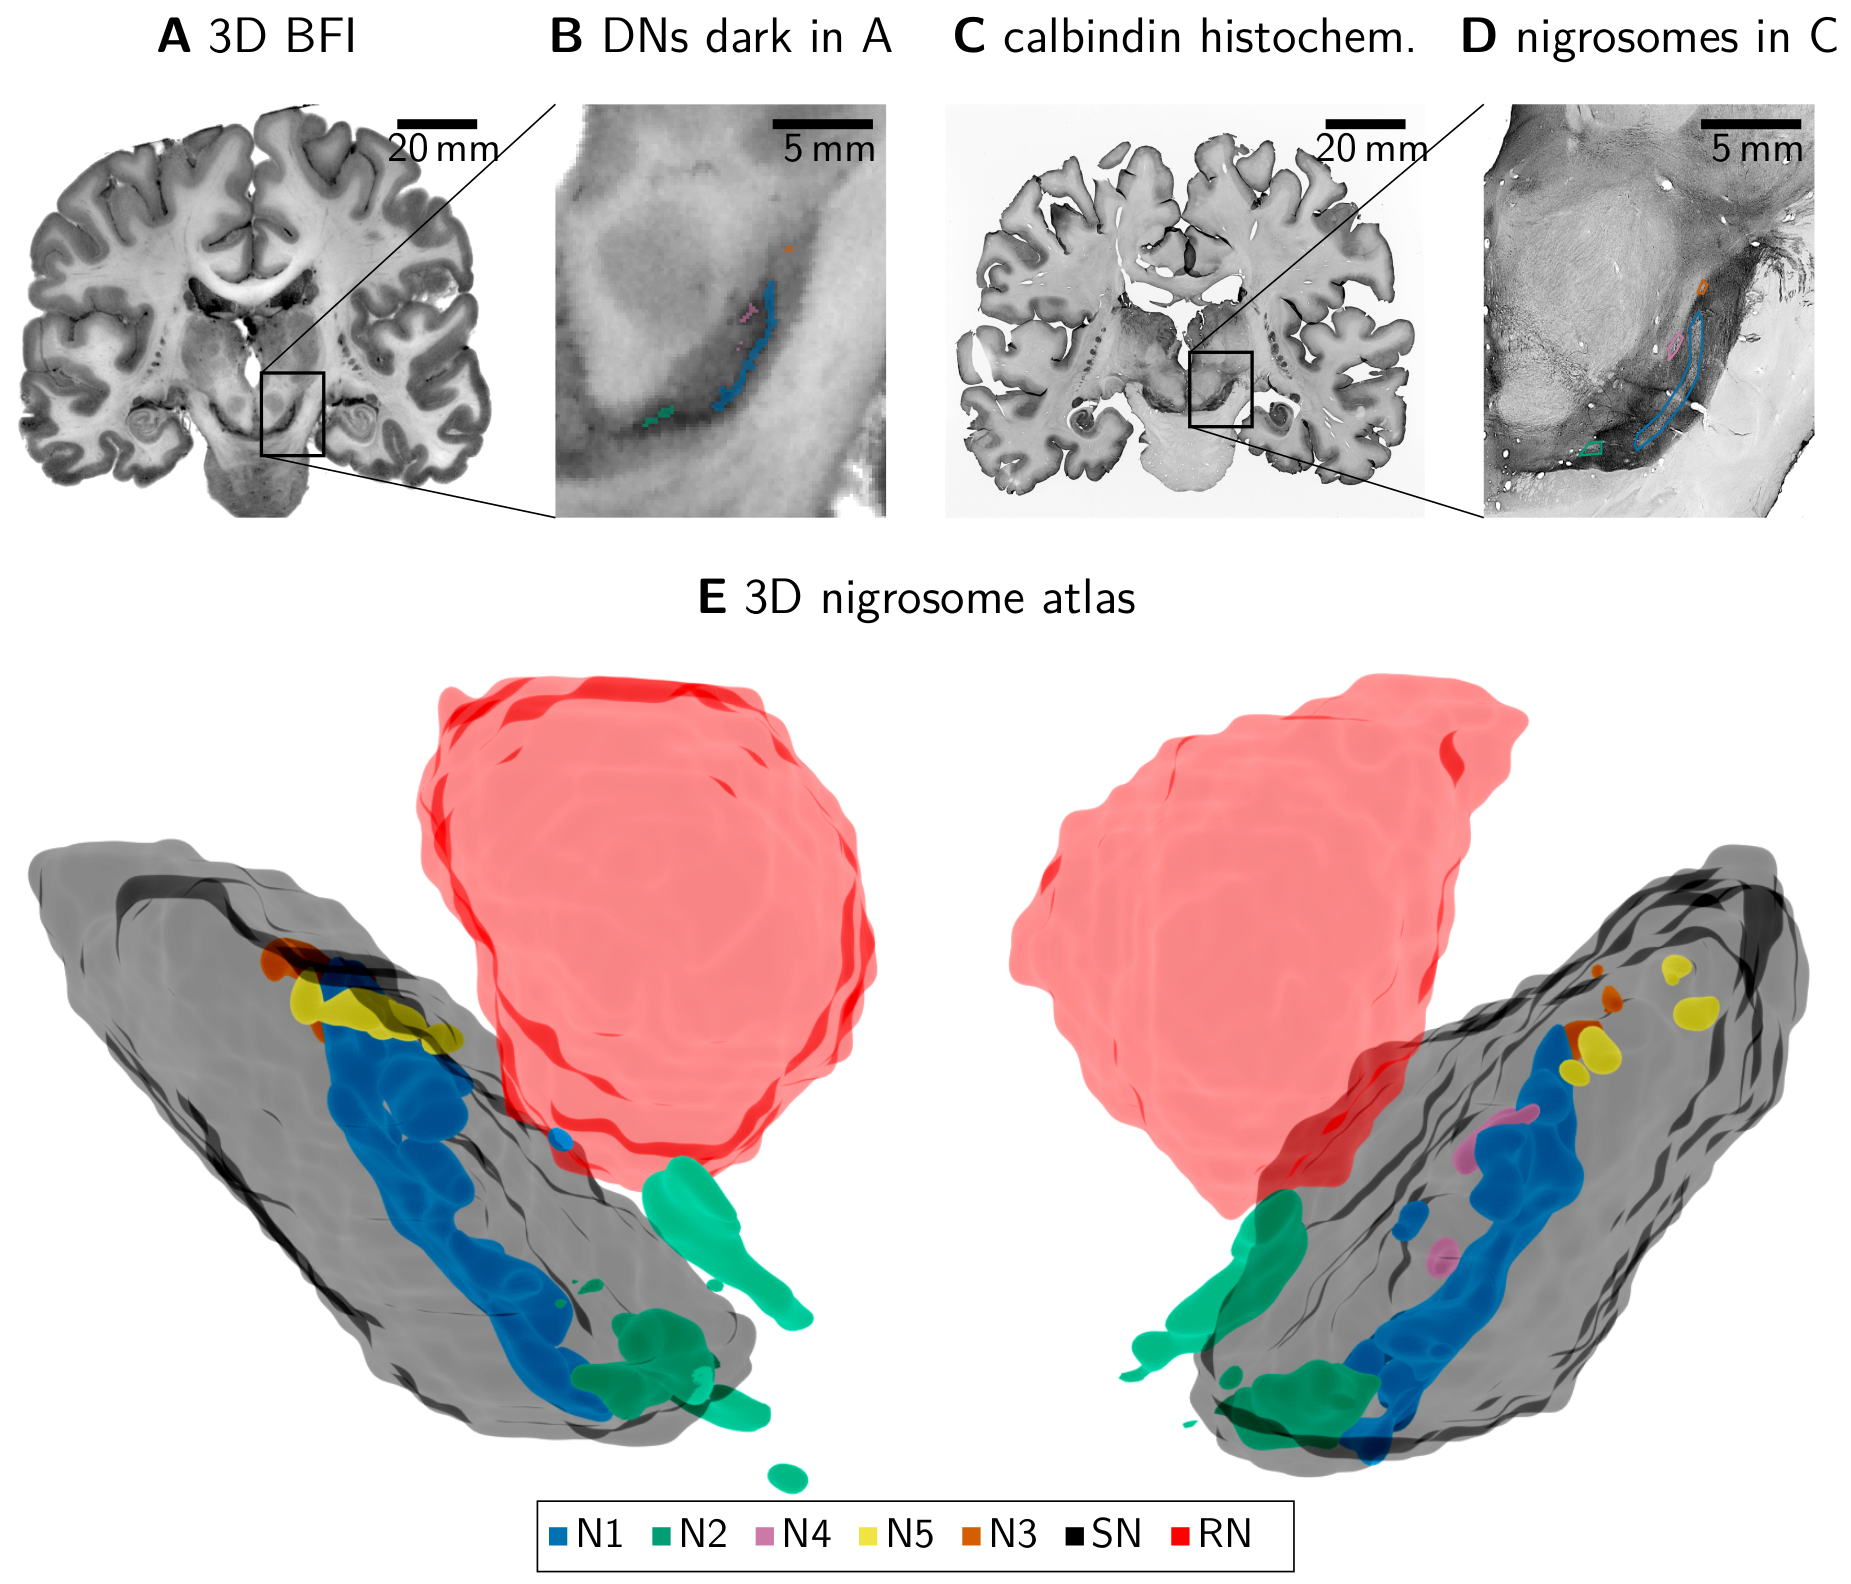
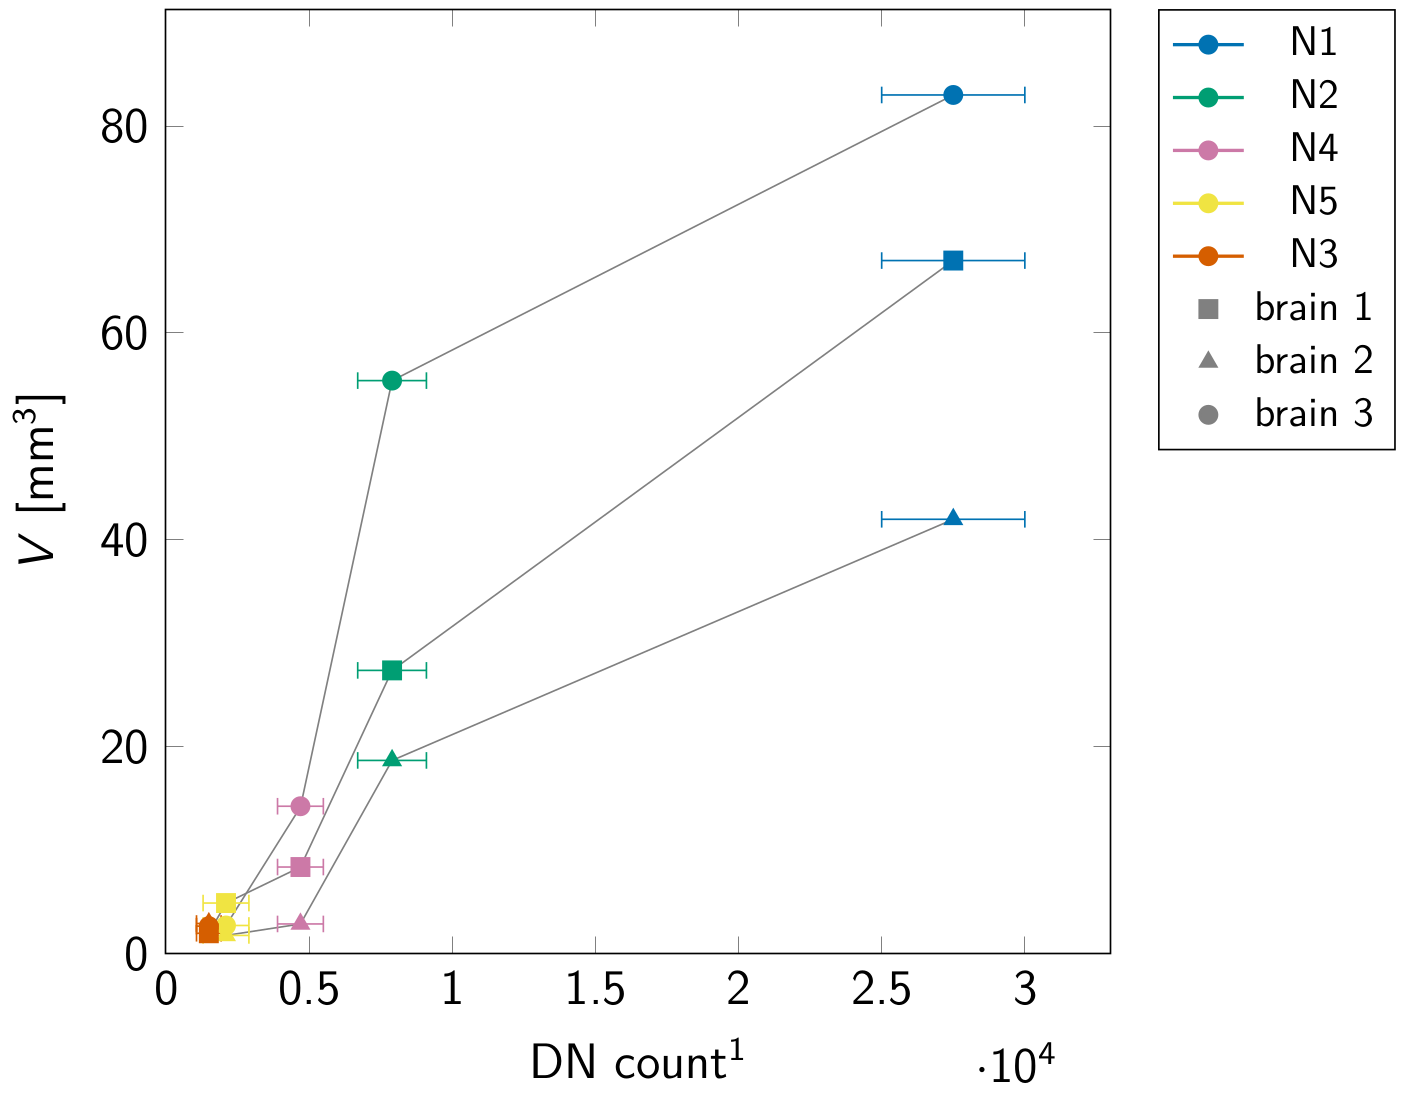
Fig 2: Volumes of the nigrosomes in our atlas follow the dopaminergic neuron (DN) count by Damier et al.1 The y-axis shows the nigrosome volume in MRI space for each brain (one marker shape and gray line per brain). The error bars show the standard error of the mean DN count. In all brains, N1 was the largest nigrosome, followed by N2 and N4. The smallest nigrosomes were N3 and N5, with not significantly different DN counts. The order of nigrosome volumes matched the order of the respective DN counts, corroborating the high correspondence between Damier et al.’s nigrosome delineation and ours.
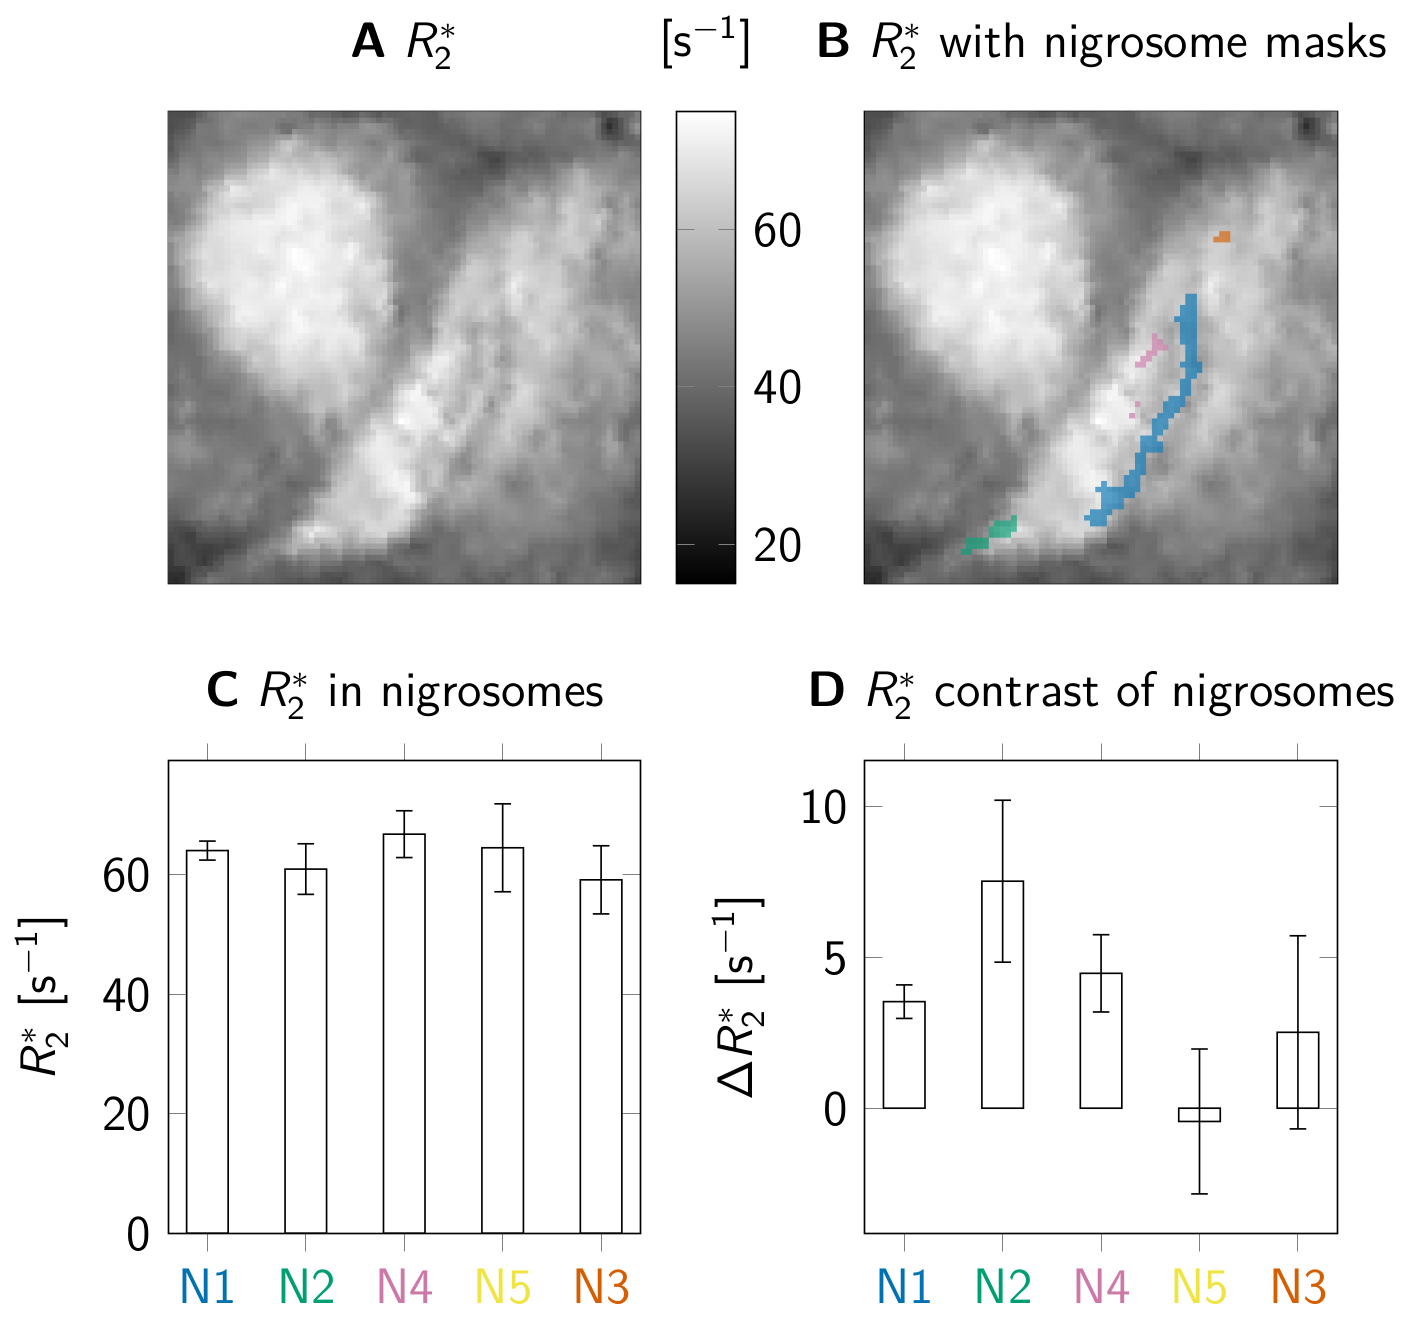
Fig. 3: Nigrosome R2* rates in 3 post mortem brains. A: Substantia nigra (SN) showed increased R2* values. In SN, we observed a stripe of increased R2*. B: Nigrosome segmentations on A. The stripe in A corresponded to nigrosome 1 (N1). C: Nigrosome R2* ranged from 55s⁻¹ to 75s⁻¹. Error bars show standard deviations over the three evaluated brains. D: Compared to the surrounding, we found significantly increased R2* for all brains in N1 (at least p<10⁻⁸ in Student t-test), N2 (p<10⁻⁹), and N4 (p<10⁻³). For the small N3 and N5, inconsistent differences may indicate inaccurate registration.