1388
Nigrostriatal iron accumulation in Parkinson's disease progression1HM CINAC, Hospital Universitario HM Puerta del Sur, Móstoles, Spain, 2Universidad Complutense de Madrid, Madrid, Spain, 3Center for Networked Biomedical Research on Neurodegenerative Diseases (CIBERNED), Instituto de Salud Carlos III, Madrid, Spain, 4Universidad Autónoma de Madrid, Madrid, Spain, 5Universidad San Pablo-CEU, Madrid, Spain
Synopsis
Keywords: Parkinson's Disease, Relaxometry, Iron
Iron has an important role in Parkinson’s disease (PD) pathophysiology. However, it is still uncertain how iron accumulates within the nigrostriatal circuit along with PD progression. Here we assessed iron content from early to moderate PD stages using R2* relaxometry, and histologically using a macaque MPTP (1-metil-4-fenil6-tetrahidropiridina) model. Our analyses revealed that in both human PD and MPTP model, iron accumulates progressively within SNpc during early stages , reaching a plateau before moderate PD. Meanwhile, iron followed a V-shaped progression in the striatum. These results will contribute to improve our understanding of nigrostriatal vulnerability and the course of neurodegeneration in PD.Introduction
Iron disruption is a relevant aspect in Parkinson’s disease (PD) pathophysiology. Increased iron deposition has been confirmed in the substantia nigra (SN) with multiple techniques, including MRI1–4. In the SN iron is closely related to neuromelanin (NM)5,6, a dark pigment frequently linked to the selective degeneration of dopaminergic neurons in the SN pars compacta (SNpc)7,8. For this reason, iron measures have been proposed as a potential biomarker for neuronal vulnerability in the SNpc3,4,9. However, it is still uncertain when disruption mechanisms are triggered and how iron accumulation evolves during PD progression10. On the other hand, less emphasis has been given to iron accumulation in the striatum, where nigral dopaminergic neurons project, and results have been heterogeneous10–12. However, some evidence in rodents has related brain dopaminergic dysfunction to iron deficits13–15. Then, examining striatal iron during early stages may be essential to understand PD pathogenesis. Here we studied iron progression within the nigrostriatal circuit in PD patients using R2* relaxometry MRI. To validate our MRI findings, we also assessed iron histologically in the macaque MPTP (1-metil-4-fenil,6-tetrahidropiridina) model.Methods
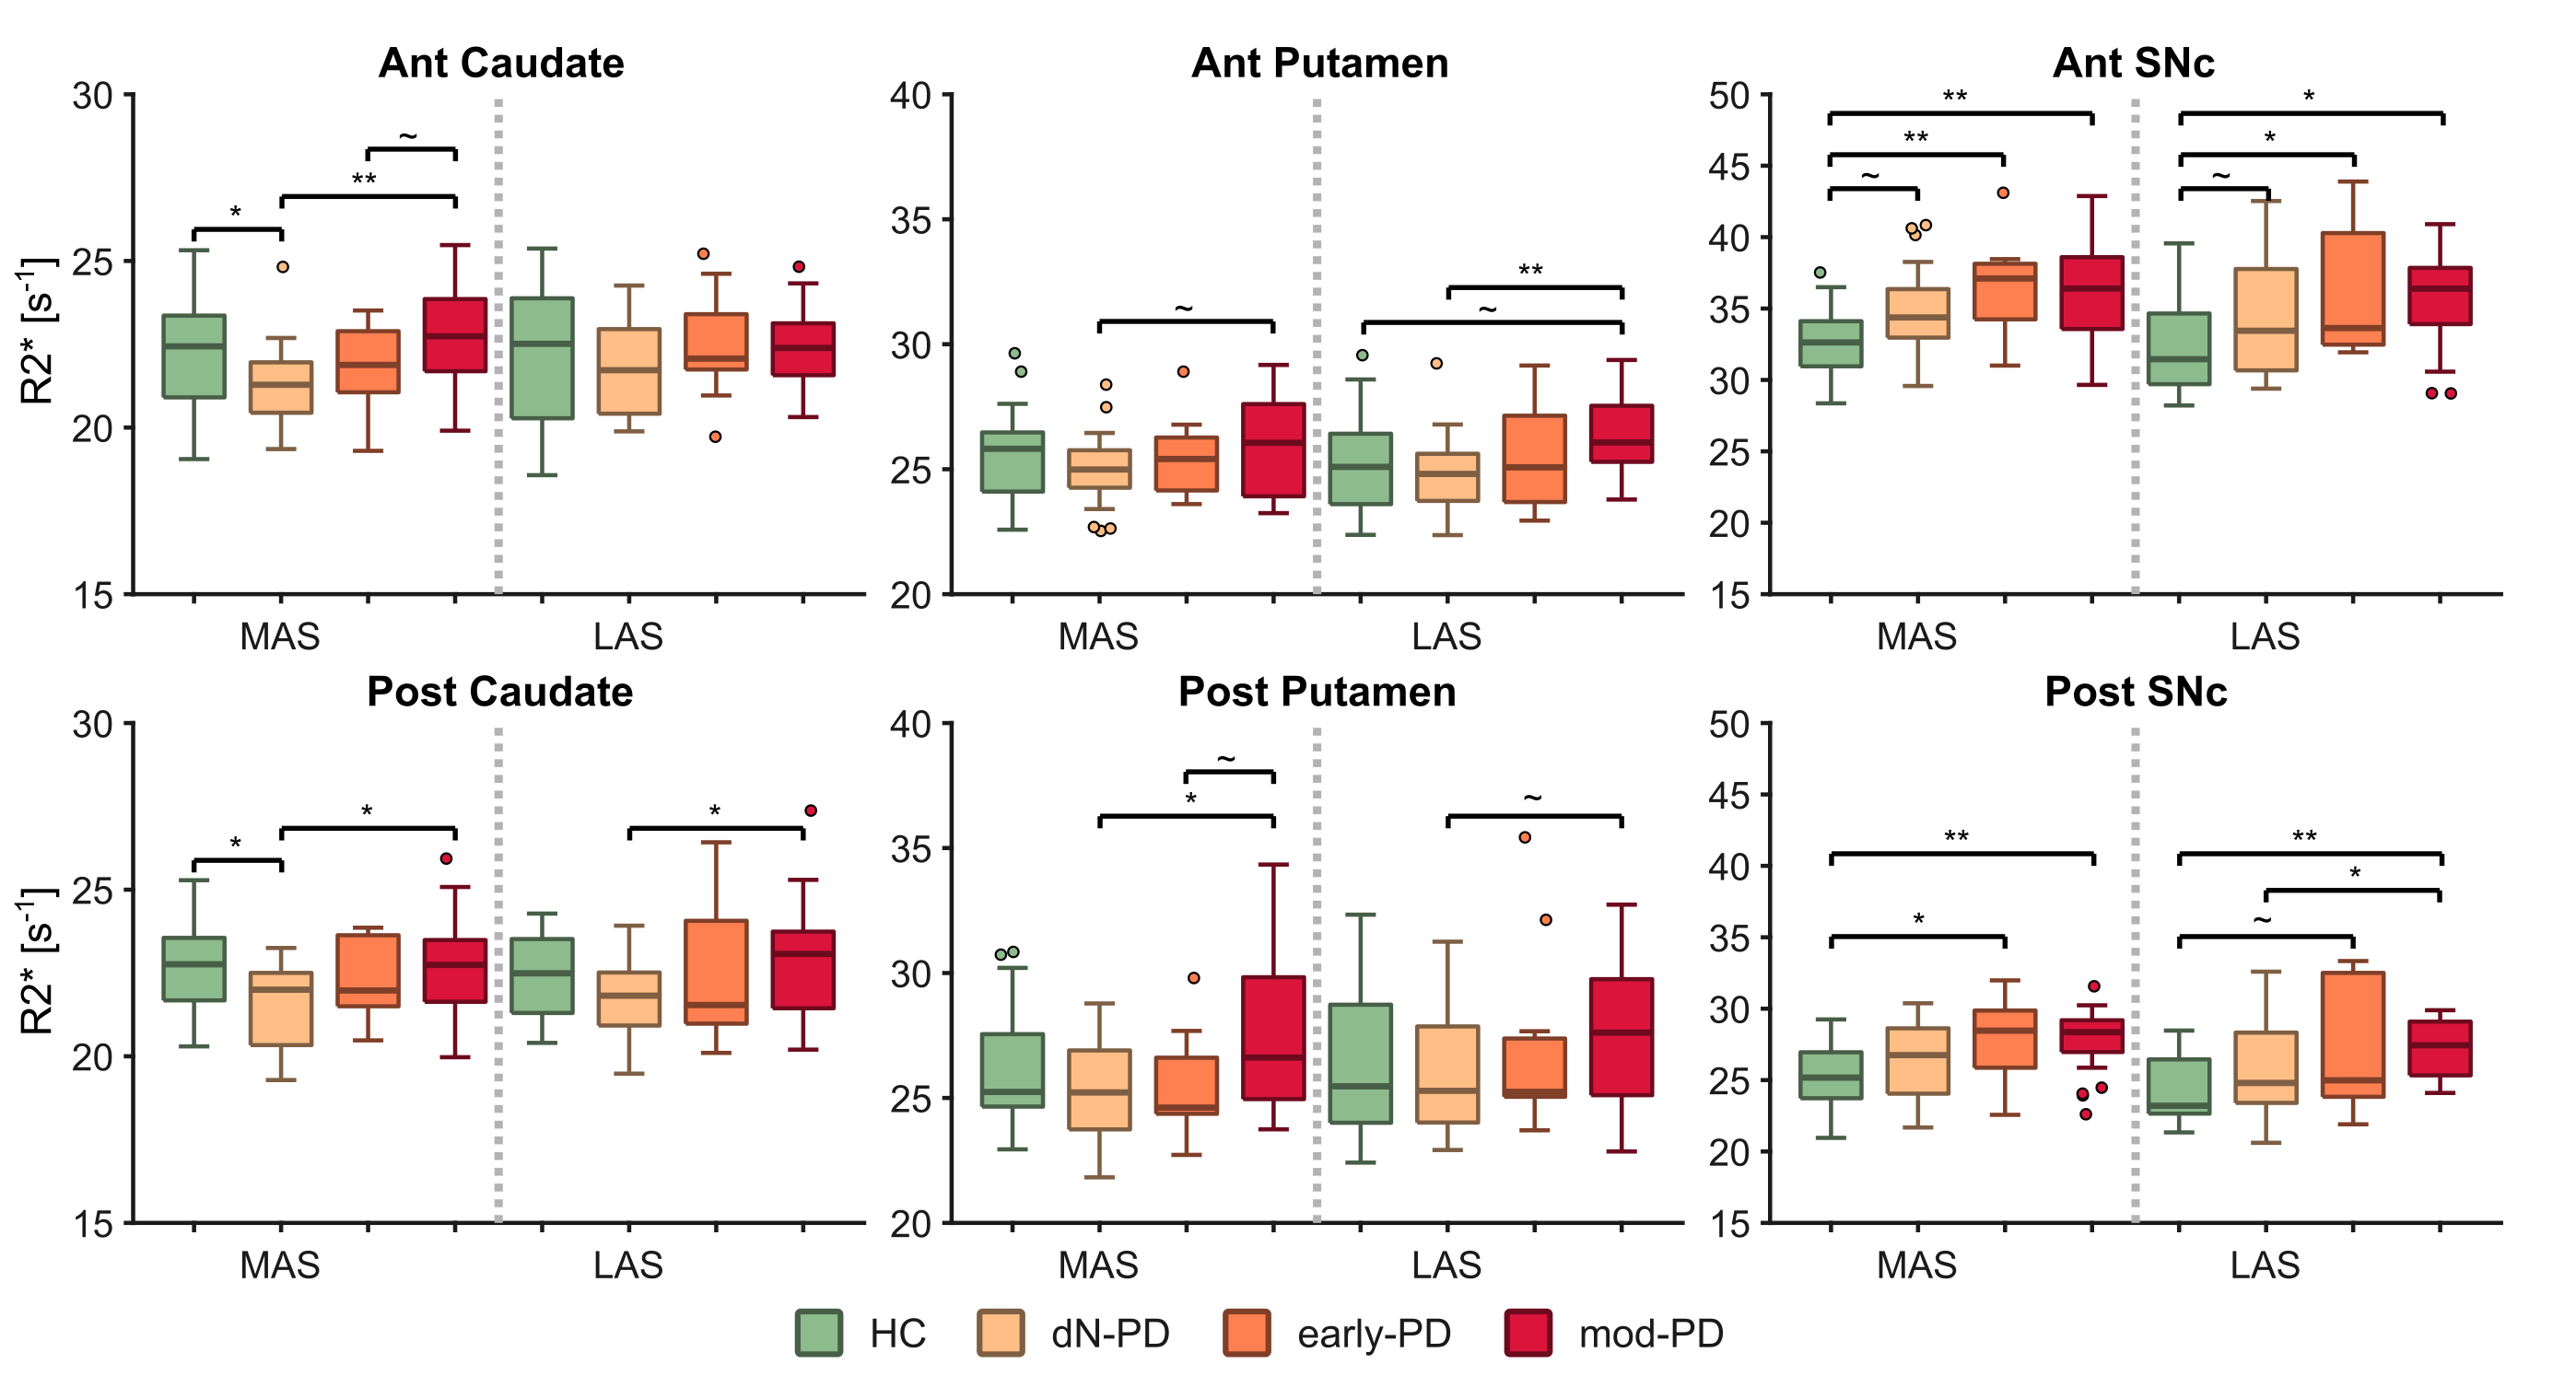
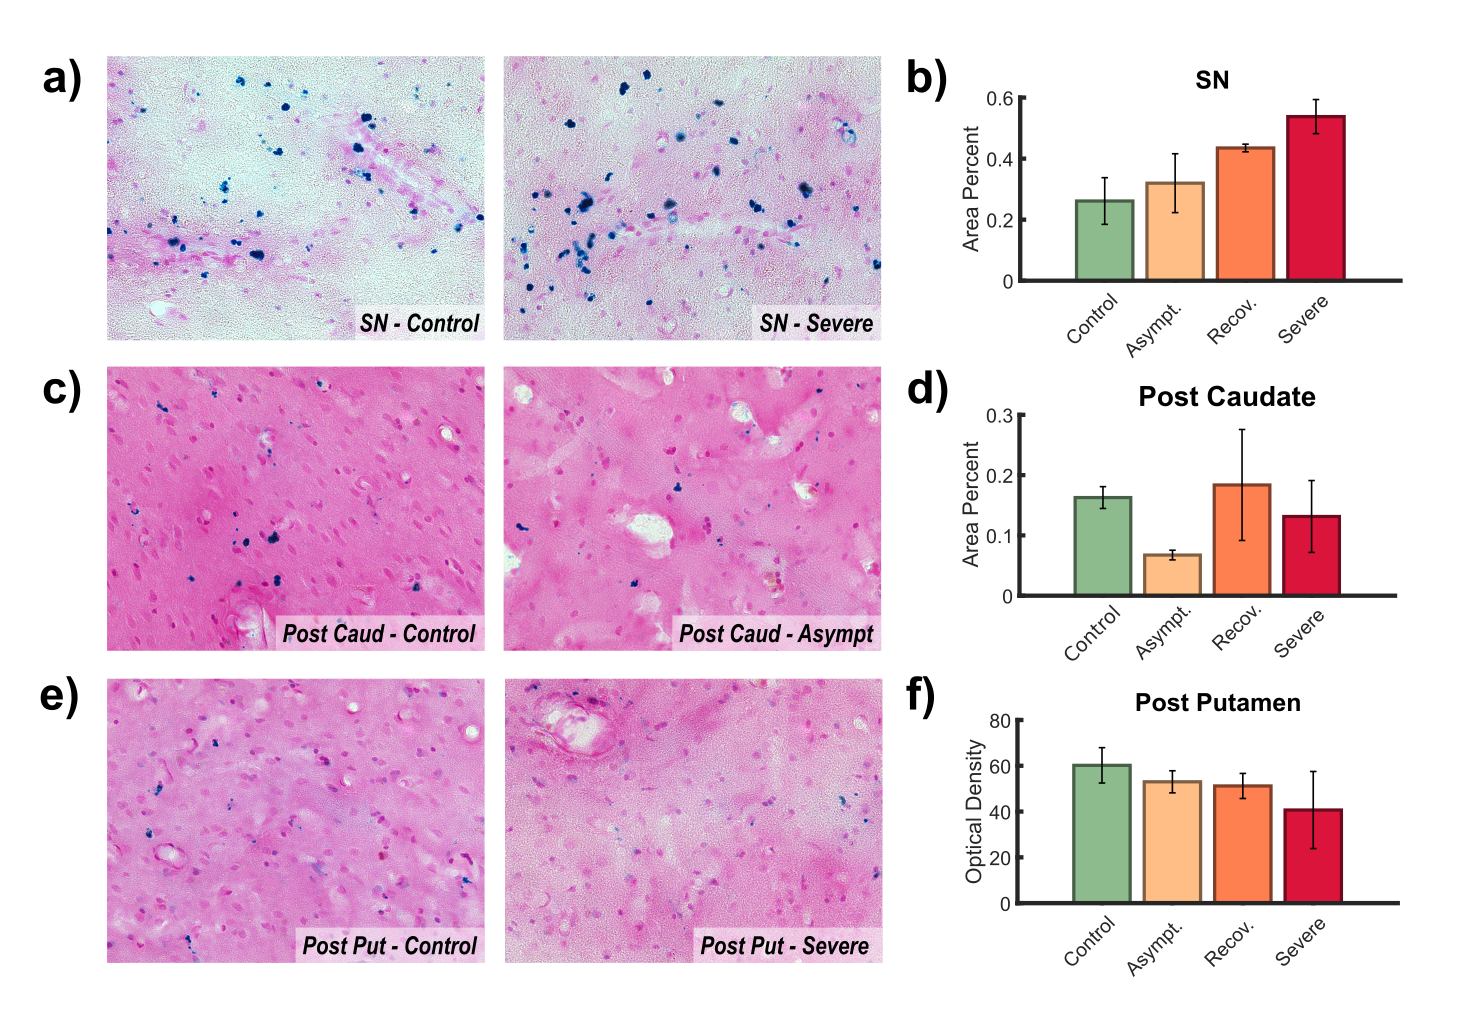
Seventy-one PD patients and twenty healthy controls (HC) were included in the MRI study. PD patients were divided into de novo (dN-PD), early (early-PD) and moderate (mod-PD) groups depending on disease stage. R2* maps were reconstructed from 3D multi-echo gradient echo data nonlinearly fitting the complex monoexponential equation with an autoregressive algorithm16. Iron content was assessed within caudate, putamen, and SNpc. Striatal regions of interest (ROIs) were partitioned into pre-/post-commissural divisions to improve pathological characterization. SNpc was divided into anteromedial/posterolateral ROIs. Single hemibrain data were sorted according to the predominance of motor signs (PD) or hand dominance (HC), i.e., more/less affected sides (MAS/LAS) or dominant/non-dominant sides (DS/nDS). Non-parametric Mann-Whitney’s U tests were applied to study inter-group differences (MAS vs DS and LAS vs nDS).Eight macaques were included in the histologic study. Animals were classified into control, asymptomatic, recovered, and severe experimental subgroups according to the degree of motor impairment after MPTP administration (2 animals per group). After tissue processing, brain slices were stained with Prussian blue to mark iron agglomerations. Striatal ROIs were defined analogously to the human study. SN was defined as a whole ROI. Multiple images were obtained using bright field microscopy over the selected ROIs. Area percent covered by Prussian stain and optical density were estimated within ROIs for each slice. These metrics were averaged by monkey to achieve a single mean value per ROI and animal.
Results
R2* analyses exhibited significant differences between HC and all PD groups (Fig. 1). In the SNpc R2* assessments revealed a progressive accumulation of iron that reached a plateau between early and moderate stages, although no significant differences were found between PD groups. Meanwhile, iron concentration followed a V-shaped progression in the caudate, first being reduced and then progressively increased after dN-PD stage. In the putamen iron followed a similar pattern with an accumulation developing after early PD stage.Histologic analyses shed some compatibilities with MRI findings. In the SN the area percent covered by Prussian stain revealed a progressive accumulation of iron with the progression of parkinsonian symptoms (Fig. 2.a-b). This metric also revealed a V-shape progression in the striatum but broken by the severe group (Fig. 2.c-d). Optical density revealed a progressive loss of iron within posterior putamen (Fig. 2.e-f).
Discussion
Congruent with previous literature, our R2* MRI study revealed greater iron concentrations within the SNpc in PD subjects3,4,17. This overload grows progressively during early-to-moderate PD stages17,18, reaching a plateau in moderate/late stages10,17. Comparable results were observed in the histologic study, which suggests that iron accumulation in the SN may be consequence of neuronal death. Unfortunately, this statement is hard to confirm since both processes seem to reinforce each other. NM and microglia presence might be related to this. Both elements function as chelating agents, buffering the iron overload8,19,20. During early PD stages NM absorbs iron free-radicals, but this neuroprotective capacity seems to be overwhelmed at some point, inducing microglia activation. This triggers neuroinflammation cycles, leading to neuronal death8,19,20. These pathological mechanisms may be slowed down once neuronal death is severe, explaining the absence of a continued accumulation in later PD stages.Few works have addressed striatal iron in PD and reports are heterogeneous10–12. Here we found a V-shape progression pattern that was partially confirmed by histologic results. Studies in rodents have described links between iron deficiencies and a dopaminergic hypofunction13,14. Indeed, our histologic findings within posterior putamen directly relate parkinsonian symptoms to iron loss. Consequently, striatal iron might be reduced during prodromal PD, inducing or co-occurring with the initial dopaminergic depletion. This effect might be compensated and reversed lately by iron accumulation mechanisms consequence of normal aging, PD progression9,21 or the effects of antiparkinsonian drugs10.
Conclusion
Iron disruption within the nigrostriatal circuit is intrinsically related to PD pathophysiology. While iron progressively accumulates from the beginning in the SNpc, in the striatum followed a V-shaped progression that might be related to dopaminergic dysfunction. These results contribute to improve our understanding of nigrostriatal vulnerability and degeneration along PD progression. Further analysis is required to reveal the relevance of striatal iron time-course with dopaminergic denervation in PD.Acknowledgements
This study was supported by the Fundación de investigación HM Hospitales (Madrid).References
1. Morris CM, Edwardson JA. Iron histochemistry of the substantia nigra in Parkinson’s disease. Neurodegeneration. 1994;3(4).
2. Berg D, Hochstrasser H, Schweitzer KJ, Riess O. Disturbance of iron metabolism in Parkinson’s disease - Ultrasonography as a biomarker. Neurotox Res. 2006;9(1). doi:10.1007/BF03033302
3. Murakami Y, Kakeda S, Watanabe K, et al. Usefulness of quantitative susceptibility mapping for the diagnosis of Parkinson disease. American Journal of Neuroradiology. 2015;36(6). doi:10.3174/ajnr.A4260
4. Langkammer C, Pirpamer L, Seiler S, et al. Quantitative susceptibility mapping in Parkinson’s disease. PLoS One. 2016;11(9). doi:10.1371/journal.pone.0162460
5. Good PF, Olanow CW, Perl DP. Neuromelanin-containing neurons of the substantia nigra accumulate iron and aluminum in Parkinson’s disease: a LAMMA study. Brain Res. 1992;593(2). doi:10.1016/0006-8993(92)91334-B
6. Jellinger K, Kienzl E, Rumpelmair G, et al. Iron‐Melanin Complex in Substantia Nigra of Parkinsonian Brains: An X‐Ray Microanalysis. J Neurochem. 1992;59(3). doi:10.1111/j.1471-4159.1992.tb08362.x
7. Faucheux BA, Martin ME, Beaumont C, Hauw JJ, Agid Y, Hirsch EC. Neuromelanin associated redox-active iron is increased in the substantia nigra of patients with Parkinson’s disease. J Neurochem. 2003;86(5). doi:10.1046/j.1471-4159.2003.01923.x
8. Zucca FA, Segura-Aguilar J, Ferrari E, et al. Interactions of iron, dopamine and neuromelanin pathways in brain aging and Parkinson’s disease. Prog Neurobiol. 2017;155:96-119. doi:10.1016/j.pneurobio.2015.09.012
9. Zecca L, Stroppolo A, Gatti A, et al. The role of iron and molecules in the neuronal vulnerability of locus coeruleus and substantia nigra during aging. Proc Natl Acad Sci U S A. 2004;101(26). doi:10.1073/pnas.0403495101
10. Du G, Wang E, Sica C, et al. Dynamics of Nigral Iron Accumulation in Parkinson’s Disease: From Diagnosis to Late Stage. Movement Disorders. Published online May 25, 2022. doi:10.1002/mds.29062
11. Ulla M, Bonny JM, Ouchchane L, Rieu I, Claise B, Durif F. Is R2* a New MRI Biomarker for the Progression of Parkinson’s Disease? A Longitudinal Follow-Up. PLoS One. 2013;8(3). doi:10.1371/journal.pone.0057904
12. Ravanfar P, Loi SM, Syeda WT, et al. Systematic Review: Quantitative Susceptibility Mapping (QSM) of Brain Iron Profile in Neurodegenerative Diseases. Front Neurosci. 2021;15. doi:10.3389/fnins.2021.618435
13. Erikson KM, Jones BC, Beard JL. Iron deficiency alters dopamine transporter functioning in rat striatum. Journal of Nutrition. 2000;130(11). doi:10.1093/jn/130.11.2831
14. Bianco LE, Wiesinger J, Earley CJ, Jones BC, Beard JL. Iron deficiency alters dopamine uptake and response to L-DOPA injection in Sprague-Dawley rats. J Neurochem. 2008;106(1). doi:10.1111/j.1471-4159.2008.05358.x
15. Unger EL, Bianco LE, Jones BC, Allen RP, Earley CJ. Low brain iron effects and reversibility on striatal dopamine dynamics. Exp Neurol. 2014;261. doi:10.1016/j.expneurol.2014.06.023
16. Pei M, Nguyen TD, Thimmappa ND, et al. Algorithm for fast monoexponential fitting based on Auto-Regression on Linear Operations (ARLO) of data. Magn Reson Med. 2015;73(2). doi:10.1002/mrm.25137
17. Li KR, Avecillas-Chasin J, Nguyen TD, et al. Quantitative evaluation of brain iron accumulation in different stages of Parkinson’s disease. Journal of Neuroimaging. 2022;32(2):363-371. doi:10.1111/jon.12957
18. Bergsland N, Zivadinov R, Schweser F, Hagemeier J, Lichter D, Guttuso T. Ventral posterior substantia nigra iron increases over 3 years in Parkinson’s disease. Movement Disorders. 2019;34(7):1006-1013. doi:10.1002/mds.27730
19. Ward RJ, Zucca FA, Duyn JH, Crichton RR, Zecca L. The role of iron in brain ageing and neurodegenerative disorders. Lancet Neurol. 2014;13(10). doi:10.1016/S1474-4422(14)70117-6
20. Sian-Hülsmann J, Mandel S, Youdim MBH, Riederer P. The relevance of iron in the pathogenesis of Parkinson’s disease. J Neurochem. 2011;118(6). doi:10.1111/j.1471-4159.2010.07132.x
21. Zecca L, Casella L, Albertini A, et al. Neuromelanin can protect against iron-mediated oxidative damage in system modeling iron overload of brain aging and Parkinson’s disease. J Neurochem. 2008;106(4). doi:10.1111/j.1471-4159.2008.05541.x
Figures