1386
Signal recovery around DBS leads using 2D MSI
Gehua Tong1, John Thomas Vaughan, Jr.1,2, and Sairam Geethanath2,3
1Biomedical Engineering, Columbia University, New York, NY, United States, 2Columbia Magnetic Resonance Research Center, Columbia University, New York, NY, United States, 3Accessible MR Laboratory, BioMedical Engineering and Imaging Institute, Dept. of Diagnostic, Molecular and Interventional Radiology, Icahn School of Medicine at Mt. Sinai, New York, NY, United States
1Biomedical Engineering, Columbia University, New York, NY, United States, 2Columbia Magnetic Resonance Research Center, Columbia University, New York, NY, United States, 3Accessible MR Laboratory, BioMedical Engineering and Imaging Institute, Dept. of Diagnostic, Molecular and Interventional Radiology, Icahn School of Medicine at Mt. Sinai, New York, NY, United States
Synopsis
Keywords: Parkinson's Disease, Pulse Sequence Design
2D MSI was tested for recovering the closest layer of off-resonant signals near a DBS lead. The effects of slice thickness and RF profile were measured in an ASTM gel phantom with an in-plane DBS lead. Increasing the slice thickness from 1.5x to 2.5x the lead diameter reduced the apparent lead width by 8.35% and increasing the time-bandwidth product of the RF pulse by four times improved SSIM with a reference TSE image by 88.5%. A trade off between bin definition and echo times limited signal recovery at a given bin bandwidth (800 Hz / 9 bins).Introduction
Deep-Brain Stimulation (DBS) leads cause signal loss and distortion in brain MRIs which are needed for post-surgical monitoring of lead placement and tissue changes (1). The geometry of DBS leads poses a unique imaging problem. We explore it here using the 2D multi-spectral imaging (2D MSI) sequence which acquires multiple bins to cover off-resonant signal components and reduce distortion (2). Because 2D MSI uses the spin echo overlap effect to create a diamond-shaped bin, the bin bandwidth is fullest mid-slice and reduces to single frequencies towards the edges (Figure 1(A)).We assume a symmetric off-resonance distribution (Figure 1(B)) (3) and an in-plane lead. For thin slices, the off-resonance layers thin out toward the edge because of the diamond-shaped bins. This weighs the signal towards the center without distorting the image. For thick slices, additional bins distributed perpendicularly are included with an emphasis in bins closer to the lead, which may appear as an artifact inside the signal void. Analyzing these artifacts may help optimize signal localization and recovery. Furthermore, RF pulses lengthen with narrower bins and increase the minimal TE. This causes a tradeoff between T2*-related signal preservation and sharp bin definition. The tradeoff depends on the total bandwidth across the off-resonant region of interest. In this work, we examined the effects of slice thickness, RF time-bandwidth product, and echo time by imaging around a DBS lead immersed in ASTM gel with 2D MSI.
Methods
A TSE-based 2D MSI sequence was implemented with PyPulseq (4,5). Experiments were performed on a Siemens 3T Skyra scanner (20-channel head coil, Pulseq interpreter version 1.4.0) (6). For the phantom, a DBS lead (Medtronic 3389-40, 1.27 mm diameter) was immersed in ASTM gel in a plastic container (Figure 2(A)). The lead sat parallel to the slice like in Figure 1(C). Imaging parameters are summarized in Figure 2(B). The thickness experiments (images 1-3) utilized sigpy.rf 90 and 180 pulses (7) with thk = 3, 4, and 5 mm; the RF Time-Bandwidth Product (TBW) experiments (images 4-6) used PyPulseq sinc pulses with different RF durations (1x, 2x, and 4x of the original T90 = 2.5 ms and T180 = 2 ms) at the same bandwidth. A total of nine bins covering 800 Hz was chosen to cover most of the signal after scouting with higher bandwidth 2D MSI. Bins were combined by sum-of-squares.For each set of experiments, a reference vendor TSE image was acquired. SSIM values were calculated against TSE for the RF TBW set after manual image registration to measure blurring and shading caused by the overlapping bins. Apparent lead widths (ALW) were measured manually for the central bin and the combined image. We also generated maximum-signal bin maps by displaying the bin number with the highest signal at each voxel. Bin energy fractions were computed by finding the amount of squared signal from each bin normalized by net squared signal across all bins and all voxels.
Results and Discussion
The effects of slice thickness are shown in Figure 2. As expected, the diamond-shaped bins caused signal loss near the edge of the bins in this geometry that appear as gaps. The gaps were partially filled by slice averaging effects in thicker slices (5 mm) but are apparent in thinner slices (3 mm). The apparent lead widths for the central bin and for the combined image are plotted in Figure 5(C). Combined ALW was reduced from 5.27 to 4.83 mm and central bin ALW was reduced from 9.93 to 8.31 mm. These were high compared to the vendor value of 3.21 mm.On the other hand, RF pulse design affects the effective spatial resolution as lower TBW pulses cause more bin overlap and blurring (Figure 4). The energy fractions are plotted in Figure 5(A) and 5(B). SSIM values against the vendor TSE were 0.44, 0.63, and 0.82 for 1x, 2x, and 4x RF durations. Since the RF bandwidth is fixed by the bin bandwidth, sharper profiles require longer pulses which cause short-T2 signal loss during the pulse (8) and increase minimum Echo Time (TE) to exacerbate signal loss. This effect can be seen in Figure 5(C) as the RF TBW experiments (TE = 25 ms) achieved lower ALW values compared to the slice thickness experiments (TE = 50 ms). Therefore, the tradeoff between bin definition and signal loss can constrain signal recovery. Furthermore, how the tradeoffs change when the lead is perpendicular to the slice is of interest. If the off-resonance field varies less in the vertical direction, the alternative slice planning may be more useful in lead localization.
Conclusion
2D MSI recovery near a DBS lead was found to be dependent on RF TBW and slice thickness. Recovering signal may be challenging when the spatial distribution of off-resonance is highly non-uniform with only the closest layers of signal being at high off-resonant frequencies. Apparent lead width reduction could be partially caused by slice averaging effects. Finally, we provided the open-source 2D MSI sequence function implemented in PyPulseq in a public repository (9).Acknowledgements
This work was supported by the NIH 1U01 EB025153-01 grant and performed at the Zuckerman Mind Brain Behavior Institute and the Columbia MR Research Center.References
1. Erasmi R, Granert O, Zorenkov D, et al. White Matter Changes Along the Electrode Lead in Patients Treated With Deep Brain Stimulation. Front. Neurol. 2018;9. https://github.com/tonggehua/msi. Accessed November 8, 20222. Hargreaves BA, Taviani V, Litwiller DV, Yoon D. 2D multi-spectral imaging for fast MRI near metal. Magn. Reson. Med. 2018;79:968–973 doi: 10.1002/mrm.26724.
3. Weber H, Hargreaves BA, Daniel BL. Artifact-reduced imaging of biopsy needles with 2D multispectral imaging. Magn. Reson. Med. 2018;80:655–661 doi: 10.1002/mrm.27056.
4. Ravi K, Geethanath S, Vaughan J. PyPulseq: A Python Package for MRI Pulse Sequence Design. J. Open Source Softw. 2019;4:1725 doi: 10.21105/joss.01725.
5. Ravi KS, Potdar S, Poojar P, et al. Pulseq-Graphical Programming Interface: Open source visual environment for prototyping pulse sequences and integrated magnetic resonance imaging algorithm development. Magn. Reson. Imaging 2018;52:9–15 doi: 10.1016/j.mri.2018.03.008.
6. Layton KJ, Kroboth S, Jia F, et al. Pulseq: A rapid and hardware-independent pulse sequence prototyping framework. Magn. Reson. Med. 2017;77:1544–1552 doi: 10.1002/mrm.26235.
7. imr-framework/pypulseq at sairamgeethanath-sigpy. GitHub. https://github.com/imr-framework/pypulseq. Accessed November 9, 2022.
8. Tyler DJ, Robson MD, Henkelman RM, Young IR, Bydder GM. Magnetic resonance imaging with ultrashort TE (UTE) PULSE sequences: Technical considerations. J. Magn. Reson. Imaging 2007;25:279–289 doi: 10.1002/jmri.20851.
9. Tong G. Open-source 2D MSI implementation. 2022. https://github.com/tonggehua/msi. Accessed November 8, 2022
Figures
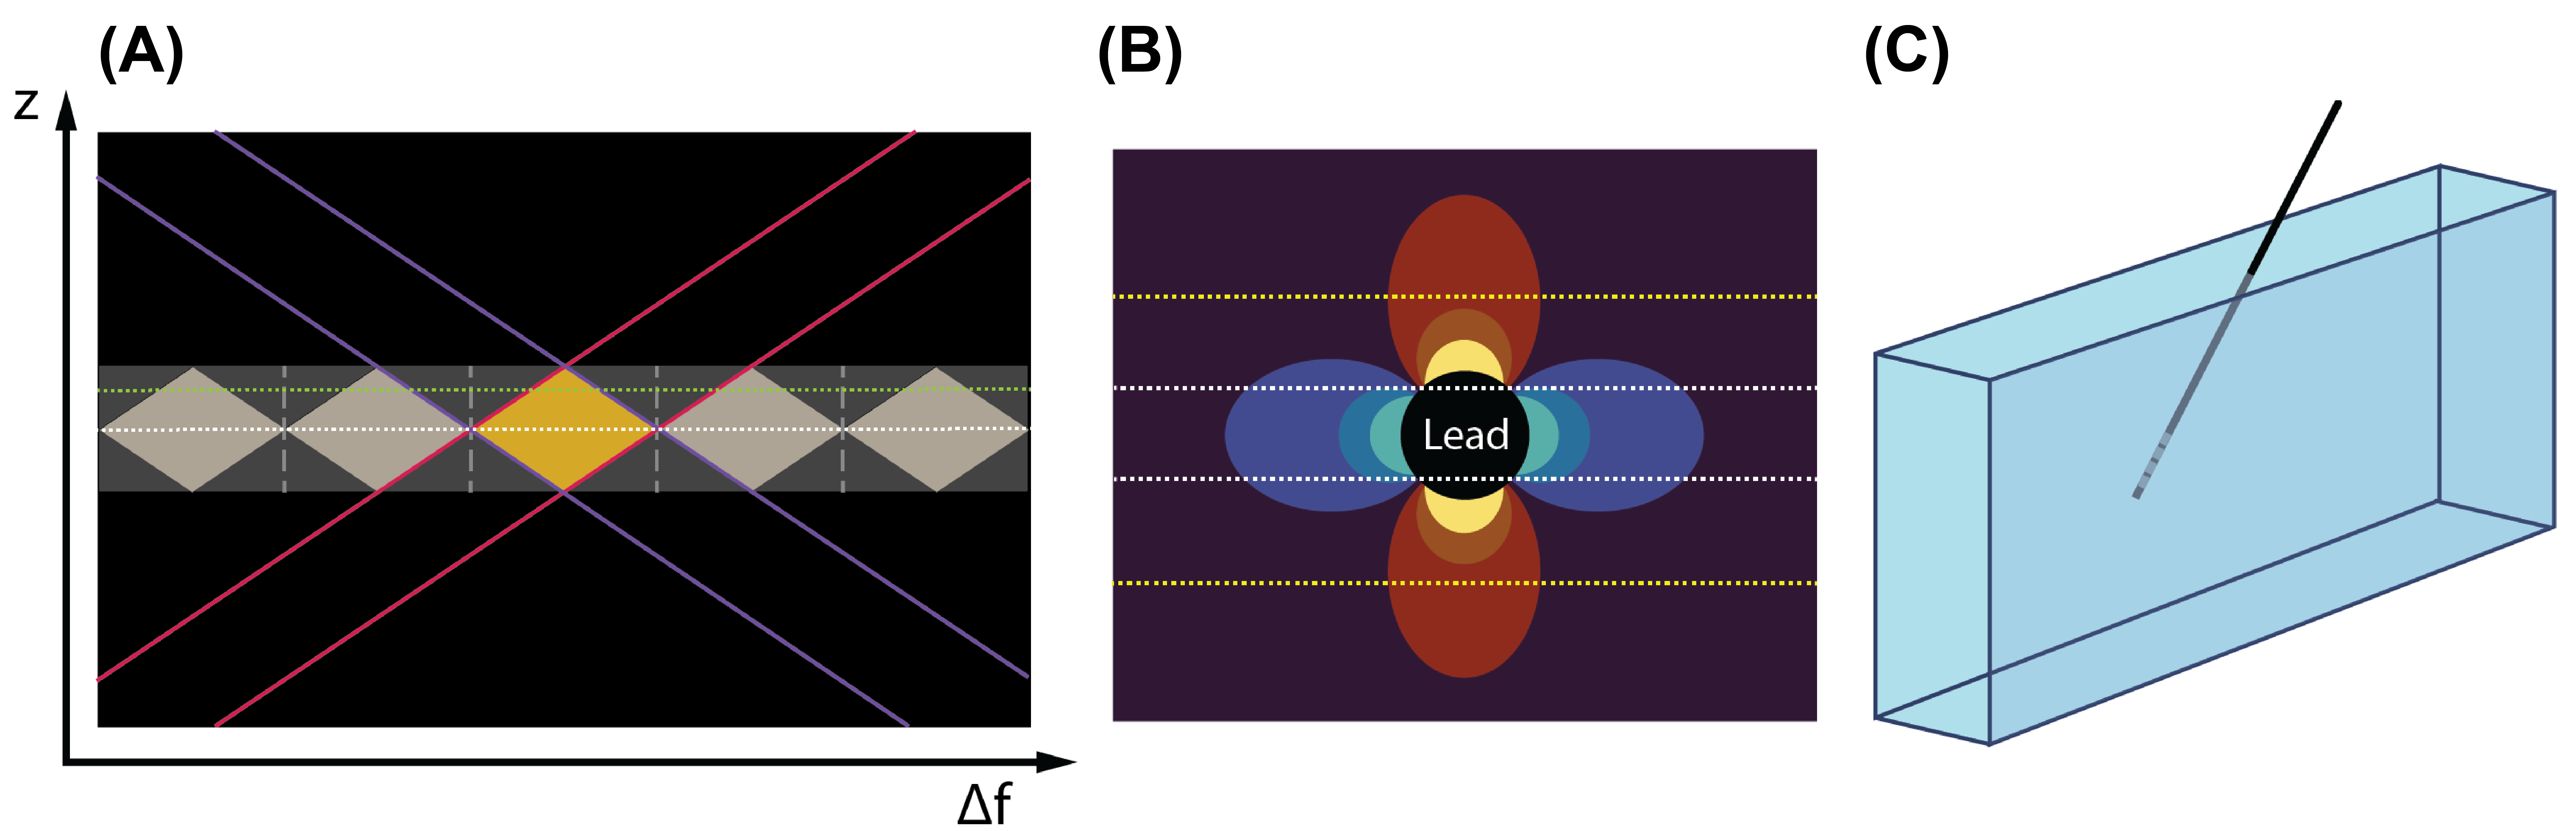
Figure 1: Imaging thin metallic structures with 2D MSI. (A) 2D MSI bin diagram (2). The diamond-shaped bins cause bin width to decrease linearly towards the edges of the slice. (B) Ideal off-resonance map adapted from (3). Thicker slices (yellow dashed lines) include perpendicularly distributed bins (yellow-red) that are distorted differently from the parallel bins (blue-purple) under the diamond bin shapes. (C) In-plane slice selection for DBS lead imaging.
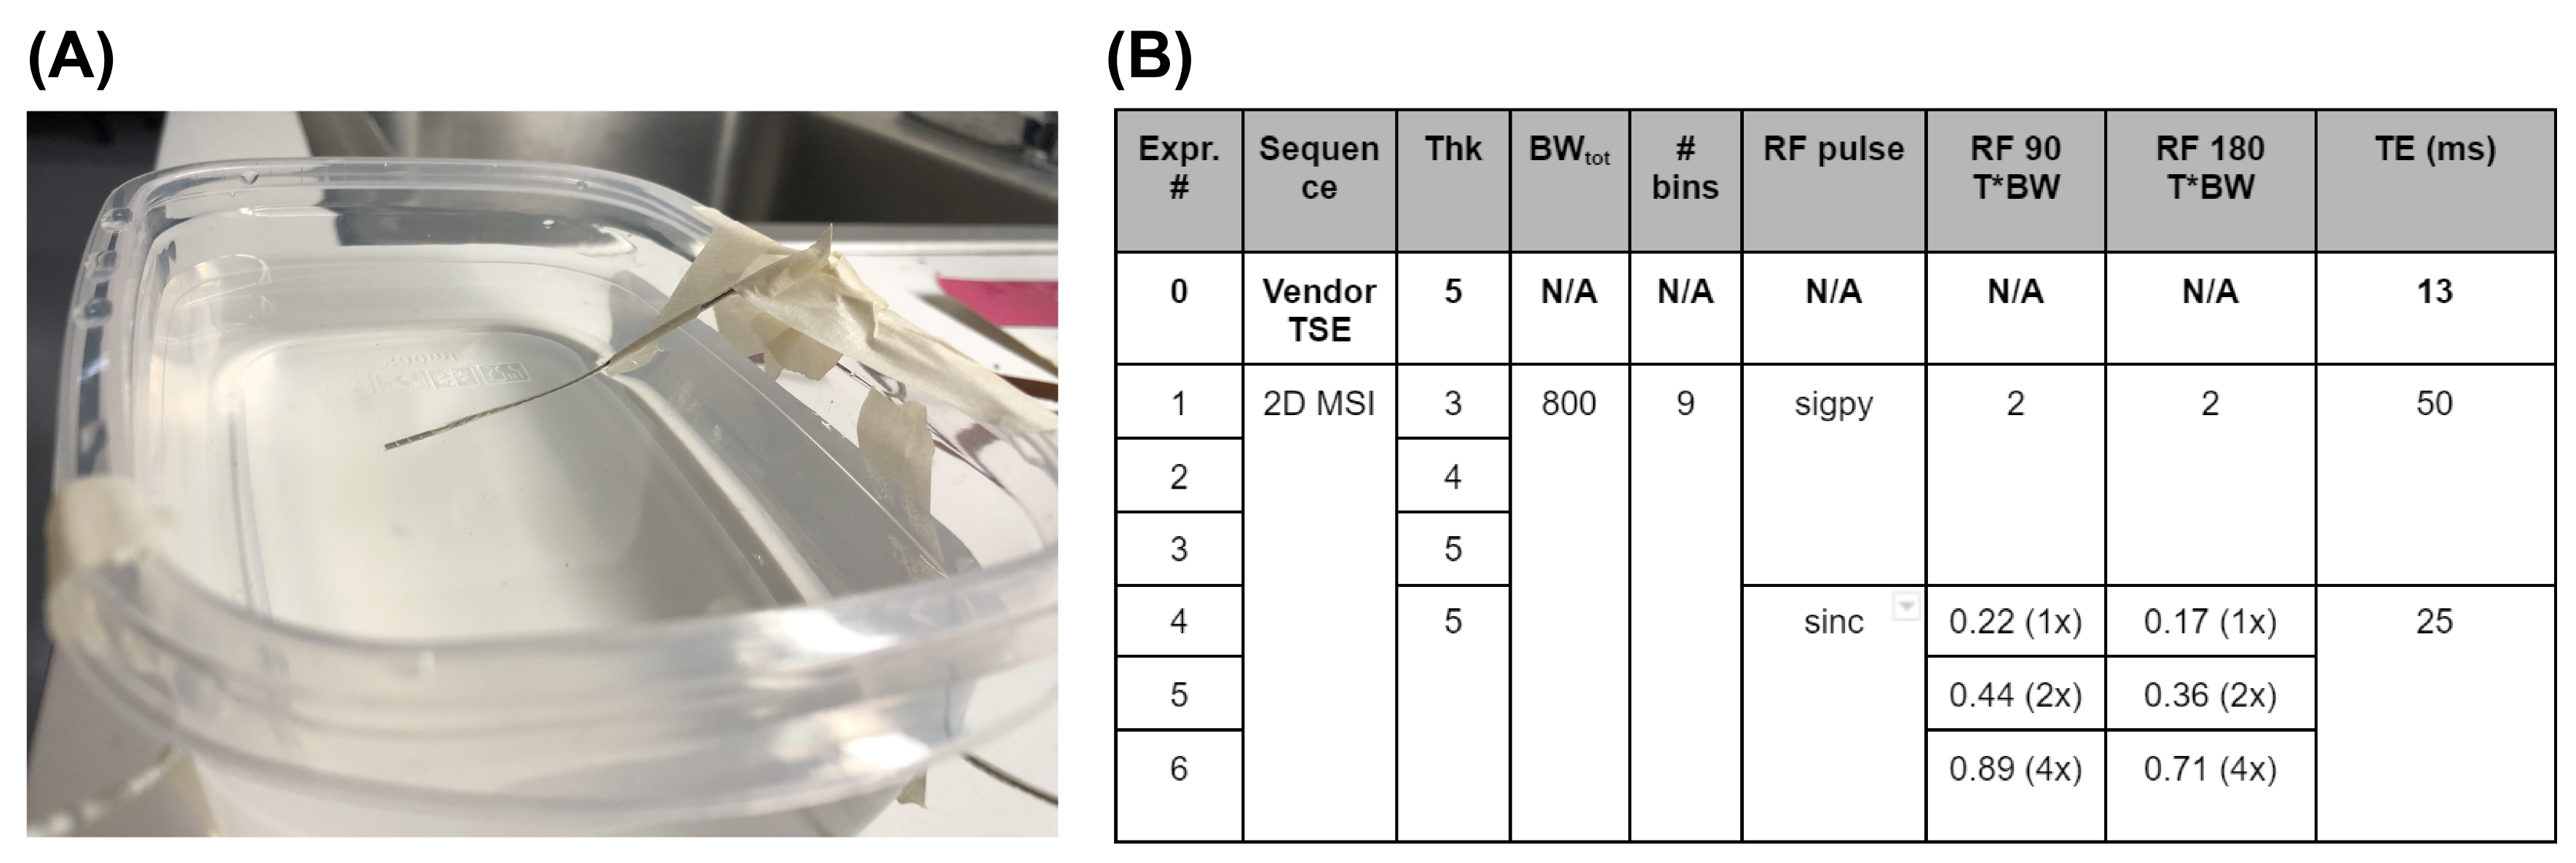
Figure 2: (A) Phantom setup; (B) Experiments list. A vendor TSE sequence with matched slice thickness and TR was used for reference. Shared parameters include: TR = 2000 ms, FOV = 150 mm, turbo factor = 16.
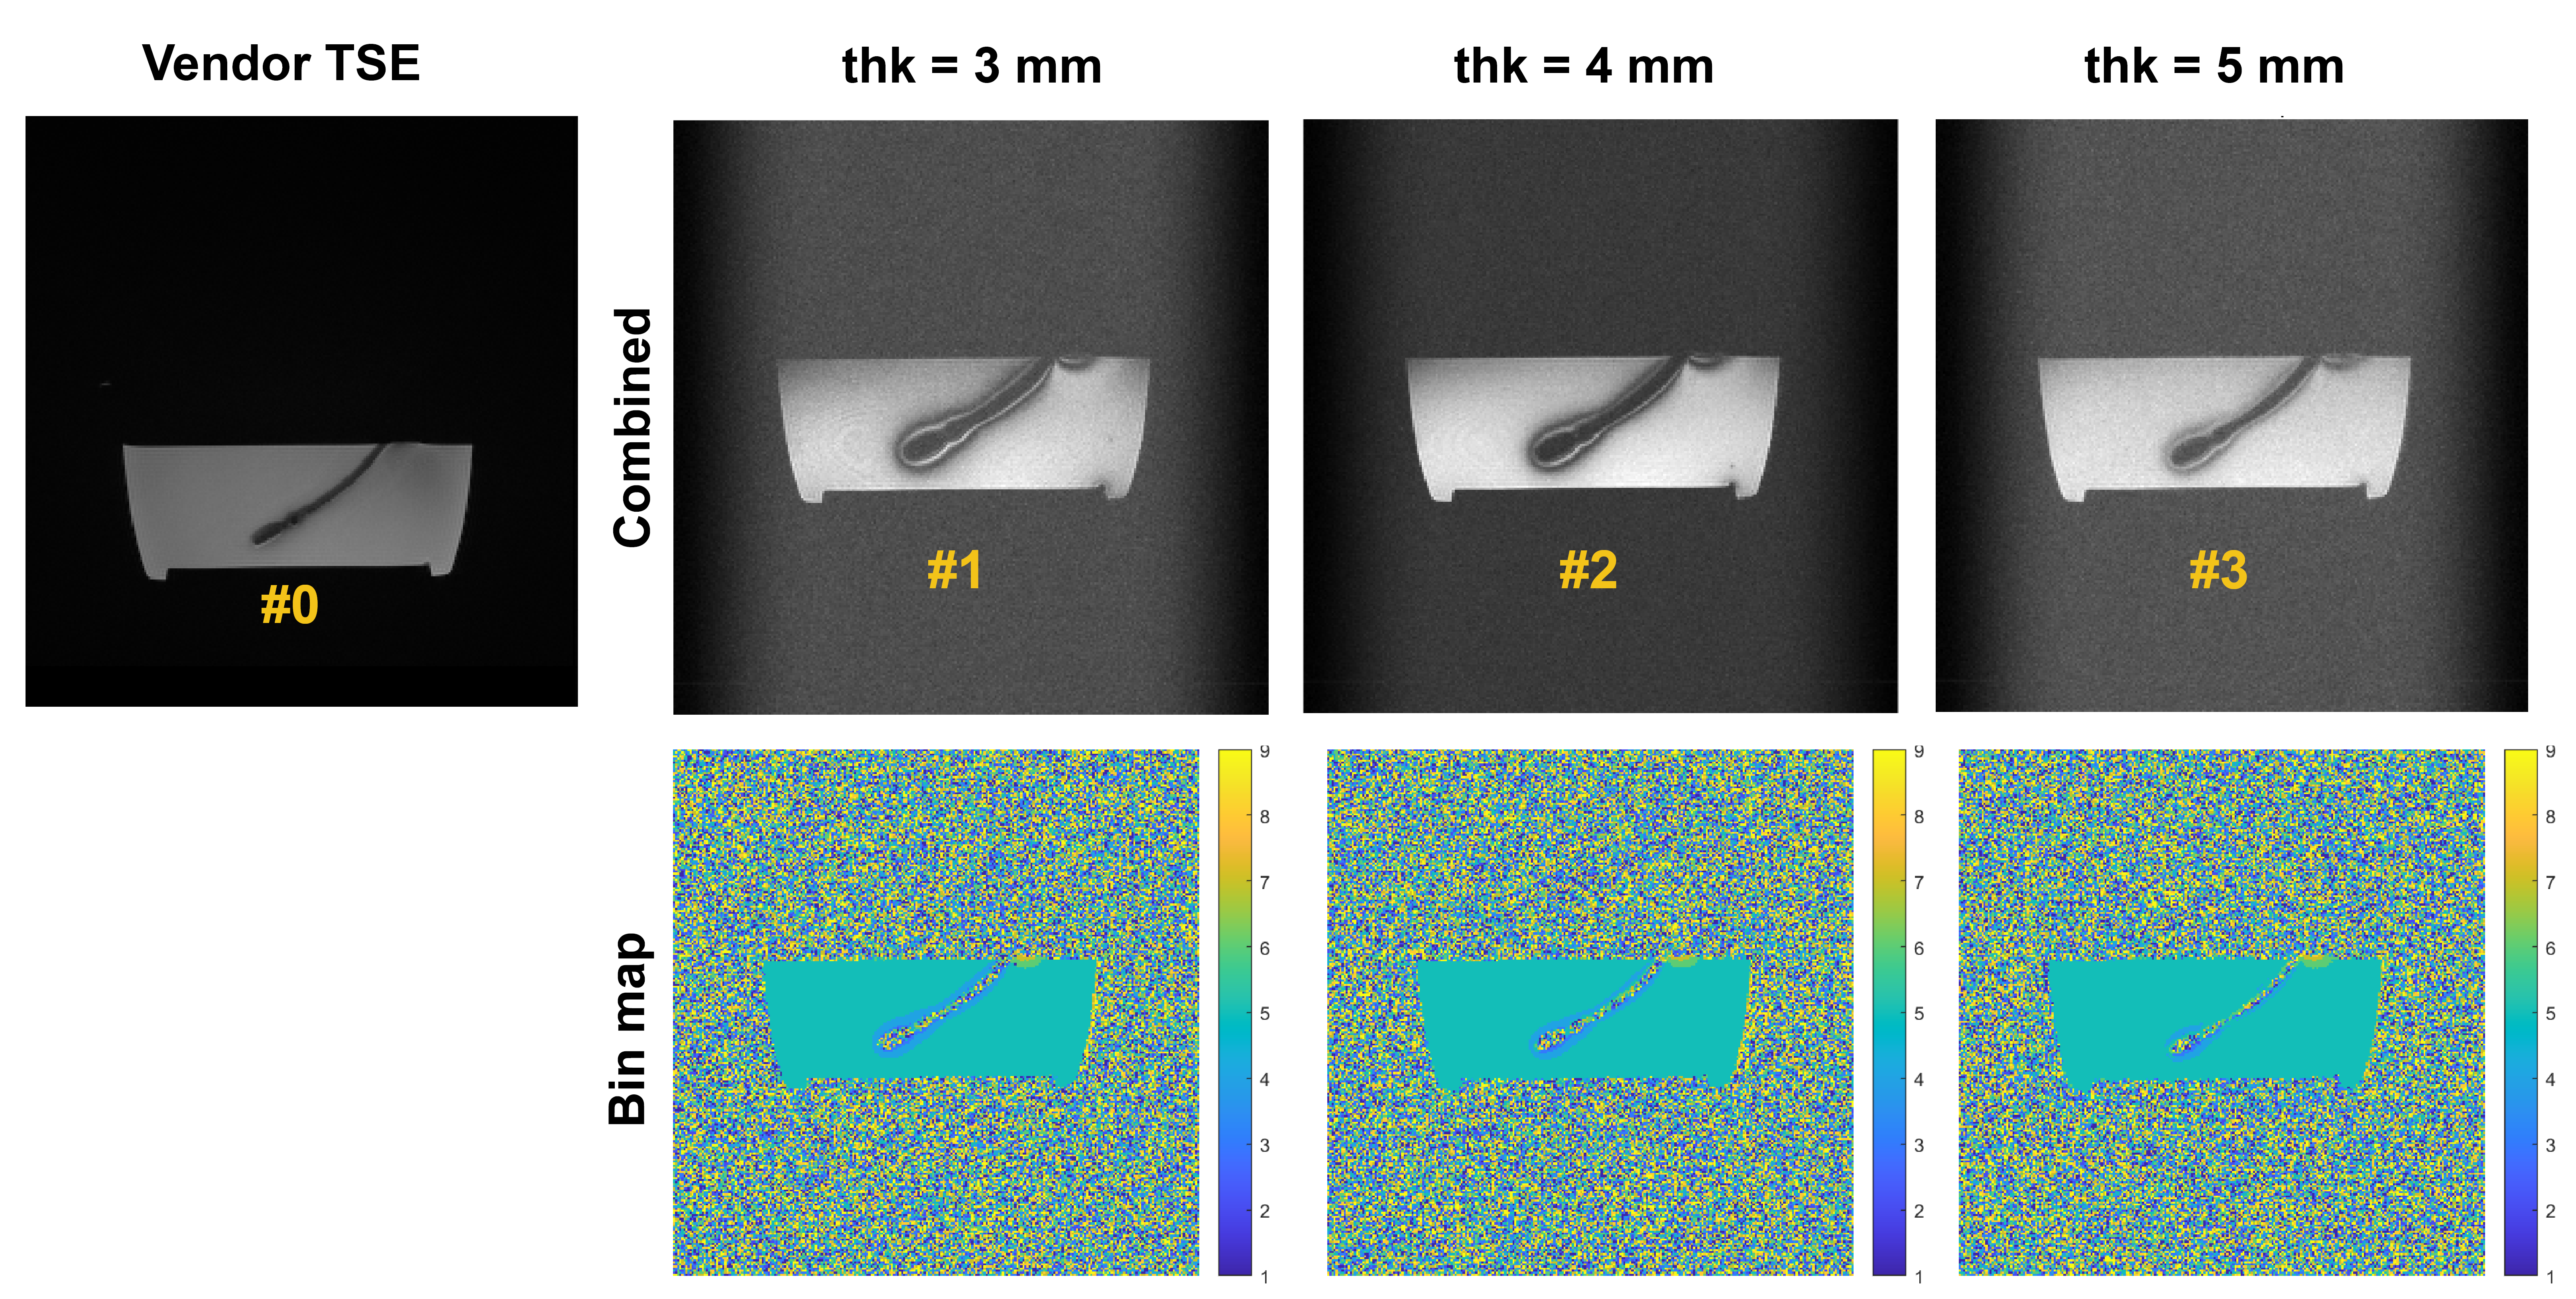
Figure 3: The effects of slice thickness on 2D MSI images (experiments 1,2,3) and a reference vendor TSE image (thk = 5 mm). Apparent bin width of both the central bin and the combined image was reduced with thicker slices and the bin contribution of the added signal in thicker slices mainly comes from the central bin (bin 5).
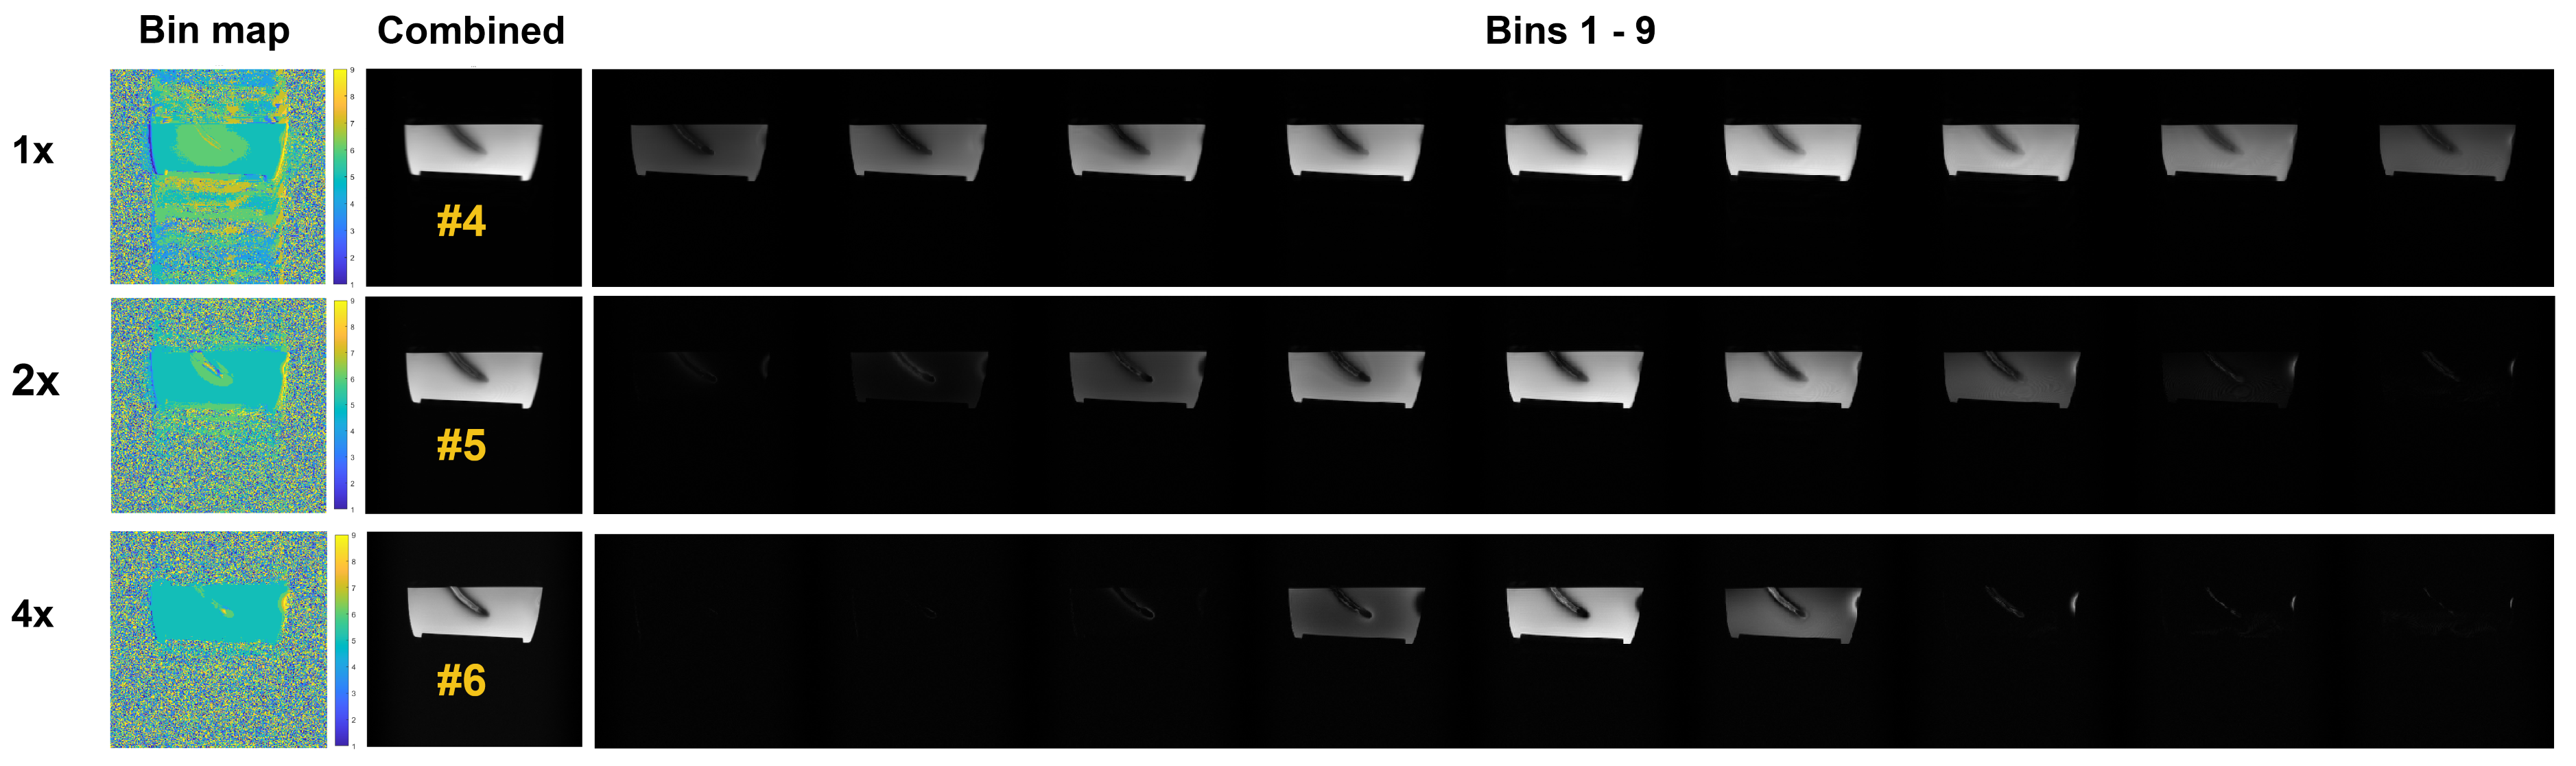
Figure 4: The effects of RF TBW product on 2D MSI images (experiments 4,5,6). Bins 1-9 show that higher TBW sharpens the bin profile and reduces overlap between bins. Better definition of lead boundary can be seen in the combined images. The maximum signal bin maps show bins that conform more to the highly localized off-resonance distribution.
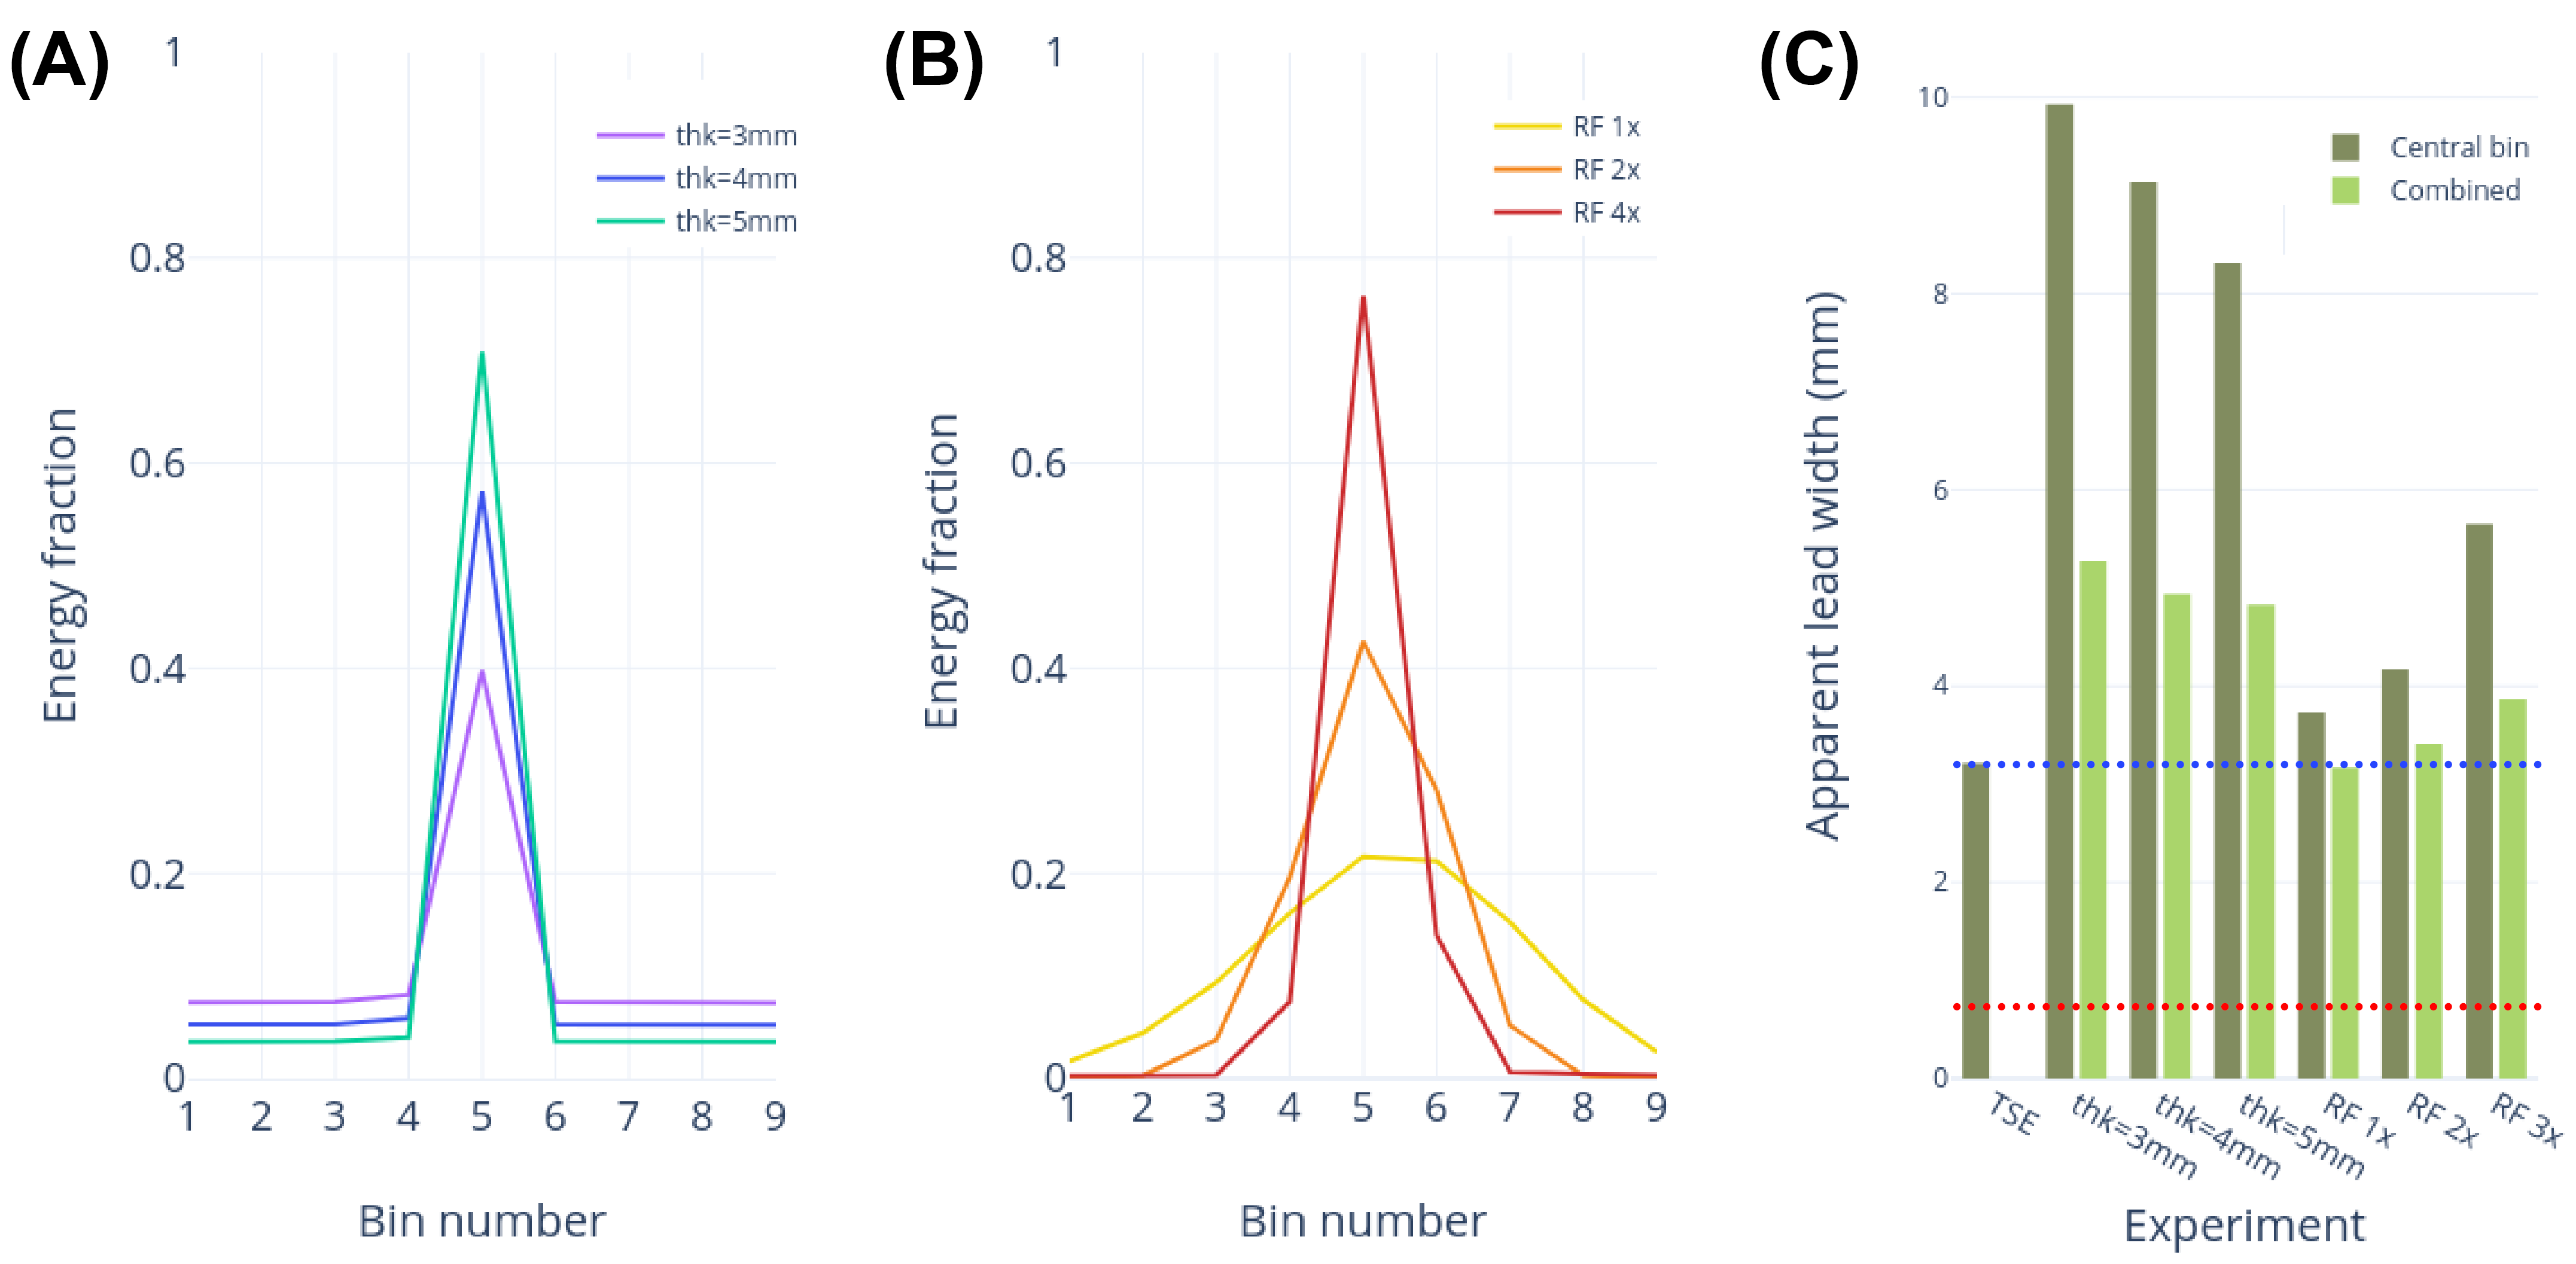
Figure 5: Image measurements. Bin-wise energy fractions for (A) the variable thickness experiments and (B) variable RF TBW experiments; (C) Apparent Lead Width of the central bin and the combined images. The red dotted line indicates real lead diameter (1.27 mm) and the blue dotted line indicates TSE-determined lead diameter.
DOI: https://doi.org/10.58530/2023/1386