1366
The respective contribution of cell swelling and changes in hydrated water molecules to T2 changes due to changes in membrane potential1Department of Biomedical Engineering, Sungkyunkwan University, Suwon, Korea, Republic of, 2Laboratory for Imaging Science and Technology, Department of Electrical and Computer Engineering, Seoul National University, Seoul, Korea, Republic of, 3Department of Intelligent Precision Healthcare Convergence, Sungkyunkwan University, Suwon, Korea, Republic of
Synopsis
Keywords: Contrast Mechanisms, Challenges, cell scan, qMR, ADC, T2, PSR
Our group recently reported a method for direct imaging of neuronal activity (DIANA), suggesting that its contrast mechanism is T2 changes due to changes in membrane potential during neuronal activation, which accompanies cell swelling and changes in hydrating water modlecules of the cell membrane. In this study, by measuring apparent-diffusion-coefficient (ADC) and pool-size-ratio (PSR) versus T2, respectively, we verified the respective contribution of cell swelling and changes in hydrating water modlecules to T2 changes when only osmotic pressure or membrane potential was altered in T-lymphocyte cells in vitro.Purpose
Our group recently presented a method for direct imaging of neuronal activity (DIANA) with millisecond temporal resolution and also suggested that DIANA signals could be related to T2 changes due to changes in membrane potential during neuronal activation.1 More specifically, changes in the hydrated water of cell membranes2-5 as well as cell swelling2, which are accompanied by changes in the membrane potential, could be the underlying mechanisms of DIANA. In this study, we verified the respective contribution of cell swelling and changes in hydrated water modlecules to T2 changes using T-lymphocyte cells in vitro. The contribution of cell welling to the T2 change was evaluated when only osmotic pressure was altered. In contrast, the contribution of changes in bound water modlecules in the hydration layer of the cell membrane to the T2 change was assessed when the membrane potential was altered. These contributions were evaluated by measuring an apparent-diffusion-coefficient (ADC) and a pool-size-ratio (PSR) versus T2, respectively.Methods
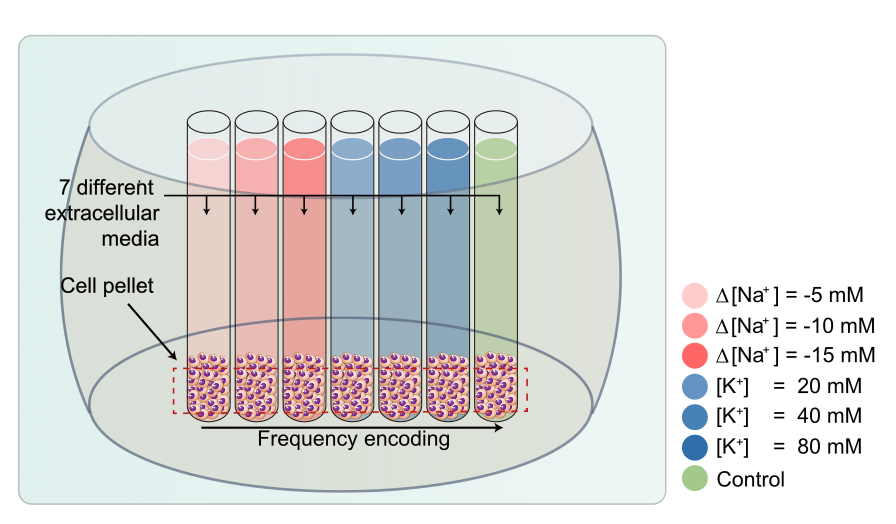
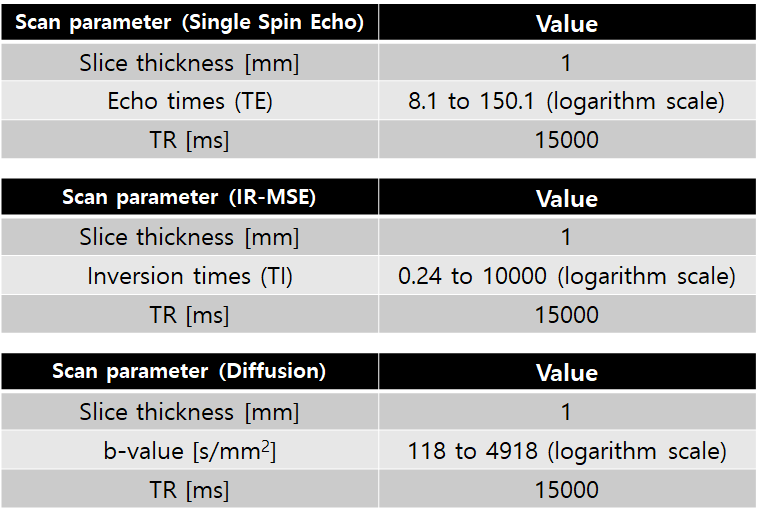
Cell culture and preparation: Non-excitable T-lymphocyte cell line (Jurkat) was used with an extracellular medium containg NaCl or KCl. The amount of sodium ions ([Na+]) was controlled only to change the osmotic pressure, and the amount of potassium ions ([K+]) was controlled to change the membrane potential. Jurkat cells were cultured in RPMI 1640 medium with 10% fetal bovine serum and 1% penicillin/streptomycin at 37 °C and 5% CO2 in the air. To control the osmotic pressure only, we prepared three different media with additional [Na+] of -5, -10, and -15mM, respectively (n=5). To control the membrane potential, we also prepared three different media with [K+] of 20, 40, and 80mM, respectively (n=5). The composition of the cell medium was: 4.2mM KCl, 145.8mM NaCl, 20mM HEPES, 4.5g/L glucose, and 10μM EDTA with 7.2pH. For MR measurement, each cell suspension was loaded into each well perforated in a sphere-like acrylic phantom and centrifuged in the form of a pellet, as shown in Fig.1.MRI experiment: Experiments were performed at 9.4T (BioSpin, Bruker). A single spin-echo sequence with 40 echoes was used for quantitative T2 estimation. Also for the estimation of quantitative magnetization transfer (qMT) to obtain PSR, MR signals were acquired with an inversion recovery multi-echo spin-echo sequence with 40 inversion times (TI), together with 16 echoes to increase SNR on average. To measure ADCs, a diffusion weighted sequence with 50 b-values was used. A single slice 1 mm thick was set across the cell pellet region. Scan parameters are given in Fig.2.
Analysis: To estimate T2 and ADC values, single exponential decay fitting was used with respect to TEs and b-values. To estimating PSR values, bi-exponential fitting was used to solve the equation with a slow longitudinal relaxation rate (R1-) and a fast relaxation rate (R1+), indroduced in previous qMT studies,6,7
$$\frac{M_{z,f}(t)}{M_{∞,f}}=b_f^-exp(-R_1^-t)+ b_f^+exp(-R_1^+t)+1 [1]$$
where $$$M_{∞,f}$$$ is the equilibrium magnetization of free water protons. Then, PSR can be calculated from Eq.[1] as follows by assuming $$$R_{1,f}=R_{1,m}$$$6:
$$PSR= \frac{b_f^+}{b_f^-- \frac{M_{z,m}(0)}{M_{∞,m}} +1} [2]$$
where $$$M_{∞,m}$$$ is the equilibrium magnetization of macromolecular water protons. T2, ADC, and PSR values were plotted each other to evaluate the respective contribution of cell swelling and changes in hydrated water molecules due to changes in membrane potential.
Results and disscusion
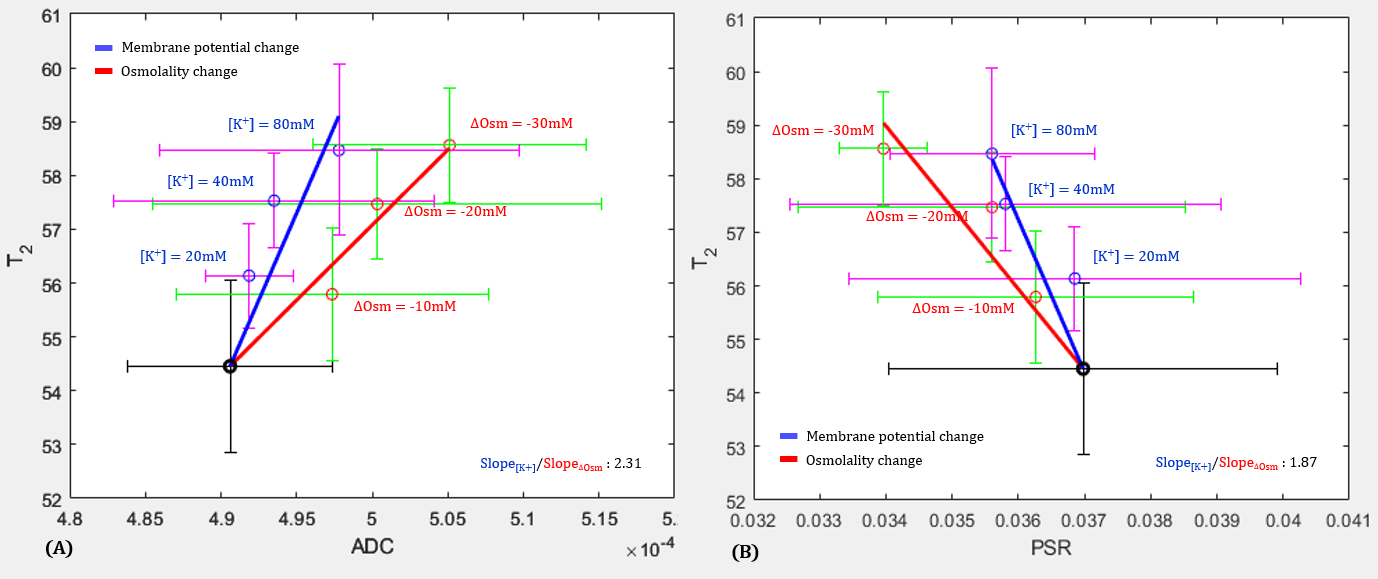
Figure 3 shows T2 versus ADC (A) and T2 versus PSR (B). T2 changes due to changes in membrane potential ([K+]) was marked in blue (Case 1) and T2 changes due to changes in osmotic pressure ([Na+]) was marked in red (Case 2). As shown in Fig.3A, T2 increased as ADC increased in both cases, where ADC is considered to be associated microstructural changes such as cell swelling. However, there was a difference in the slope of fitting between the two conditions (Slope1/Slope2, 2.31), implying that there is an additional factor contributing to the increase in T2 besides cell swelling.On the other hand, as shown in Fig.3B, T2 decreased as PSR increased in both cases (|Slope1/Slope2|, 1.87). Here, the PSR defined as the ratio of macromolecular (or hydrated) water proton and free water protons depends on changes in the density of hydrated water molecules due to cell swelling2,8, as well as changes in hydrated water molecules of the cell membrane. This result implies that another contributing factor considered in Fig.3A could be the change in hydrated water molecules of the cell membrane.
Although there were distict patterns for T2 versus ADC and PSR (n = 5), more trials need to be acquired to reduce the size of error bars in the plot.
Conclusion
In this study, we demonstrated that membrane potential change induces T2 increasing not only by cell swelling, and also by hydration changing with non-excitable Jurkat cells. Compared to cell swelling condition as [Na+] concentration change, membrane potential changing condition as [K+] concentration change derive the difference ratio of increasing T2 according to ADC and PSR. This in vitro study can be expanded to in vivo study, with more detail parameter than ADC corresponding to cell size, and PSR corresponding to hydrated water changes.Acknowledgements
This work was supported by the Brain Research Program through the National Research Foundation of Korea (NRF) funded by the Ministry of Science, ICT & Future Planning (NRF-2019M3C7A1031993).
References
[1] Toi, P. T., Jang, H. J., Min, K., Kim, S.-P., Lee, S.-K., Lee, J., Kwag, J., & Park, J.-Y. In vivo direct imaging of neuronal activity at high temporospatial resolution. In Science (Vol. 378, Issue 6616, pp. 160–168). American Association for the Advancement of Science (AAAS), 2022.
[2] Proc. Intl. Soc. Mag. Reson. Med. 29. Noninvasive detection of changes in membrane potential with magnetic resonance measurements, 2021.
[3] Bandettini, P. A., Petridou, N., & Bodurka, J. Direct detection of neuronal activity with MRI: Fantasy, possibility, or reality? In Applied Magnetic Resonance (Vol. 29, Issue 1, pp. 65–88), 2005.
[4] Lee, H. J., Jiang, Y., & Cheng, J.-X. Label-free optical imaging of membrane potential. In Current Opinion in Biomedical Engineering (Vol. 12, pp. 118–125), 2019.
[5] Didier, M. E. P., Tarun, O. B., Jourdain, P., Magistretti, P., & Roke, S. Membrane water for probing neuronal membrane potentials and ionic fluxes at the single cell level. In Nature Communications (Vol. 9, Issue 1), 2018.
[6] Li, K., Zu, Z., Xu, J., Janve, V. A., Gore, J. C., Does, M. D., & Gochberg, D. F. Optimized inversion recovery sequences for quantitative T 1 and magnetization transfer imaging. In Magnetic Resonance in Medicine (Vol. 64, Issue 2, pp. 491–500), 2010.
[7] Henkelman, R. M., Stanisz, G. J., & Graham, S. J. (2001). Magnetization transfer in MRI: a review. In NMR in Biomedicine (Vol. 14, Issue 2, pp. 57–64), 1974.
[8] Tarun, O. B., Hannesschläger, C., Pohl, P., & Roke, S. Label-free and charge-sensitive dynamic imaging of lipid membrane hydration on millisecond time scales. In Proceedings of the National Academy of Sciences (Vol. 115, Issue 16, pp. 4081–4086), 2018.
Figures