1364
Reproducibility and sensitivity of in vivo human brain R1 map at ultralow field 64 mT
Joong Hee Kim1, Govind Nair1, Daniel Reich1, and David L. Brody1
1National Institute of Health, Bethesda, MD, United States
1National Institute of Health, Bethesda, MD, United States
Synopsis
Keywords: Relaxometry, Low-Field MRI, Ultra low field
MR parameter mapping provides objective biomarkers for living tissues. However, long scan times and high field MR imaging are typically required, whereas few ultralow field MR scanner studies have been performed. Here we propose a simplified R1 mapping protocol with only two inversion delay time points (R1approx), taking advantage of the fast R1 at ultralow field. The R1 characteristics of human brain were largely preserved in R1approx compared to standard inversion recovery R1 mapping. R1approx. required under 30 minutes vs. ~two hours for standard R1 mapping. In addition, R1approx. shows high reproducibility and good sensitivity to an R1 contrast agent.Introduction
MR parameter mapping, including R1, R2, and diffusion mapping, may provide quantitative assessments of brain morphology or pathology, potentially enabling reliable longitudinal assessments and multi-site analyses. The recently introduced ultralow field (64 mT) Hyperfine MR scanner has great potential to be used as diagnostic tool for ICU and other critically ill patients due to its mobility and safety. Yet due to hardware limitations, advanced MR pulse sequence-derived MR parameter mapping have not been readily achieved at ultralow field. In this study, we propose an approach to highly reproducible approximate R1 mapping methodology at ultralow field.Methods
All MR measurements were performed using Hyperfine 64 mT, Guilford, CT, USA (https://hyperfine.io/). Inversion recovery T1-weighted images (IRT1W) were acquired for 3.0 nm iron oxide nanoparticle phantom (IONP) with repetition time (TR) = 4000 ms, echo time (TE) = 3.6 ms, and 14 inversion delay time (TI) from 100 ms to 3500 ms. The R1 of IONP was assessed with full (14 TI points) and reduced (6 and 7 TI points) data point following modified fast inversion recovery (MFIR)(1). Human brain MRI imaging in three normal male volunteers, age at 51, 52, and 67, were performed under the National Institutes of Health Institutional Review Board (NIH IRB) approved protocol (NCT00001711). Informed consent was obtained prior to scans, which were conducted in the Clinical Center at the National Institutes of Health (NIH). IRT1W were acquired with following parameters; scan time of each IRT1W = 14 min 35 sec (Total scan time = 117 min), voxel size = 1.56 mm x 1.56 mm x 5.0 mm, TR = 4000 ms, TE = 3.6 ms, and 6 inversion delay time points at 200 ms, 300 ms, 400 ms, 550 ms, 800 ms, 1600 ms, and 3500 ms. The IRT1W at 400 ms and 3500 ms were collected twice. Subjects were repositioned prior to collecting the 2nd IRT1W series at 400 ms and 3500 ms. All images were co-registered using the advanced normalization tools (ANTs, http://stnava.github.io/ANTs/). The MFIR and approximate mono-exponential analysis derived R1 mapping were described in Scheme 1. Human brain R1 values were estimated at each voxel using 6 inversion time points with MFIR1 where the MR signal at inversion time point (M(TI)) is defined in equation [1] of Scheme 1 and M0 is the MR signal at equilibrium state, approximate by IRT1W at 3500 ms. The approximate R1 mapping of human brain was performed using IRT1W at 400 ms and 3500 ms. The long TR and fast R1, specifically at ultralow field, makes the constant term of MFIR negligible enabling mono exponential based R1approx. mapping with only two TI points, one at equilibrium TI0 and the other at appropriate TIc. With assumption of fast R1 recovery at ultralow field and long TR, the second term of equation [1] of Scheme 1 becomes negligible resulting in R1approx as in equation [3] of Scheme 1 where TIc = 400 ms and Mc = IRT1W at TI = 400 ms. The reproducibility of R1approx. maps was quantified using test-retest signal to noise ratio maps (TrTSNR)(2).Results
Fig. 1 shows R1 values of IONPs assessed by MFIR using 6, 7, and 14 TI points and mono exponential based R1approx. mapping with only two TI points. The assessed R1s were largely preserved from 14 to 2 TI points. Thus, human brain R1 assessed using MFIR with 6 TI points was used as reference. The brain tissue R1 values were largely preserved from MFIR to R1approx. mapping, except for a discrepancy in ventricle region between two methods, Fig. 2. The high R1 at ventricle from R1approx. mapping is expected due to slow inversion recovery of CSF, meaning that it does not pass the null point at TI = 400 ms. The reproducibility was assessed using TrTSNR map2. Considering the value of 20 in TrTSNR represents 95 % reproducibility, the reproducibility of R1approx. mapping is quite high for most parts of the brain. Figure 3 shows quantified R1 values of human brain. The R1 characteristic of brain tissue, fast in white matter and slow in gray matter, is similar for both approaches. The sensitivity of R1approx. mapping to the effects of an R1 contrast agent was assessed by digital simulation, Fig. 4. For both low and high contrast agent relaxivity, the subtraction approach reflects the contrast agent induced R1 enhancement better than a simple R1 map without baseline subtraction.Discussion
These results describe a potential method to assess R1 of human brain at ultralow field. The simplified approximate R1approx. mapping successfully showed the longitudinal relaxation characteristics of human brain tissue, providing good segmentation between gray and white matter. The reproducibility of R1approx. mapping may have been limited by the large voxel size in this study compared to conventional clinical MR scanners, preventing precise image co-registration. Thus, improved spatial resolution, specifically in slice thickness, would enable even more highly reproducible R1 mapping.Conclusion
Overall, the scan time required for R1approx. mapping (~29 min) is much more clinically feasible than full MFIR-based R1 mapping (~117 min). For longitudinal assessments (e.g., pre- vs. post-contrast), the reliability of R1 mapping is more important than the precise values of R1 obtained.Acknowledgements
This research was funded by the Center for Neuroscience and Regenerative Medicine and the NINDS Intramural Research Program. The authors have no conflicts of interest to disclose. The views, information or content, and conclusions presented do not necessarily represent the official position or policy of, nor should any official endorsement be inferred on the part of, the Uniformed Services University, the Department of Defense, the U.S. Government or the Henry M. Jackson Foundation for the Advancement of Military Medicine, Inc.References
1. Gupta et al., A modified fast inversion-recovery technique for spin-lattice relaxation measurements. Journal of Magnetic Resonance 38, 447-452 (1980).
2. Kim et al., Sensitive detection of extremely small iron oxide nanoparticles in living mice using MP2RAGE with advanced image co-registration. Sci Rep 11, 106, doi:10.1038/s41598-020-80181-9 (2021).
Figures
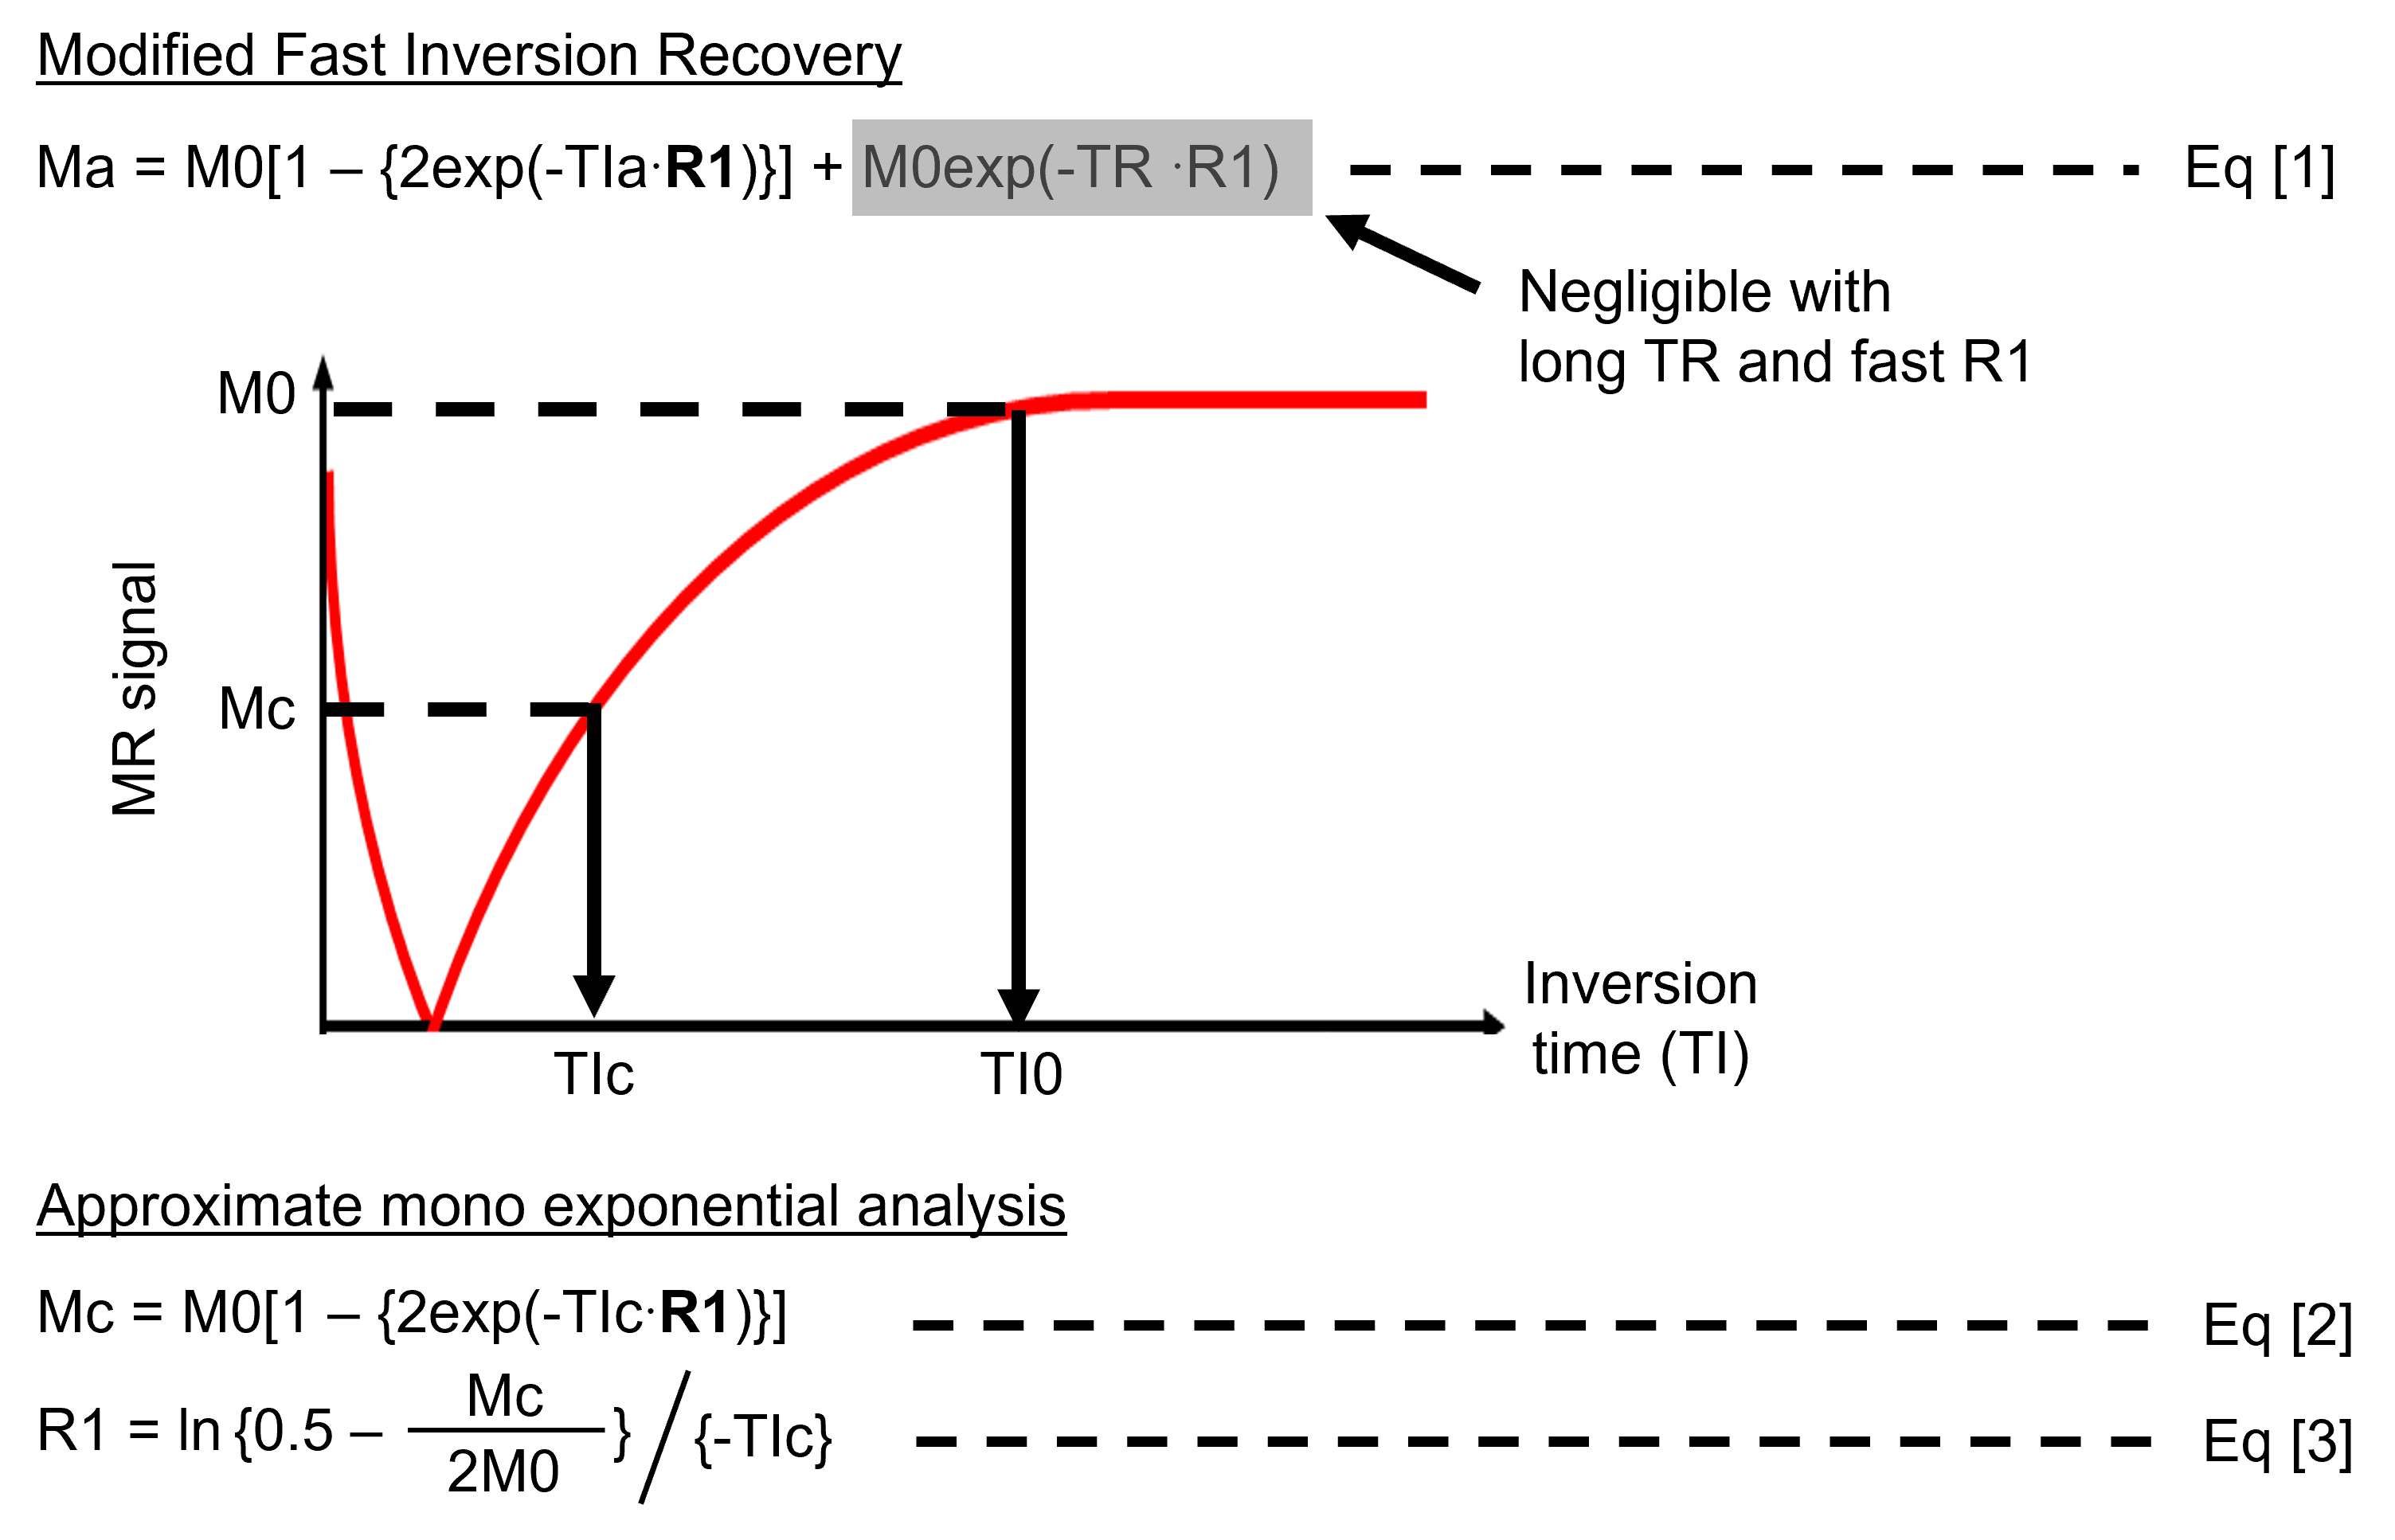
Scheme 1. Modified
fast inversion recovery (MFIR) and approximate mono-exponential analysis. R1
assessed by MFIR, equation [1], served as a reference. The long repetition time
(TR) and fast R1 at ultralow field makes the constant term in Eq [1] negligible
enabling the approximate mono-exponential analysis, equation [2] and producing
the approximate R1 map, R1 approx. map Eq [3].
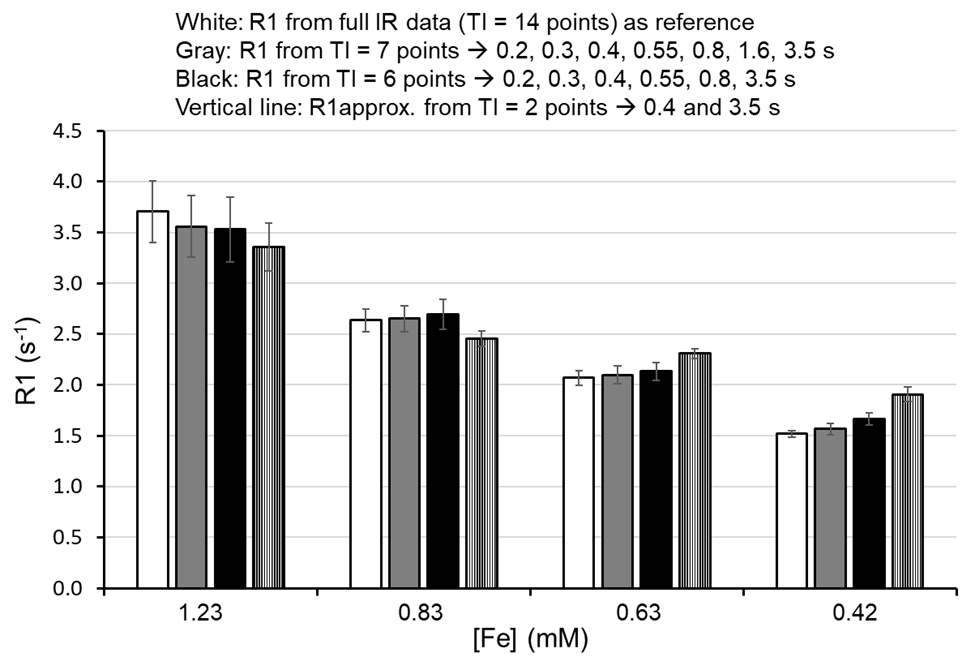
Figure 1. R1
assessment of 3.0 nm iron oxide nanoparticle (IONP) using modified fast
inversion recovery. The R1 of IONP was assessed with full (white-14 points) and
reduced TI points (Gray-7 points, Black- 6 points, and vertical line – 2
points). The standard deviation is from histogram of region of interest. The
assessed R1 values are largely preserved from 14 points to 2 points except slow
R1 like 0.42 mM [Fe] IONP.
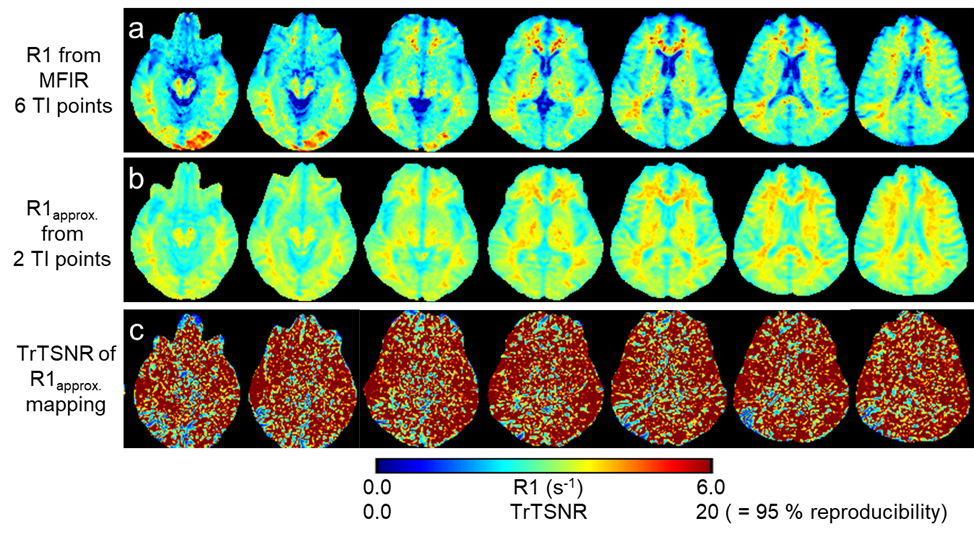
Figure 2. R1 map vs.
R1approx. map of human brain. The R1 maps from MFIR (panel a, 6 TI
points) served as reference. The R1approx. maps
(panel b) were highly comparable to R1 maps from MFIR (panel a) except for in CSF
regions. The R1approx. maps
were acquired twice on the same subject producing test-retest signal to noise
ratio (TrTSNR) map, panel c. The reproducibility of R1approx. mapping of human brain is mostly
95 % or higher for the entire brain except for CSF regions.
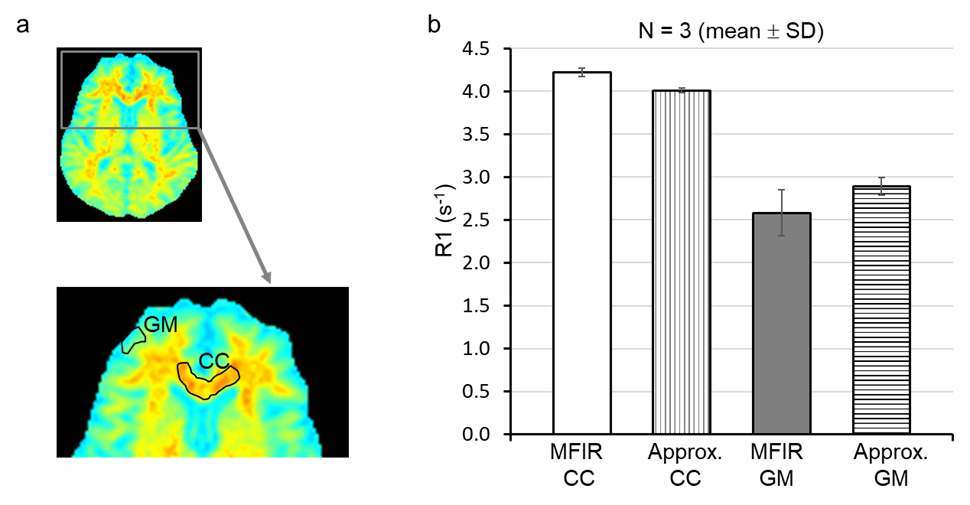
Figure 3. Quantified
R1 values from MFIR and approximate mono-exponential analysis. The region of
interest analyses was performed on corpus callosum (CC) and gray matter (GM),
panel a. The quantified R1 values from approximate R1 mapping (2 TI points, 29
minutes 10 seconds) were largely comparable to those from MFIR (6 TI points, 1
hr 27 minutes), panel b.
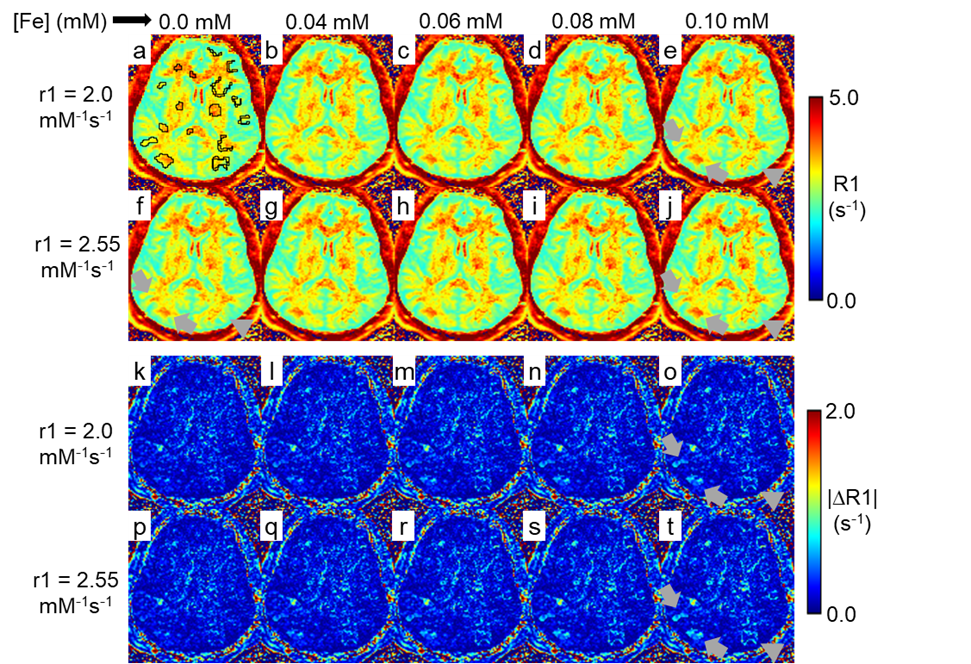
Figure 4. Digital simulation testing of the conspicuity of an R1 contrast agent
in R1approx. maps. R1approx. mapping was performed
twice on the same subject. The two sets of R1approx. maps were
co-registered. The 2nd R1approx. maps received digitally
simulated additional R1 values equivalent to up to 0.1 mM [Fe] of IONP, panels
a – j. The subtraction of naive 1st R1approx. map from 2nd
R1approx. maps produced subtraction
maps, panels k – t. The digitally added additional R1s indicated by arrows and
arrow-heads were clearly visible in subtraction maps but not in R1approx.
maps.
DOI: https://doi.org/10.58530/2023/1364