1360
Spectrally Selective On-Resonance Inversion Recovery at 7T for Multiple Component T1 Mapping1Center for Advanced Metabolic Imaging in Precision Medicine, Department of Radiology, University of Pennsylvania, Philadelphia, PA, United States, 2Department of Psychiatry, University of Pennsylvania, Philadelphia, PA, United States
Synopsis
Keywords: Contrast Mechanisms, White Matter, High-Field MRI, Inversion Recovery
Two sets of images were acquired on four healthy subjects using separate on-resonance selective and broadband inversion recovery (IR) sequences at nine different inversion times. These images were fit to a bi-exponential T1 fitting model aiming to separate out specific long and short components. The selective IR data showed a substantial increase in white matter contrast compared to the broadband data with an average T1 of approximately 300ms. This agrees with reported literature values of the T1 of myelin and suggest it may be a potential driver of this selective short T1 component contrast.Introduction
In recent years there has been a growing interest in exploiting the potential contrast mechanism present in on-resonance inversion recovery (IR) imaging of the free water proton pool. The resulting inversion recovery contrast can indirectly measure the contribution from the immobile macromolecular proton pool via cross-relaxation. The method, known as quantitative magnetization transfer (qMT), has been shown to be effective at generating contrast when selectively inverting free water protons at 3T1 and lipid protons at 7T2. With the high composition of myelin-associated lipids found in the white matter of the brain, this IR method has been suggested to show good initial correlation in myelin content. By applying a bi-exponential model to data acquired at various inversion times, short and long T1 components can be isolated, corresponding to the immobile and free water proton pools. By quantifying these T1 values and comparing them against reported literature values, it can be determined whether myelin is truly being seen as the potential primary driver of this short-component contrast. This worked aimed to investigate a spectrally selective on-resonance IR sequence in comparison to a broadband IR sequence and the resulting short and long T1 components as a novel myelin-associated contrast mechanism at 7T.Methods
All images were acquired on a 7T system (Magnetom Terra, Siemens Healthcare, Erlangen, Germany) using a volume transmit 32-channel receive phased-array head coil (Nova Medical, Wilmington, MA, USA). Four healthy subjects were imaged with informed consent under local regulatory supervision. A modified 2D turbo FLASH sequence was utilized with TR=8000ms, TE=1.69ms, and an in-plane resolution of 0.5x0.5mm2 with a 5mm slice thickness. A spectrally selective IR pulse was created to invert water at 4.7ppm with a frequency selective range of 0.6ppm. A conventional broadband IR sequence was also acquired at the same time for comparison. Both broadband and selective inversion scans were acquired across 9 inversion times (TI): (100, 300, 500, 700, 900, 1100, 1500, 2500, 5000ms). Analysis was performed by fitting images at all TI's to a multi-parameter bi-exponential T1 fit, seen in the equation below, to generate long (T1,L) and short (T1,S) component T1 maps. In the equation, parameters 'a' and 'c' correspond to respective amplitudes of short and long T1 compartments, 'b' and 'd' correspond to respective inversion efficiency correction for short and long T1 compartment, and 'f' is an offset correction.$$a(1-2be^{\frac{-TI}{T_{1,S}}})+c(1-2de^{\frac{-TI}{T_{1,L}}})+f$$
As a white matter contrast comparison, T1-weighted (T1w) and T2-weighted (T2w) images were acquired at 3T and 7T and used to calculate the T1w/T2w ratio images3,4. All image processing and analysis was performed in MATLAB (Mathworks Inc., MA, USA).
Results
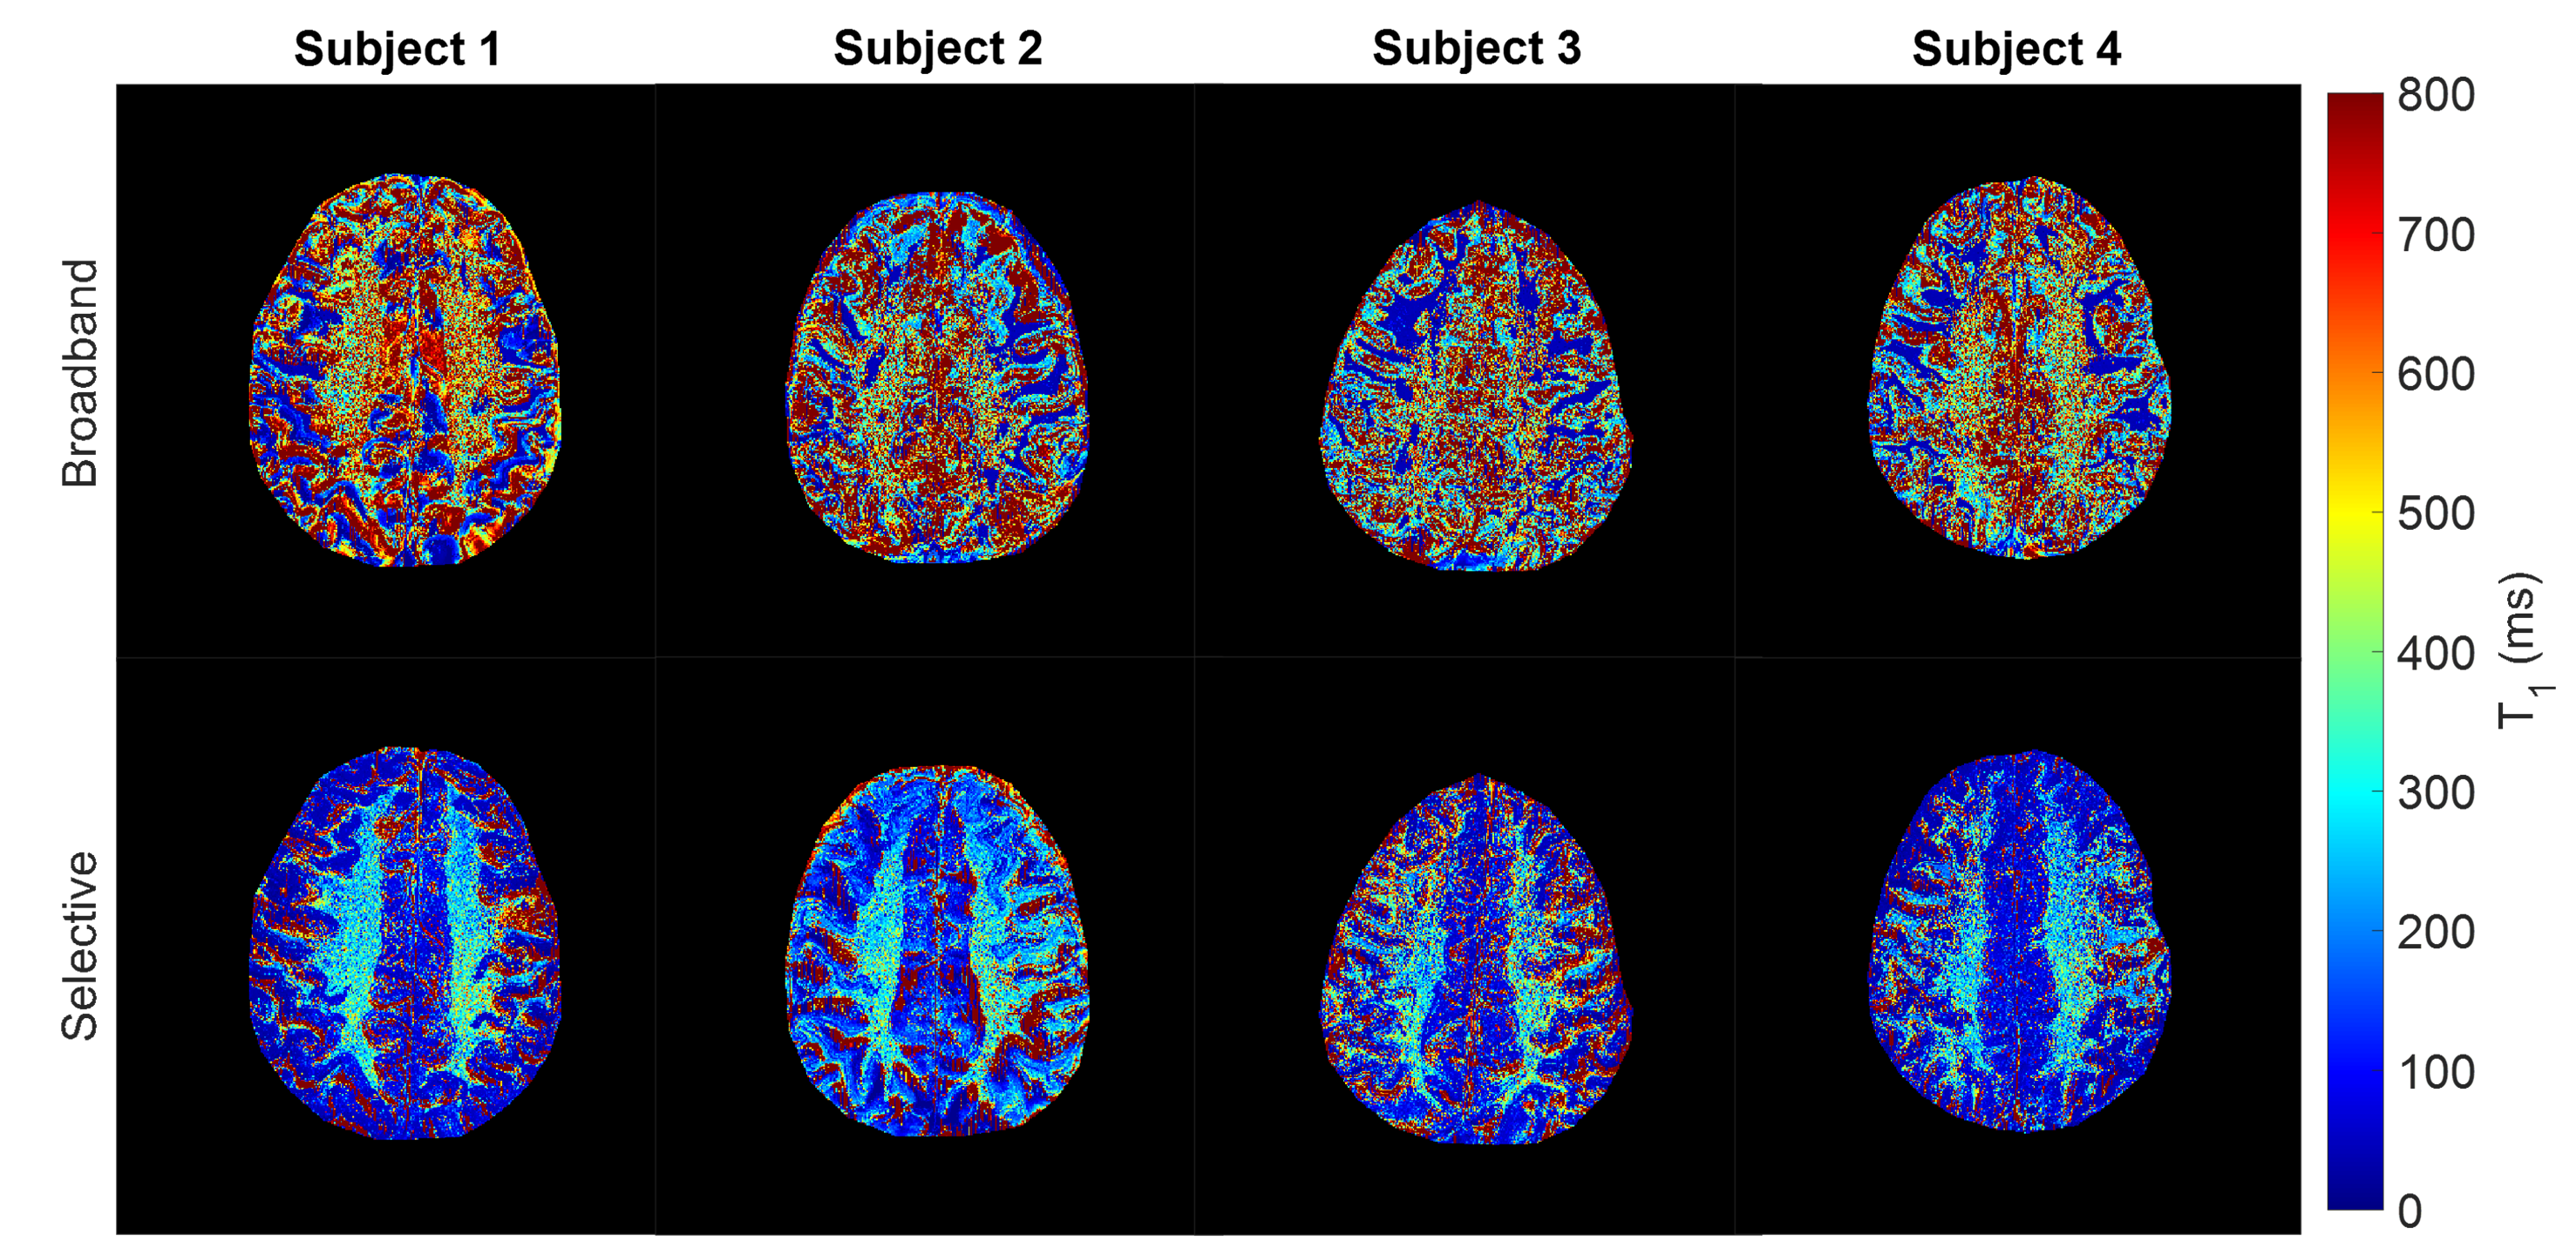
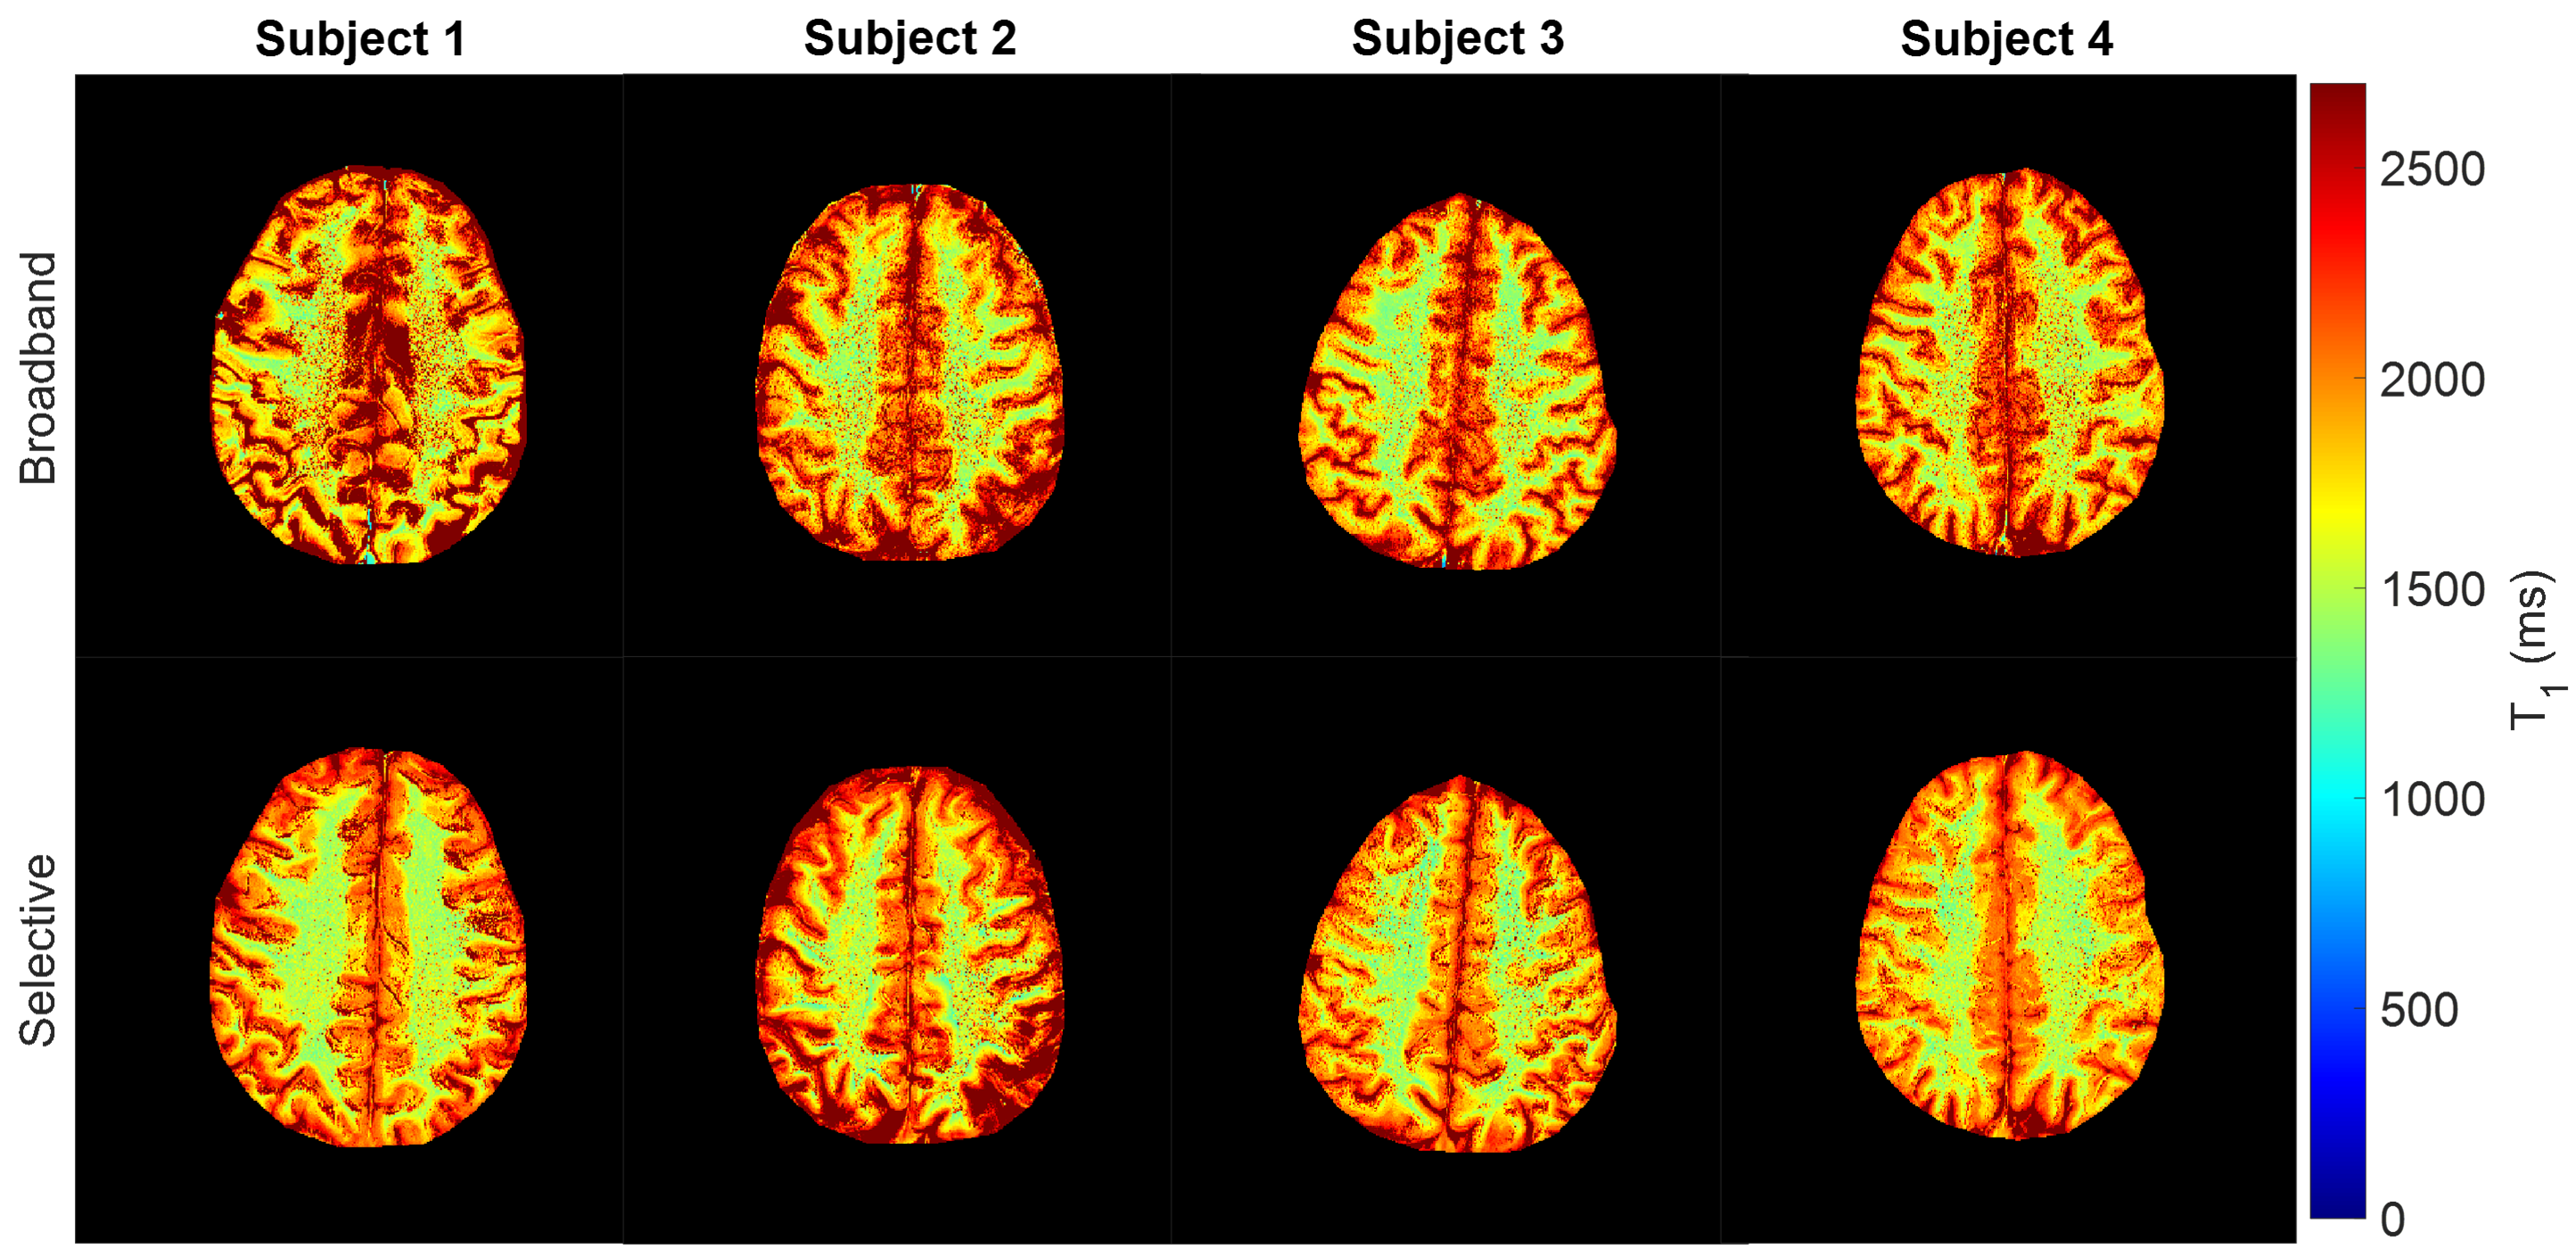
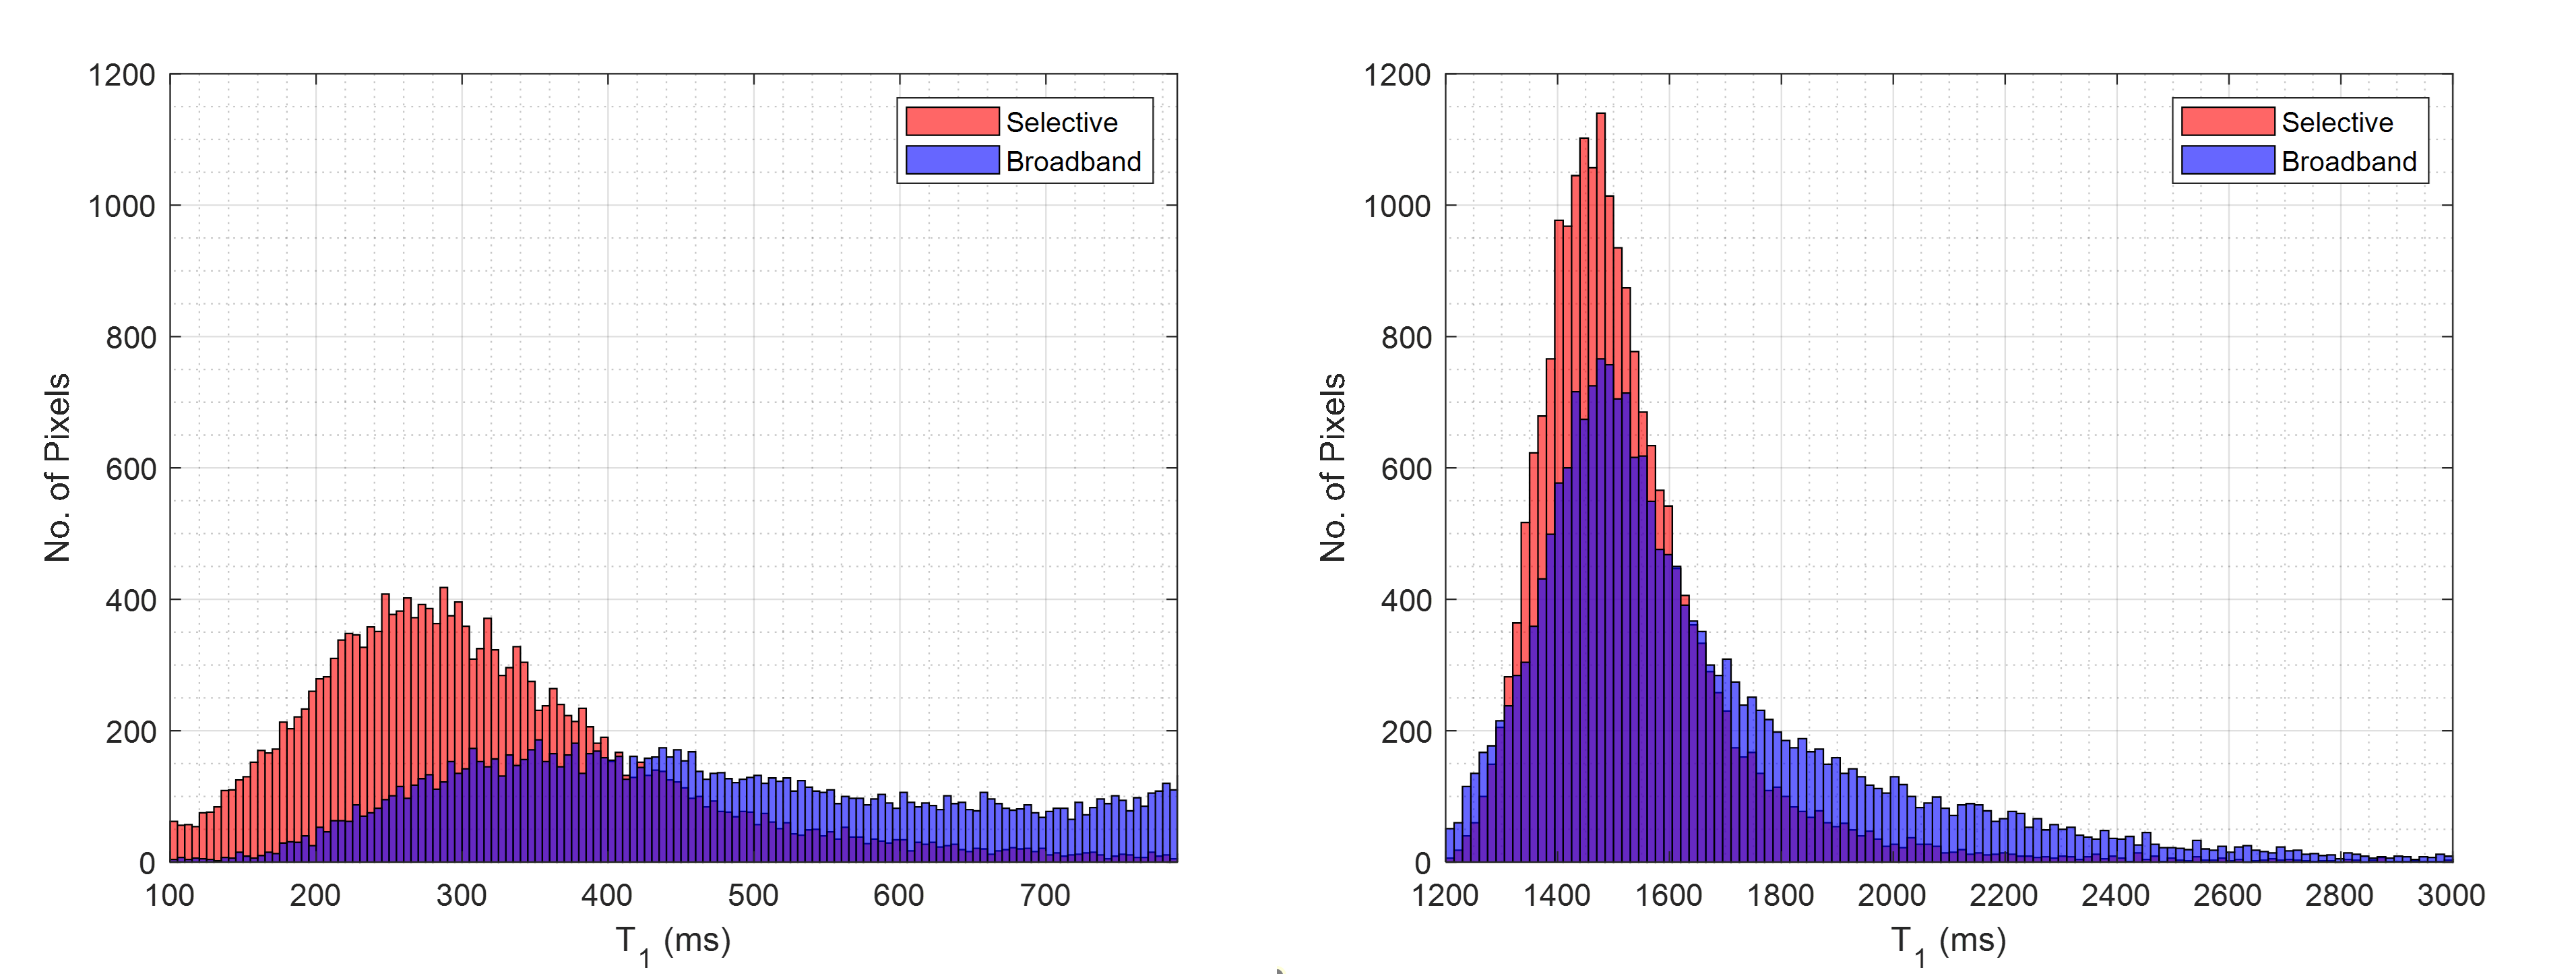
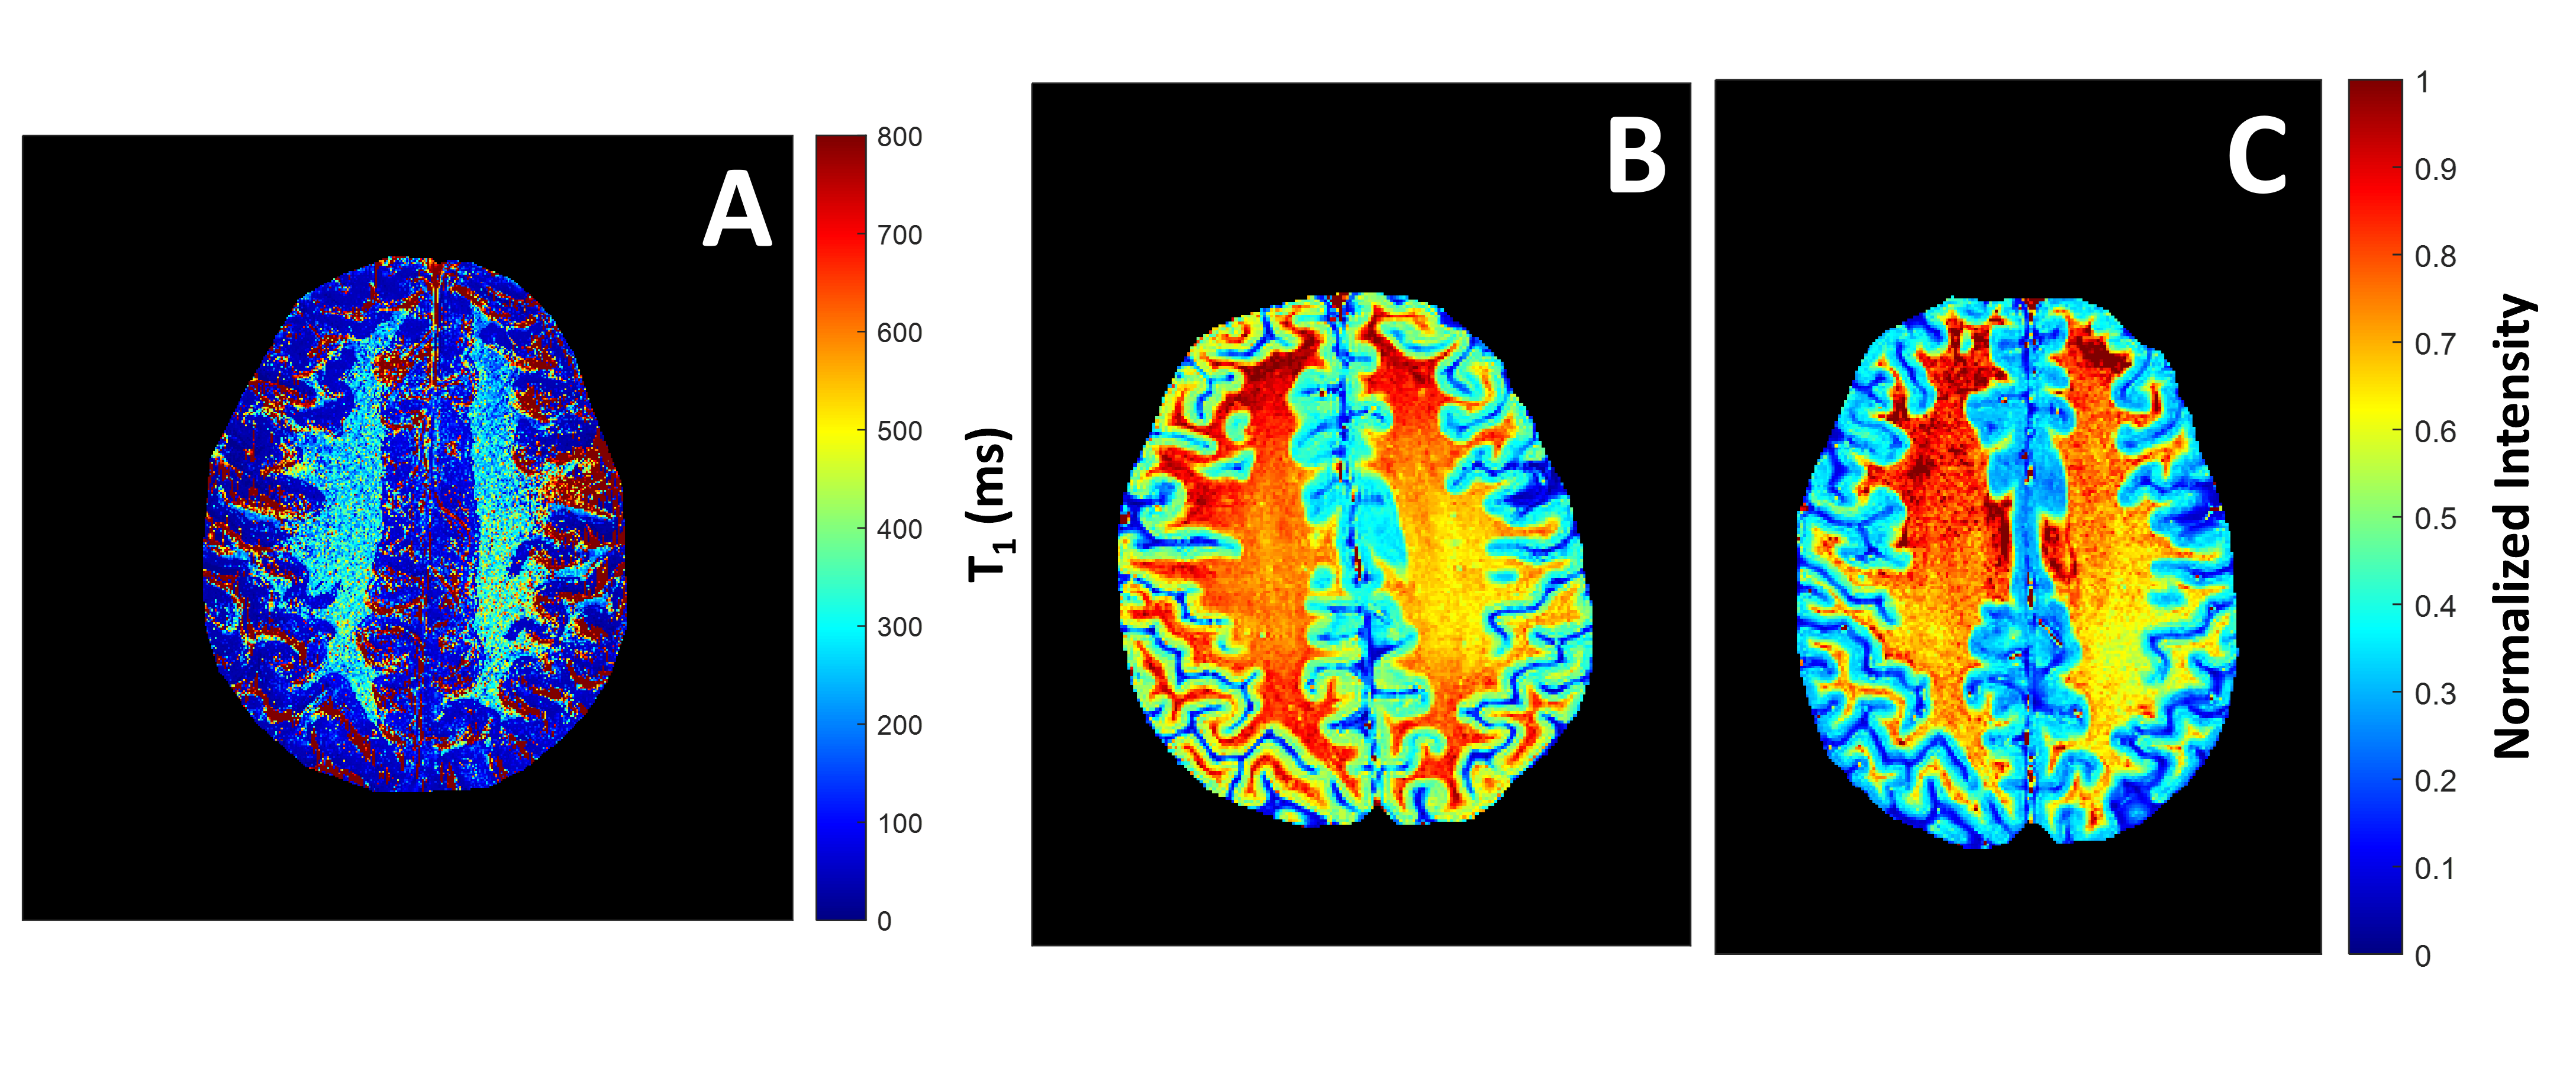
Figure 1 shows the short T1 component images for the selective and broadband IR acquisitions across all four subjects, with Figure 2 showing the corresponding long component images for selective and broadband. From these images, the mean and standard deviation values for each long and short component set were as follows: short component selective = (300.16±136.82ms), short component broadband = (414.93±200.61ms), long component selective = (1530.60±209.44ms), and long component broadband = (1663.90±356.69ms). These corresponding mean and standard deviation values can be visually observed in the histogram distributions seen in Figure 3. Figure 4 shows a comparison between the selective IR short component (4a) and T1w/T2w ratio images at 7T (4b) and 3T (4c), reflecting similar contrast in the white matter regions.Discussion and Conclusion
Results presented here indicate that an increase in white matter contrast, stemming from a short T1 component, can be achieved using a spectrally selective on-resonance IR sequence. It is hypothesized that since myelin has an estimated T1 of 300ms5,6, this short T1 component originates from cross-relaxation of the inverted bound water with a high concentration of myelin lipids found in white matter7. This is seen in comparison to the short component from the broadband IR data, which shows no contrast in the same white matter region , indicating the same cross-relaxation effect is less dominant. The T1w/T2w ratio images emphasize the contrast difference between white and gray matter regions making for a reasonable comparison to other methods aiming to produce contrast in these regions, such as the contrast seen in the selective short component images. Several limitations were present in this work including partial volume effects from the 5mm slice thickness and the fitting model bot being robust to the limited TI times. In the future, the fitting model used may be more effective if more inversion times are acquired below 100ms and above 5000ms. Further work is needed to determine the specific contributions from different metabolites, including aromatic groups via separate up-field and down-field IR sequences.Acknowledgements
Research reported in this work was supported by the National Institute of Biomedical Imaging and Bioengineering of the National Institutes of Health under Award Number P41029460 (RR), the National Institutes of Health R01MH119185 (DR), R01MH120174 (DR), and by the National Institute of Aging of the National Institutes of Health under Award Number R56AG066656 (DR).References
. Dortch, R.D., et al., Optimization of selective inversion recovery magnetization transfer imaging for macromolecular content mapping in the human brain. Magnetic Resonance in Medicine, 2018. 80(5): p. 1824-1835.
2. Dortch, R.D., et al., Quantitative magnetization transfer imaging of human brain at 7 T. Neuroimage, 2013. 64: p. 640-649.
3. Glasser, M.F. and D.C. Van Essen, Mapping Human Cortical Areas In Vivo Based on Myelin Content as Revealed by T1- and T2-Weighted MRI. Journal of Neuroscience, 2011. 31(32): p. 11597-11616.
4. Beer, A., et al., Tissue damage within normal appearing white matter in early multiple sclerosis: assessment by the ratio of T1-and T2-weighted MR image intensity. Journal of Neurology, 2016. 263(8): p. 1495-1502.
5. Labadie, C., et al., Myelin Water Mapping by Spatially Regularized Longitudinal Relaxographic Imaging at High Magnetic Fields. Magnetic Resonance in Medicine, 2014. 71(1): p. 375-387.
6. Ma, Y.J., et al., Ultrashort echo time (UTE) magnetic resonance imaging of myelin: technical developments and challenges. Quantitative Imaging in Medicine and Surgery, 2020. 10(6): p. 1186-1203.
7. Lee, J., et al., So You Want to Image Myelin Using MRI: An Overview and Practical Guide for Myelin Water Imaging. Journal of Magnetic Resonance Imaging, 2021. 53(2): p. 360-373.
Figures