1356
FibraVasc: towards ex vivo MRI mapping of cerebral vascular territories, application to the vascularization of deep white matter bundles1BAOBAB, NeuroSpin, Université Paris-Saclay, CNRS, CEA, Gif-sur-Yvette, France, 2UMR 1253, iBrain, Université de Tours, Inserm, Tours, France, 3CHRU de Tours, Tours, France
Synopsis
Keywords: Relaxometry, Ex-Vivo Applications, Quantitative Imaging
The arterial distribution territories of the brain remain poorly characterized and are of major importance for treating ischemic strokes. We propose a new quantitative MRI approach for ex vivo mapping of vascular territories using paramagnetic gelatin injection into cerebral arteries to enhance MRI contrast at the gelatin level. This method was applied on one healthy human brain injected into the middle cerebral artery and accurately quantified the volume fraction of blood using a dedicated protocol and a modeling of the injected tissue signal. We projected the resulting mapping along the deep white matter fiber bundles.Introduction
Ischemic stroke is a leading cause of disability worldwide. Although invaluable imaging developments have been made to better detect and address this pathology, the arterial distribution territories of the brain remain poorly characterized, and deserves to be studied in more detail. While gray matter (GM) studies already identify corresponding main arteries vascular territories, white matter (WM) arterial supply remains lacunar in literature1. Current studies are mainly based on dissection and visual inspection. Since vascularization of the WM from one brain to another is more variable than GM vascularization, a systematic way of mapping seems necessary to investigate interindividual variability in a large cohort.Following an old idea from Duvernoy2 who injected cerebral vessels of ex vivo brains with black-colored gelatin before slicing to optically reveal their microvasculature, we propose a new ex vivo approach based on the post mortem simultaneous injection of paramagnetic gelatines into the arteries to map the cerebral vascular territories in the WM using quantitative MRI (qMRI).
Materials and methods
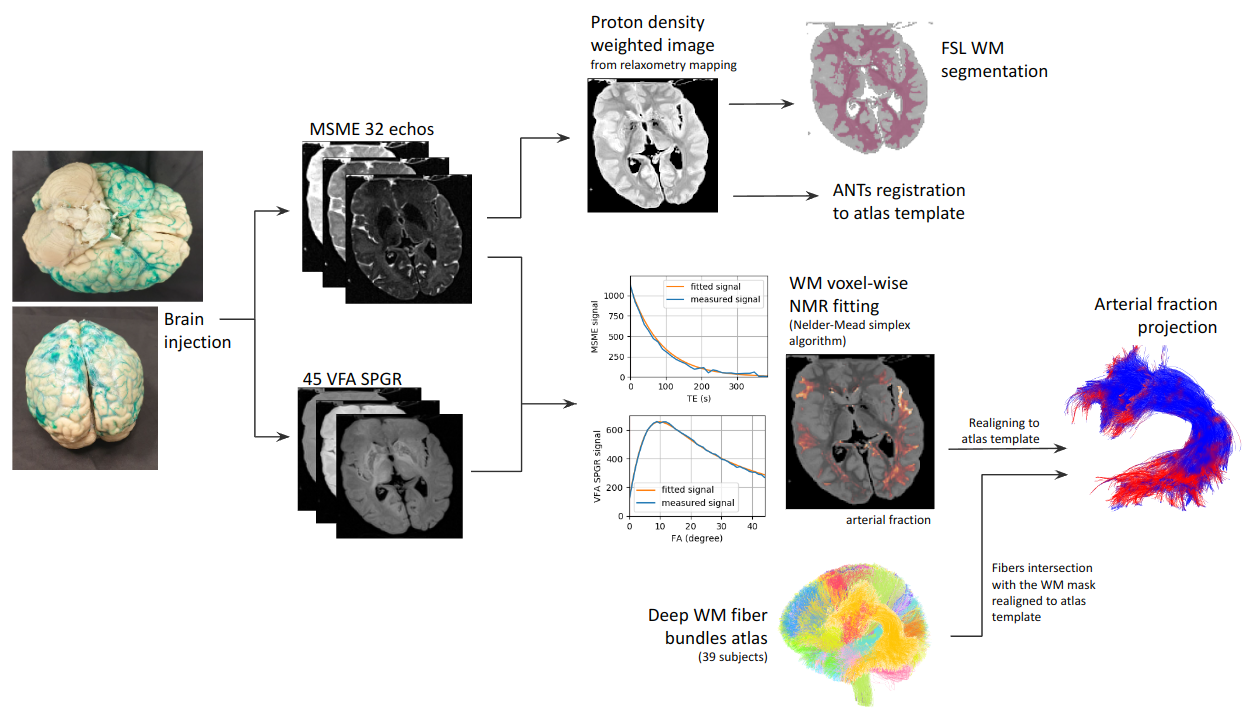
Tissue preparation: Following Smirnov et al. injection method3, a 90-year-old post mortem brain obtained from the Body Donation Program (Université de Tours) has been simultaneously injected with 1) 5%-gelatin solution colored with green dry pigment (SP vert 8, halogenated copper-phthalocyanine pigment), showing a specific paramagnetic signature after being formalin-fixed, in the middle cerebral artery (MCA) and 2) amagnetic pure 5%-gelatin solution in the anterior and posterior cerebral arteries in order to keep competitive pressure among distribution territories, mimicking the physiological blood flow.Acquisition Protocol: A dedicated qMRI protocol was designed on a 3T Siemens Prisma MRI to highlight gelatin contrast diffused in the brain including: 1) a T2-weighted Multi-Slice Multi-Echo (MSME) sequence (32 echo times TE from 12.9ms to 412.8ms, 1.2mm isotropic, read bandwidth RBW=200Hz, repetition time TR=10s) and 2) 45 T1-weighted VFA-SPGR sequences (TR=10ms, 45 flip angles FA ranging from 1° to 45°, 1.2mm isotropic). MSME-TEs and VFA-SPGR-FAs were sampled to obtain T2-weighted and T1-weighted NMR signals revealing both parenchyma and gelatin compartments.
Multicompartment relaxometry model: Within a voxel, we modeled the measured signal stemming from various compartments (parenchyma and green gelatin) using a multi-compartment model4-6. It is a common assumption to consider a "slow exchange" model of T2 relaxometry signal: T2 relaxation times are shorter compared to the time of water exchange between compartments. The measured signal results from the exponential contribution of the 2 compartments weighted by their volume fractions yielding such that:$$s_{MSME}(T_E)=\rho_{gelatin}f_{gelatin}e^{-\frac{T_E}{T_{2\;gelatin}}}+\rho_{parenchyma}(1–f_{gelatin})e^{-\frac{T_E}{T_{2\;parenchyma}}}$$On the contrary, a "fast exchange" model was used to model the T1 relaxation effects between compartments, since water mixing is supposed to be fast compared to the range of T1 values. The 2 compartments can therefore be compared to a single compartment characterized by an apparent relaxation time T1eq:$$s_{VFA\;SPGR}(\theta)=\left| s_\rho\rho\frac{\left(1-e^{-\frac{T_R}{T_{1eq}}}\right)sin(\theta)}{1-e^{-\frac{T_R}{T_1}}cos(\theta)}\right|$$where$$\frac{1}{T_{1eq}}=\frac{(1–f_{gelatin})}{T_{1\;parenchyma}}+\frac{f_{gelatin}}{T_{1\;gelatin}}$$Post-processing: A robust WM mask was computed using the FSL fast method7. Quantitative gelatin (corresponding to the arterial compartment) and parenchyma volume fractions were estimated with previous relaxometric equations using a non-linear programming optimizer (based on the Nelder-Mead simplex8). The magnetic signature of doped gelatin was fixed to T1/T2=1580ms/225ms stemming from a preliminary estimation within a gelatin sample and the WM magnetic signature was fixed to T1/T2=690ms/110ms established from a non-MCA irrigated area. The post mortem brain was further matched to the MNI ICBM 152 Non-Linear Asymmetric 2009c template9 using the ANTs diffeomorphic registration toolbox10,11, allowing the Chauvel’s human deep WM atlas12 to be projected onto the quantitative MCA volume fraction map.
Results
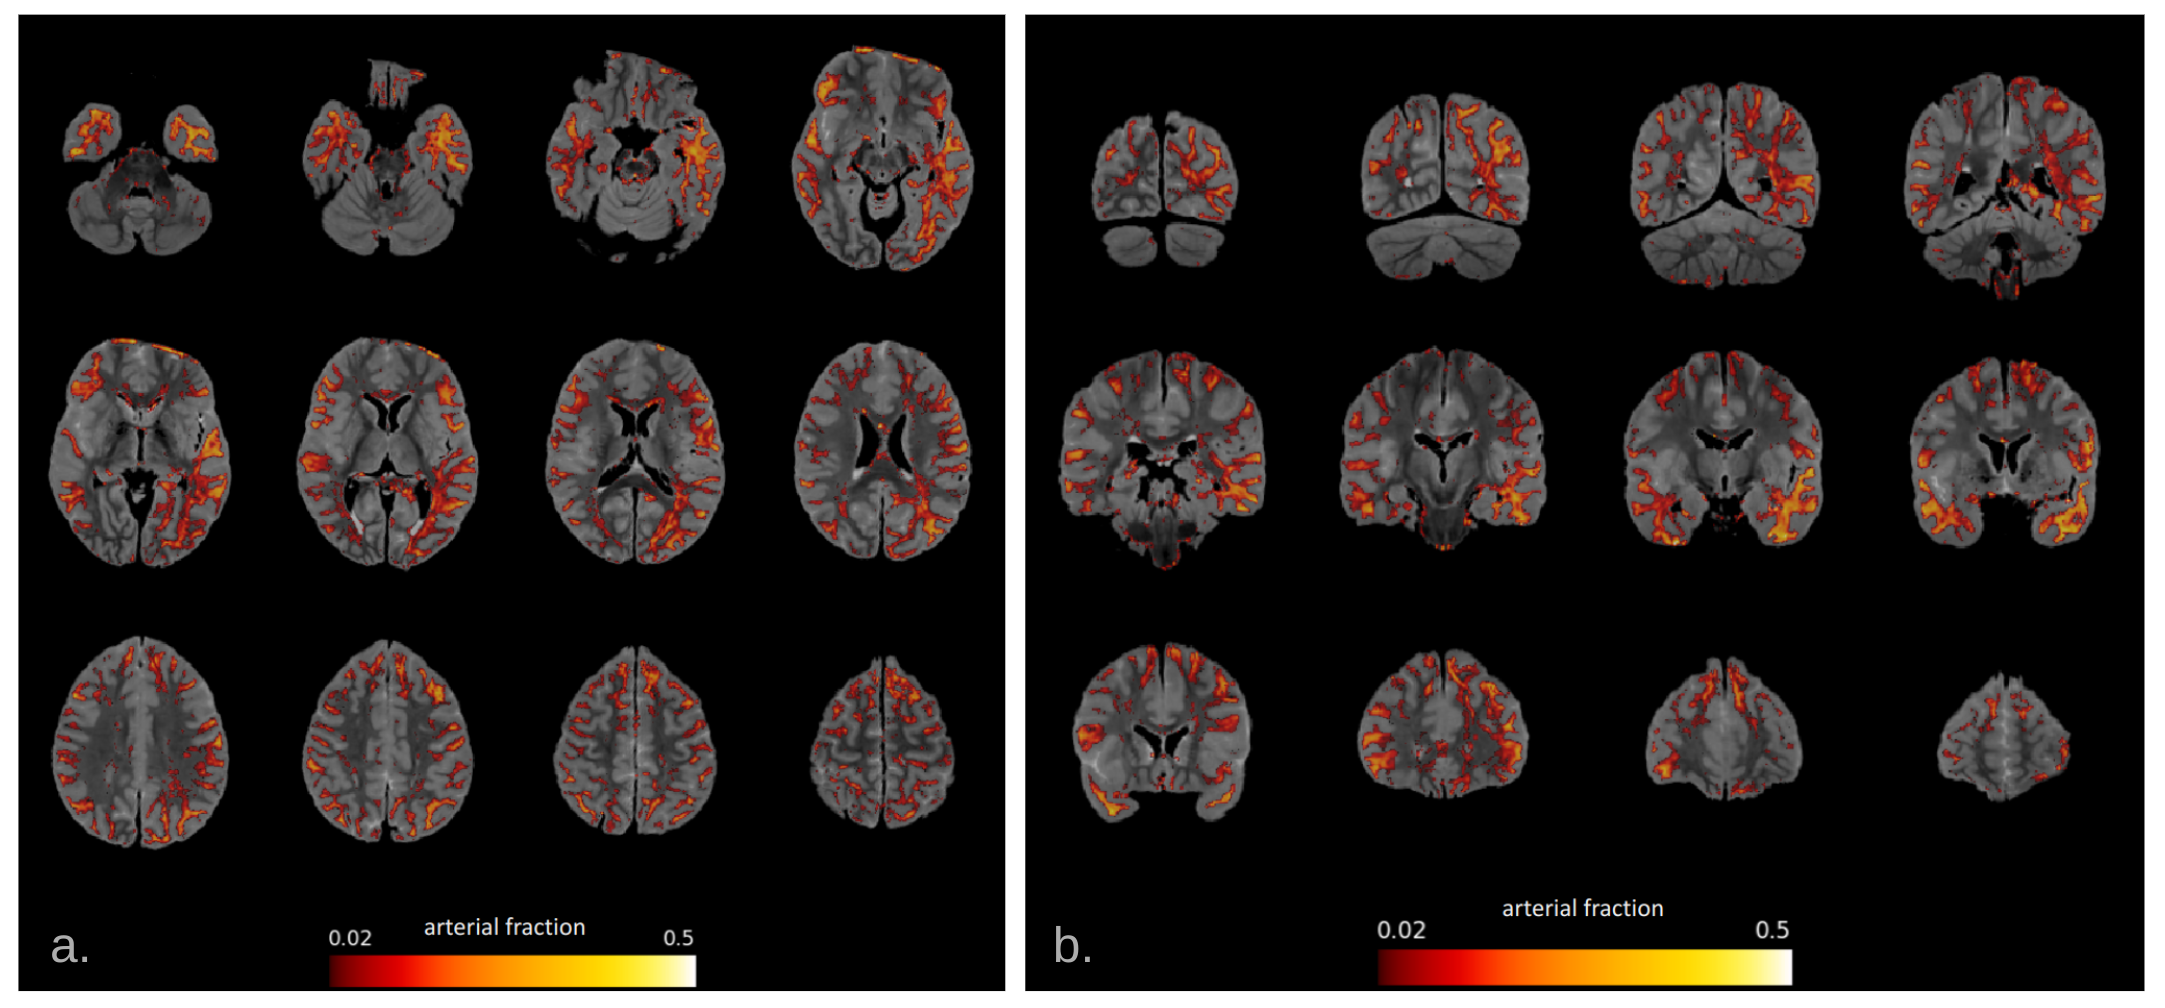
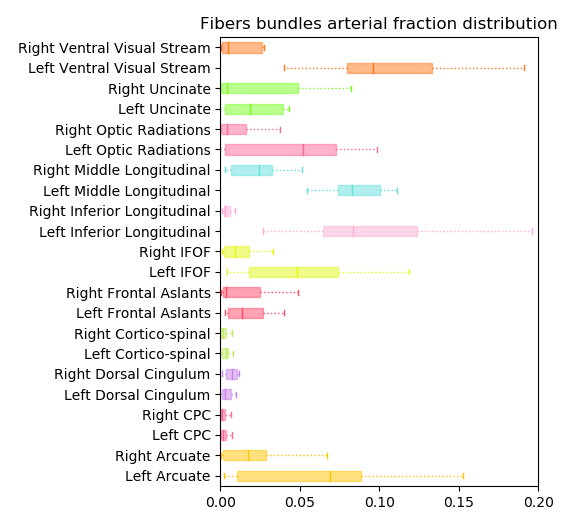
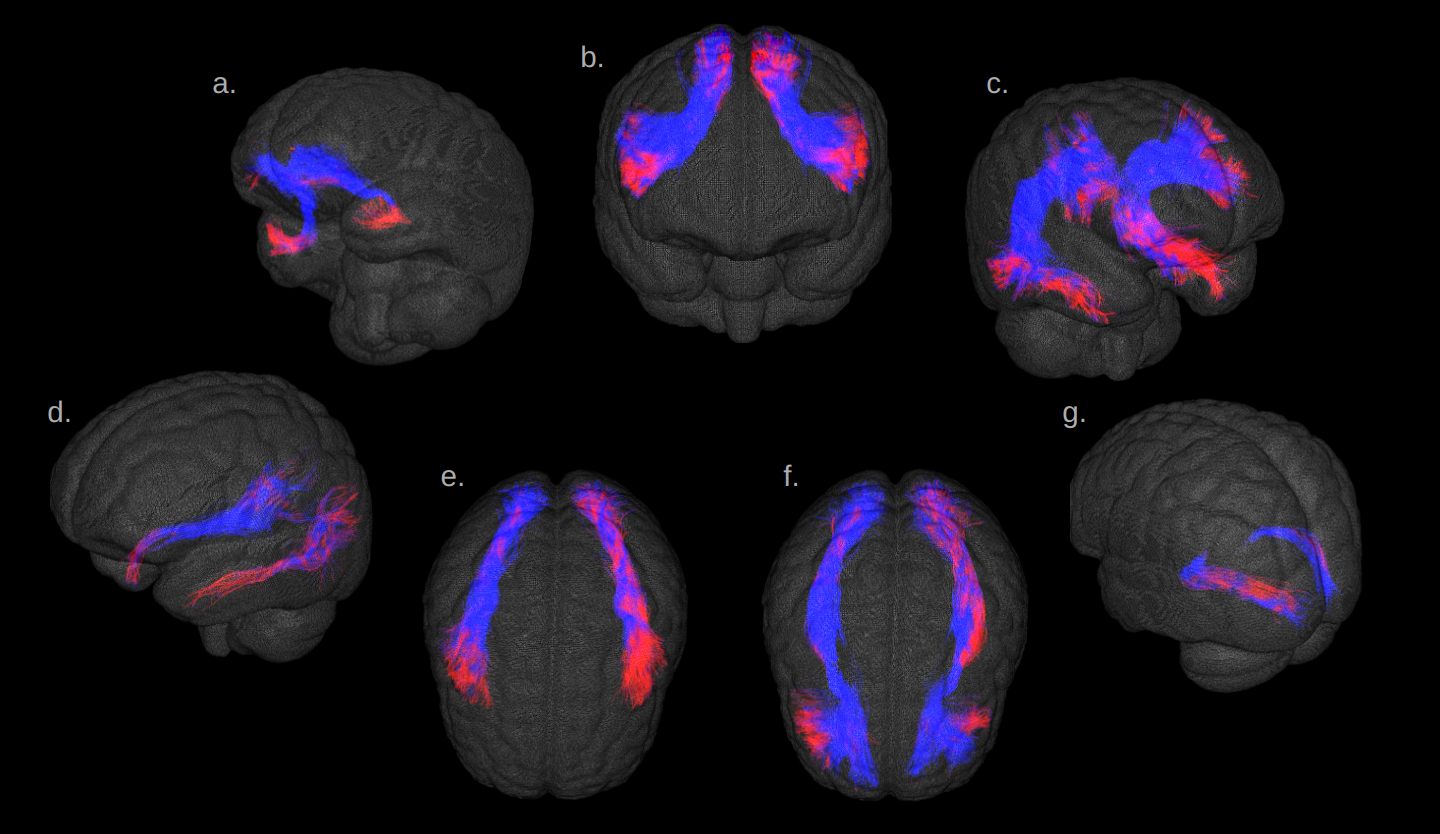
Fig.1 illustrates the preparation and post-processing pipeline from the gelatin injection step till the projection of MCA volume contribution for each deep WM bundle. Fig.2 depicts axial and coronal slices of the MCA volume fraction map overlaid onto the corresponding proton density map computed from the T2-weighted qMRI data. Fig.3 shows the statistical analysis highlighting the MCA contribution in the vascularization of deep WM bundles. Fig.4 illustrates the vascularization of the most MCA-irrigated deep WM bundles (arcuate, frontal aslants, inferior fronto-occipital, inferior/middle longitudinal, optic radiations, uncinate and ventral visual stream).Discussion
After injection, green gelatin was observed in a presumed PCA territory, probably arriving there retrogradely through the leptomeningeal or deep anastomoses. Interhemispheric variability of the anastomoses and in peripheral vascular resistance, could explain the left-right asymmetric presence of green gelatin in the occipital lobes. A validation procedure on serial sections after paraffin embedding is currently under treatment.In summary, we accurately quantified the arterial blood supply in all deep WM bundles and identified main MCA perfused areas. It typically ranges from 0% to 12% of the volume, which is in good agreement with the literature. Regarding the left-right asymmetry observed in the occipital lobe, we could also notice a net increase of the MCA supply within deep WM bundles originating from the occipital regions.
Conclusion
The developed approach not only allowed to map the MCA vascular territory but also provided accurate quantification of the local volume fraction of supplied blood. We believe that our work paves the way for the elaboration of a precise atlas of the cerebral vascular territories, particularly in the WM. In the future, we aim to simultaneously map the 3 main vascular territories (of the anterior, middle and posterior cerebral arteries) using doped gelatins characterized by different magnetic signatures.Acknowledgements
Brains/samples were obtained from the Body Donation Program (Association des dons du corps) of Université de Tours. Prior to death, participants gave their written consent for using their entire body – including the brain – for any educational or research purpose in which anatomy laboratory is involved. The authorization documents (under the form of handwritten testaments) are kept in the files of the Body Donation Program.
The authors sincerely thank those who donated their bodies to science so that anatomical research could be performed. Results from such research can potentially increase mankind's overall knowledge that can then improve patient care. Therefore, these donors and their families deserve our highest gratitude.
References
1. Smirnov M, Destrieux C, Maldonado IL. Cerebral white matter vasculature: still uncharted? Brain. 2021;144(12):3561-3575.
2. Duvernoy HM, Delon S, Vannson JL. Cortical blood vessels of the human brain. Brain Research Bulletin. 1981;7(5):519-579.
3. Smirnov M, Maldonado IL, Destrieux C. Fibravasc: A Method to Assess the Vascularization of Main White Matter Fiber Tracts. In Review; 2022.
4. Zimmerman JR, Brittin WE. Nuclear Magnetic Resonance Studies in Multiple Phase Systems: Lifetime of a Water Molecule in an Adsorbing Phase on Silica Gel. J Phys Chem. 1957;61(10):1328-1333.
5. Watanabe T, Murase N, Staemmler M, Gersonde K. Multiexponential proton relaxation processes of compartmentalized water in gels. Magn Reson Med. 1992;27(1):118-134.
6. Lancaster JL, Andrews T, Hardies LJ, Dodd S, Fox PT. Three-pool model of white matter. J Magn Reson Imaging. 2003;17(1):1-10.
7. Zhang Y, Brady M, Smith S. Segmentation of brain MR images through a hidden Markov random field model and the expectation-maximization algorithm. IEEE Trans Med Imaging. 2001;20(1):45-57.
8. Nelder JA, Mead R. A Simplex Method for Function Minimization. The Computer Journal. 1965;7(4):308-313.
9. Fonov V, Evans A, Mckinstry R, Almli CR, Collins L. Unbiased nonlinear average age-appropriate brain templates from birth to adulthood. Neuroimage. 2009;47.
10. Avants BB, Epstein CL, Grossman M, Gee JC. Symmetric diffeomorphic image registration with cross-correlation: evaluating automated labeling of elderly and neurodegenerative brain. Med Image Analysis. 2008;12(1):26-41.
11. Avants BB, Tustison NJ, Song G, Cook PA, Klein A, Gee JC. A reproducible evaluation of ANTs similarity metric performance in brain image registration. Neuroimage. 2011;54(3):2033-2044.
12. doi:10.5281/zenodo.7308510
Figures