1354
MRI relaxometry to measure the oxygen partial pressure and viscosity of the vitreous humour of the aging eye1Physiology, University of Auckland, Auckland, New Zealand, 2Optometry and Vision Science, University of Auckland, Auckland, New Zealand, 3Anatomy and Medical Imaging, University of Auckland, Auckland, New Zealand, 4Physiology and Biophysics, Stony Brook University, New York, NY, United States
Synopsis
Keywords: Relaxometry, Oxygenation, Human eye
The vitreous humour is a clear, gel-like fluid to provide structural support to the eye. Recently, it has been shown that the vitreous is important in regulating oxygen levels within the back of the eye. However, with ageing, the vitreous undergoes liquefaction, and as a result, oxygen is able to be move more freely throughout the vitreous, which increases the exposure of tissues such as the lens to oxygen. In this study, we developed MRI-based protocols to clinically monitor the oxygen levels and the fluid viscosity of the vitreous and applied these protocol in a cohort of elderly partipants.Purpose
The gel-like vitreous humour plays an important role in regulating oxygen levels within the eye. Break down of this gel-like barrier during age-related liquefaction of the vitreous may increase the exposure of the lens to oxygen, which increases the risk of cataract formation. MRI has been used to monitor the oxygen and fluid viscosity of the vitreous1,2. Therefore, in this study, we used in-vivo T1 and T2 MRI relaxometry to measure the oxygen partial pressure (pO2) and fluid viscosity in elderly human participants.Methods
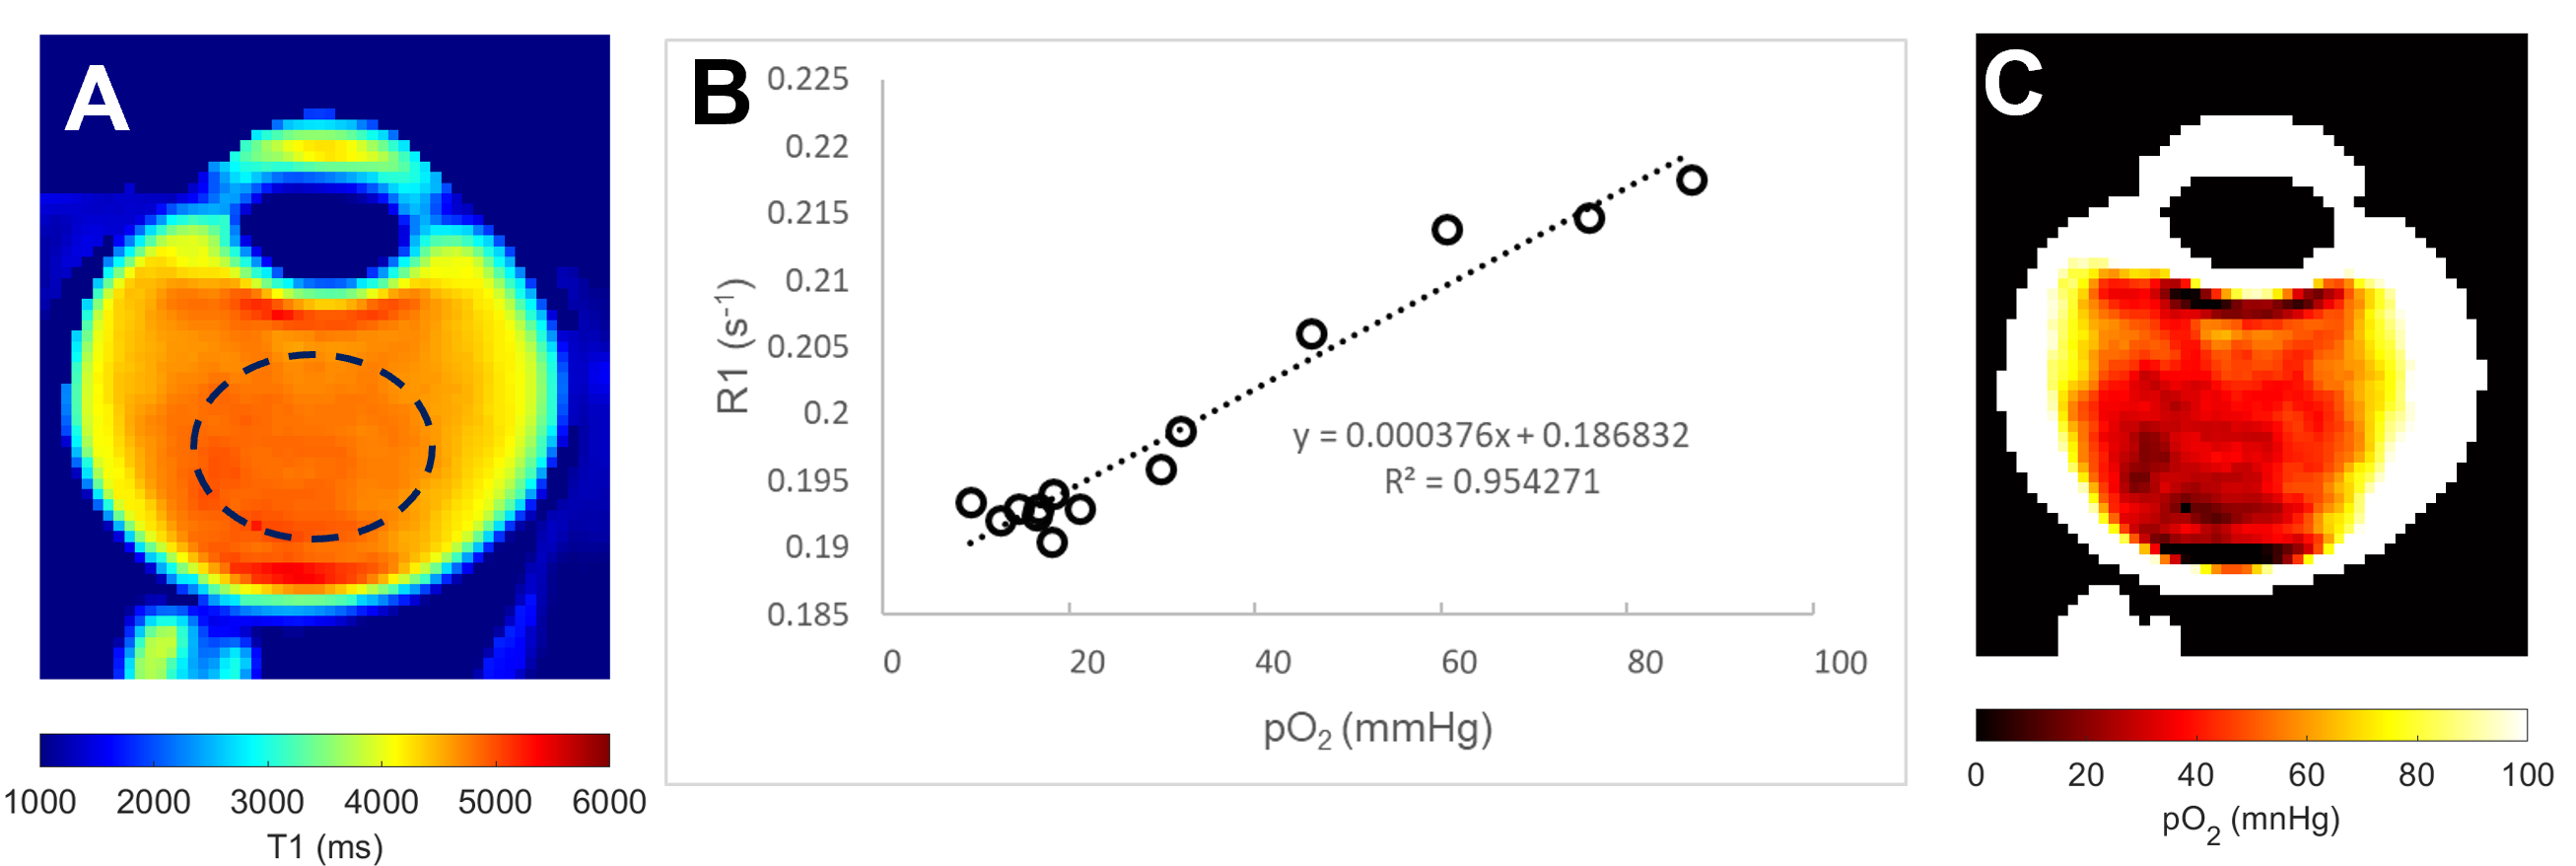
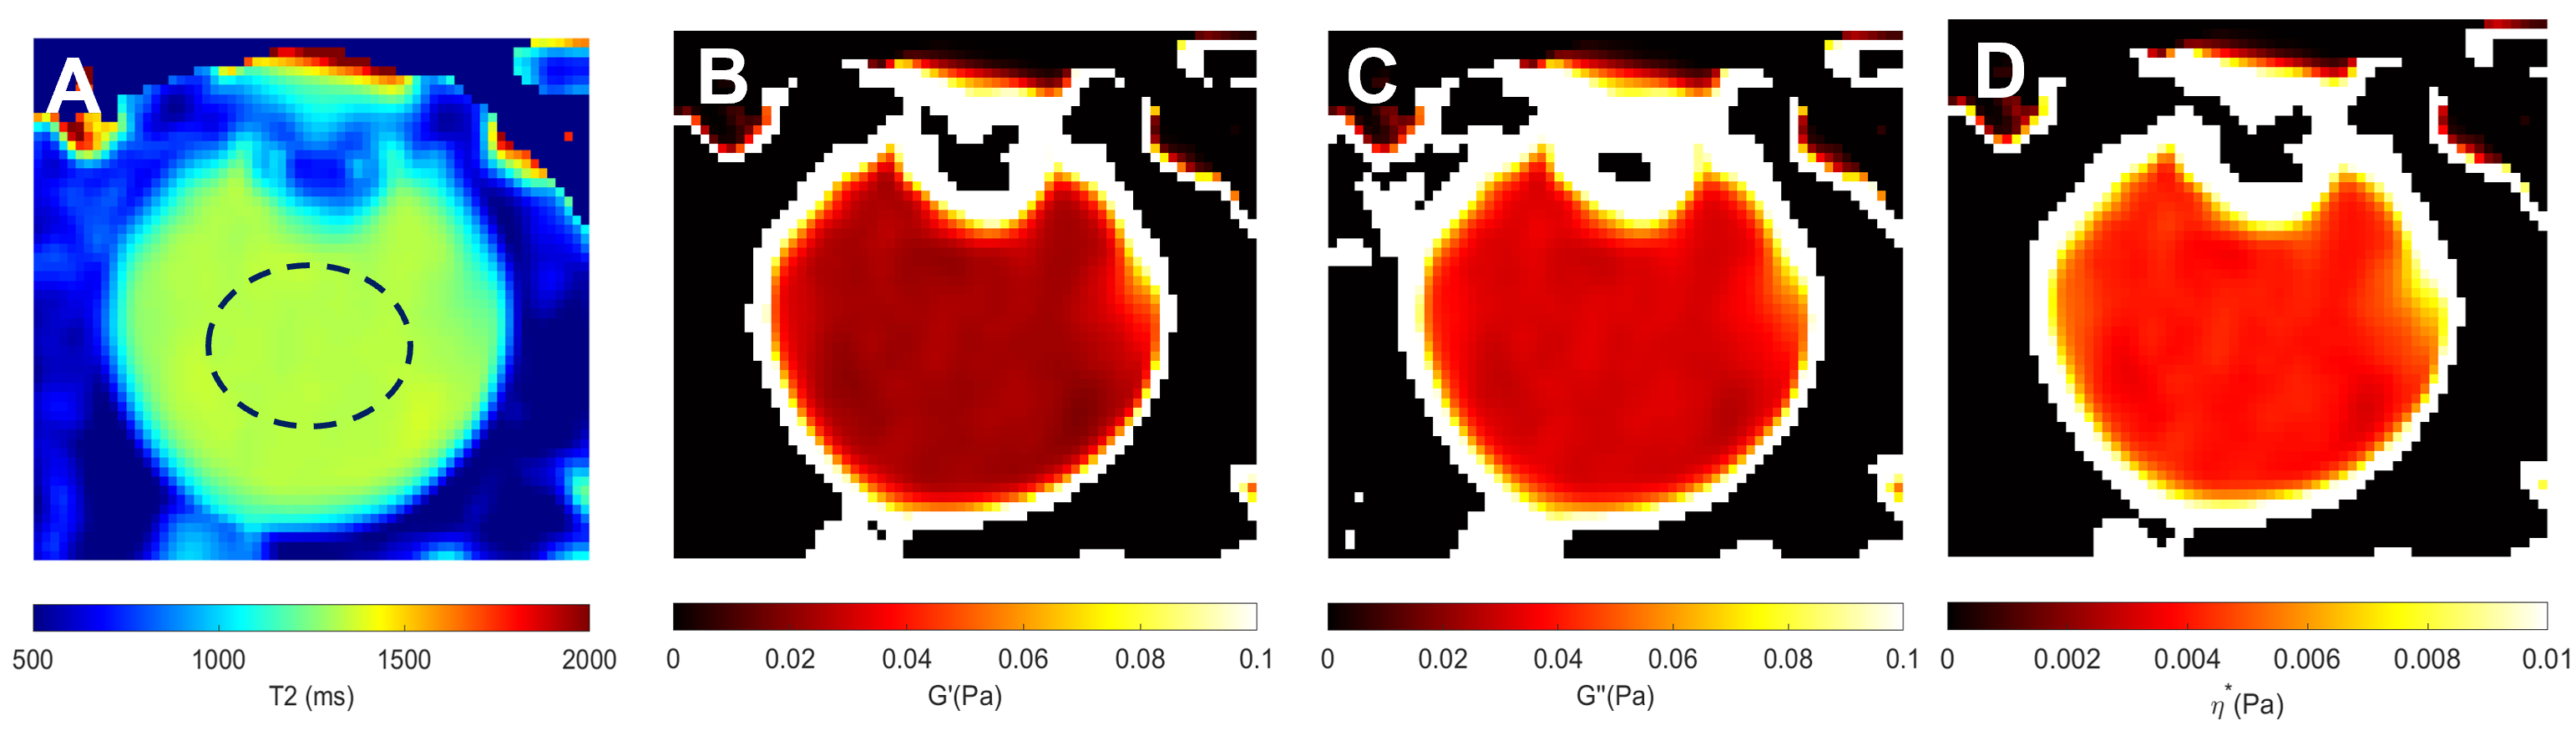
A cohort of old participants (N = 10, 70.5 ± 5.2 years) was recruited for this study. All participants were scanned using a 3T MRI (VIDA, Siemens) equipped with a 32-channel head coil (Siemens). All participants were instructed to focus on a fixation target to minimise eye movements3. T1 mapping utilised a turbo-spin echo (TSE) with inversion recovery at six different TIs (50, 860, 1880, 3240, 5340 and 10000 ms), with a constant TR of 16000 ms and TE of 8.6 ms. The T2 mapping utilised the same TSE with different TEs (175, 400, 650, 900, 1150, 1400 and 1630 ms) with a constant TR of 12000ms. All acquired images have a FOV of 160 × 160 mm, and a matrix size of 320 × 320. Parallel imaging (ipat = 2) was used to accelerate the acquisition. Acquired images were firstly co-registered and then post-processed using non-linear fitting to generate pixel-wise T1 and T2 mappings2,4. T1 (R1) maps were further converted to pO2 maps using a calibration curve established in samples with a mixture of oxygen and nitrogen (Fig 2B). T2 maps were converted to the fluid viscosity measurements2. These included the storage (G’) and loss (G’’) moduli that describe the stiffness and damping properties of the vitreous, respectively, and which can be combined to calculate the complex viscosity (ƞ*)3. A circular ROI was drawn on the central vitreous to measure the respective pO2 and viscosity measurements.Results
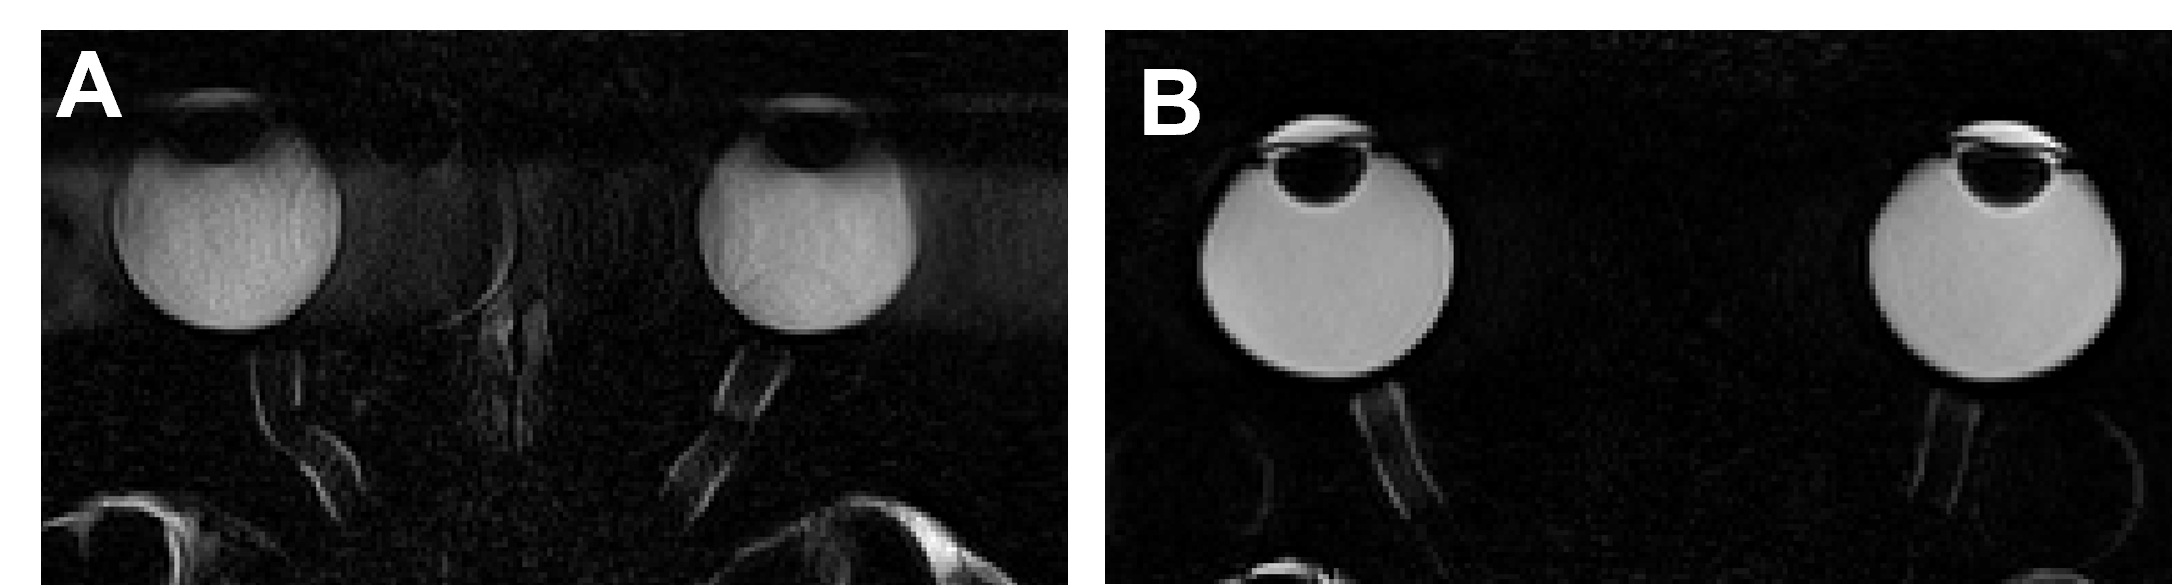
The use of a fixation target to minimise eye movement greatly improved image quality (Fig.1). A representative T1 map of the vitreous of a 71-years-old participant (Fig. 2A) was converted to a pO2 map (Fig. 2C) using a calibration curve (Fig. 2B). The pO2 was extracted from the central vitreous of the 10 participants recruited in this study was 22.9 ± 11.7 mmHg [mean ± std]. A T2 map from the same representative participant was used to calculate the fluid viscosity (G’, G’’ and ƞ*) maps (Fig 3). Mean values within ROI are G’= 0.03 ± 0.008 Pa, G’’ = 0.04 ± 0.01 Pa and ƞ* = 0.004 ± 0.002 Pa were obtained for the 10 participants in this study.Discussion
We have optimised non-invasive in vivo MRI-based relaxometry to obtain measurements of pO2 and fluid viscosity in the vitreous humour of human eyes on a cohort of 10 elderly patients. Our measured pO2 falls within the range of pO2 measured in patients during ocular surgery5, while it is the first time that vitreous viscosity measurements have been performed in vivo using MRI. In future work, we propose to apply these optimised protocols to study the effects of ageing on vitreous structure and function and the effect of removing the vitreous (vitrectomy).Acknowledgements
NIH grant, US (R01 EY 026911-01), Maurice and Phyllis Paykel Trust (MPPT) and Lotteries Health Research from New Zealand.References
1. Muir, E. R., Zhang, Y., San Emeterio Nateras, O., Peng, Q., & Duong, T. Q. (2013). Human vitreous: MR imaging of oxygen partial pressure. Radiology, 266(3), 905-911.
2. Thakur, S. S., Pan, X., Kumarasinghe, G. L., Yin, N., Pontré, B. P., Vaghefi, E., & Rupenthal, I. D. (2020). Relationship between rheological properties and transverse relaxation time (T2) of artificial and porcine vitreous humour. Experimental Eye Research, 194, 108006.
3. Thaler, L., Schütz, A. C., Goodale, M. A., & Gegenfurtner, K. R. (2013). What is the best fixation target? The effect of target shape on stability of fixational eye movements. Vision research, 76, 31-42.
4. Barral, J. K., Gudmundson, E., Stikov, N., Etezadi‐Amoli, M., Stoica, P., & Nishimura, D. G. (2010). A robust methodology for in vivo T1 mapping. Magnetic resonance in medicine, 64(4), 1057-1067.
5.Sakaue, H., Tsukahara, Y., Negi, A., Ogino, N., & Honda, Y. (1989). Measurement of vitreous oxygen tension in human eyes. Japanese journal of ophthalmology, 33(2), 199-203.
Figures