1353
Oxygen-enhanced and glucose-enhanced MRI for dual mapping of hypoxia and glucose uptake in tumours at high spatial resolution1Division of Informatics, Imaging and Data Sciences, Faculty of Biology, Medicine and Health, University of Manchester, UK, Manchester, United Kingdom, 2Geoffrey Jefferson Brain Research Centre, University of Manchester, Manchester Academic Health Science Centre, UK, Manchester, United Kingdom, 3Nanomedicine Lab, Faculty of Biology, Medicine and Health and National Graphene Institute, University of Manchester, UK, Manchester, United Kingdom, 4Division of Pharmacy and Optometry, School of Health Sciences, Faculty of Biology, Medicine and Health, University of Manchester, UK, Manchester, United Kingdom, 5Department of Radiology, University of Pittsburgh, Pittsburgh, Pennsylvania, USA, Pittsburgh, PA, United States, 6Catalan Institute of Nanoscience and Nanotechnology (ICN2), UAB Campus Bellaterra, Barcelona, Spain, Barcelona, Spain, 7Division of Cancer Sciences, School of Health Sciences, Faculty of Biology, Medicine and Health, University of Manchester, UK, Manchester, United Kingdom
Synopsis
Keywords: Multi-Contrast, Cancer
We have developed a non-invasive imaging protocol for dual assessment of hypoxia and glucose uptake in tumours using oxygen-enhanced MRI and glucoCESL MRI, and test feasibility in GL261 glioblastoma and MOC2 head and neck cancer mouse models. GL261 tumours had a lower non-perfused fraction (p = 0.0015), a trend to higher glucose enhancing fraction (p = 0.07) and a smaller hypoxic glucose refractory fraction (p= 0.021). The normoxic glucose enhancing fraction was significantly larger than the normoxic glucose refractory fraction (p < 0.0001) in both models. These imaging tools will be used to assess the effects of hypoxia modifying drugs.Introduction
Tumour hypoxia and metabolic reprogramming are hallmarks of cancer and contribute towards treatment resistance1,2. Substantial inter and intratumoural heterogeneity exists in these properties, contributing to varied treatment response between patients and pose challenges for individualised treatment planning.Clinical trials are evaluating the role of evophosphamide3 and atovoquone4 for ameliorating treatment resistance in glioblastoma arising from hypoxia and aberrant metabolism. It is likely that drugs targeting hypoxia will alter metabolism and vice versa. Imaging readouts of hypoxia and metabolism could therefore provide complementary information on drug effect in these types of trial. There already exist methods for hypoxia imaging5,6 and imaging of glucose kinetics7,8 using MRI. In this study, we combine two established approaches: oxygen-enhanced MRI (OE-MRI) and glucoCESL MRI, for mapping hypoxia and glucose kinetics respectively, and test feasibility in GL261 glioblastoma and MOC2 head and neck cancer mouse models.
Methods
GL261 tumoursMale C57/BL6 mice (n = 4) were implanted with 5x10⁴ GL261 cells into the right striatum. Mice were imaged on day 14 following implantation.
MOC2 tumours
Female C57/BL6 mice (n = 4) were implanted with 1×10⁶ MOC2 cells on the back. Mice were imaged when tumours had reached ~ 400-600 mm3 as measured using callipers.
MRI
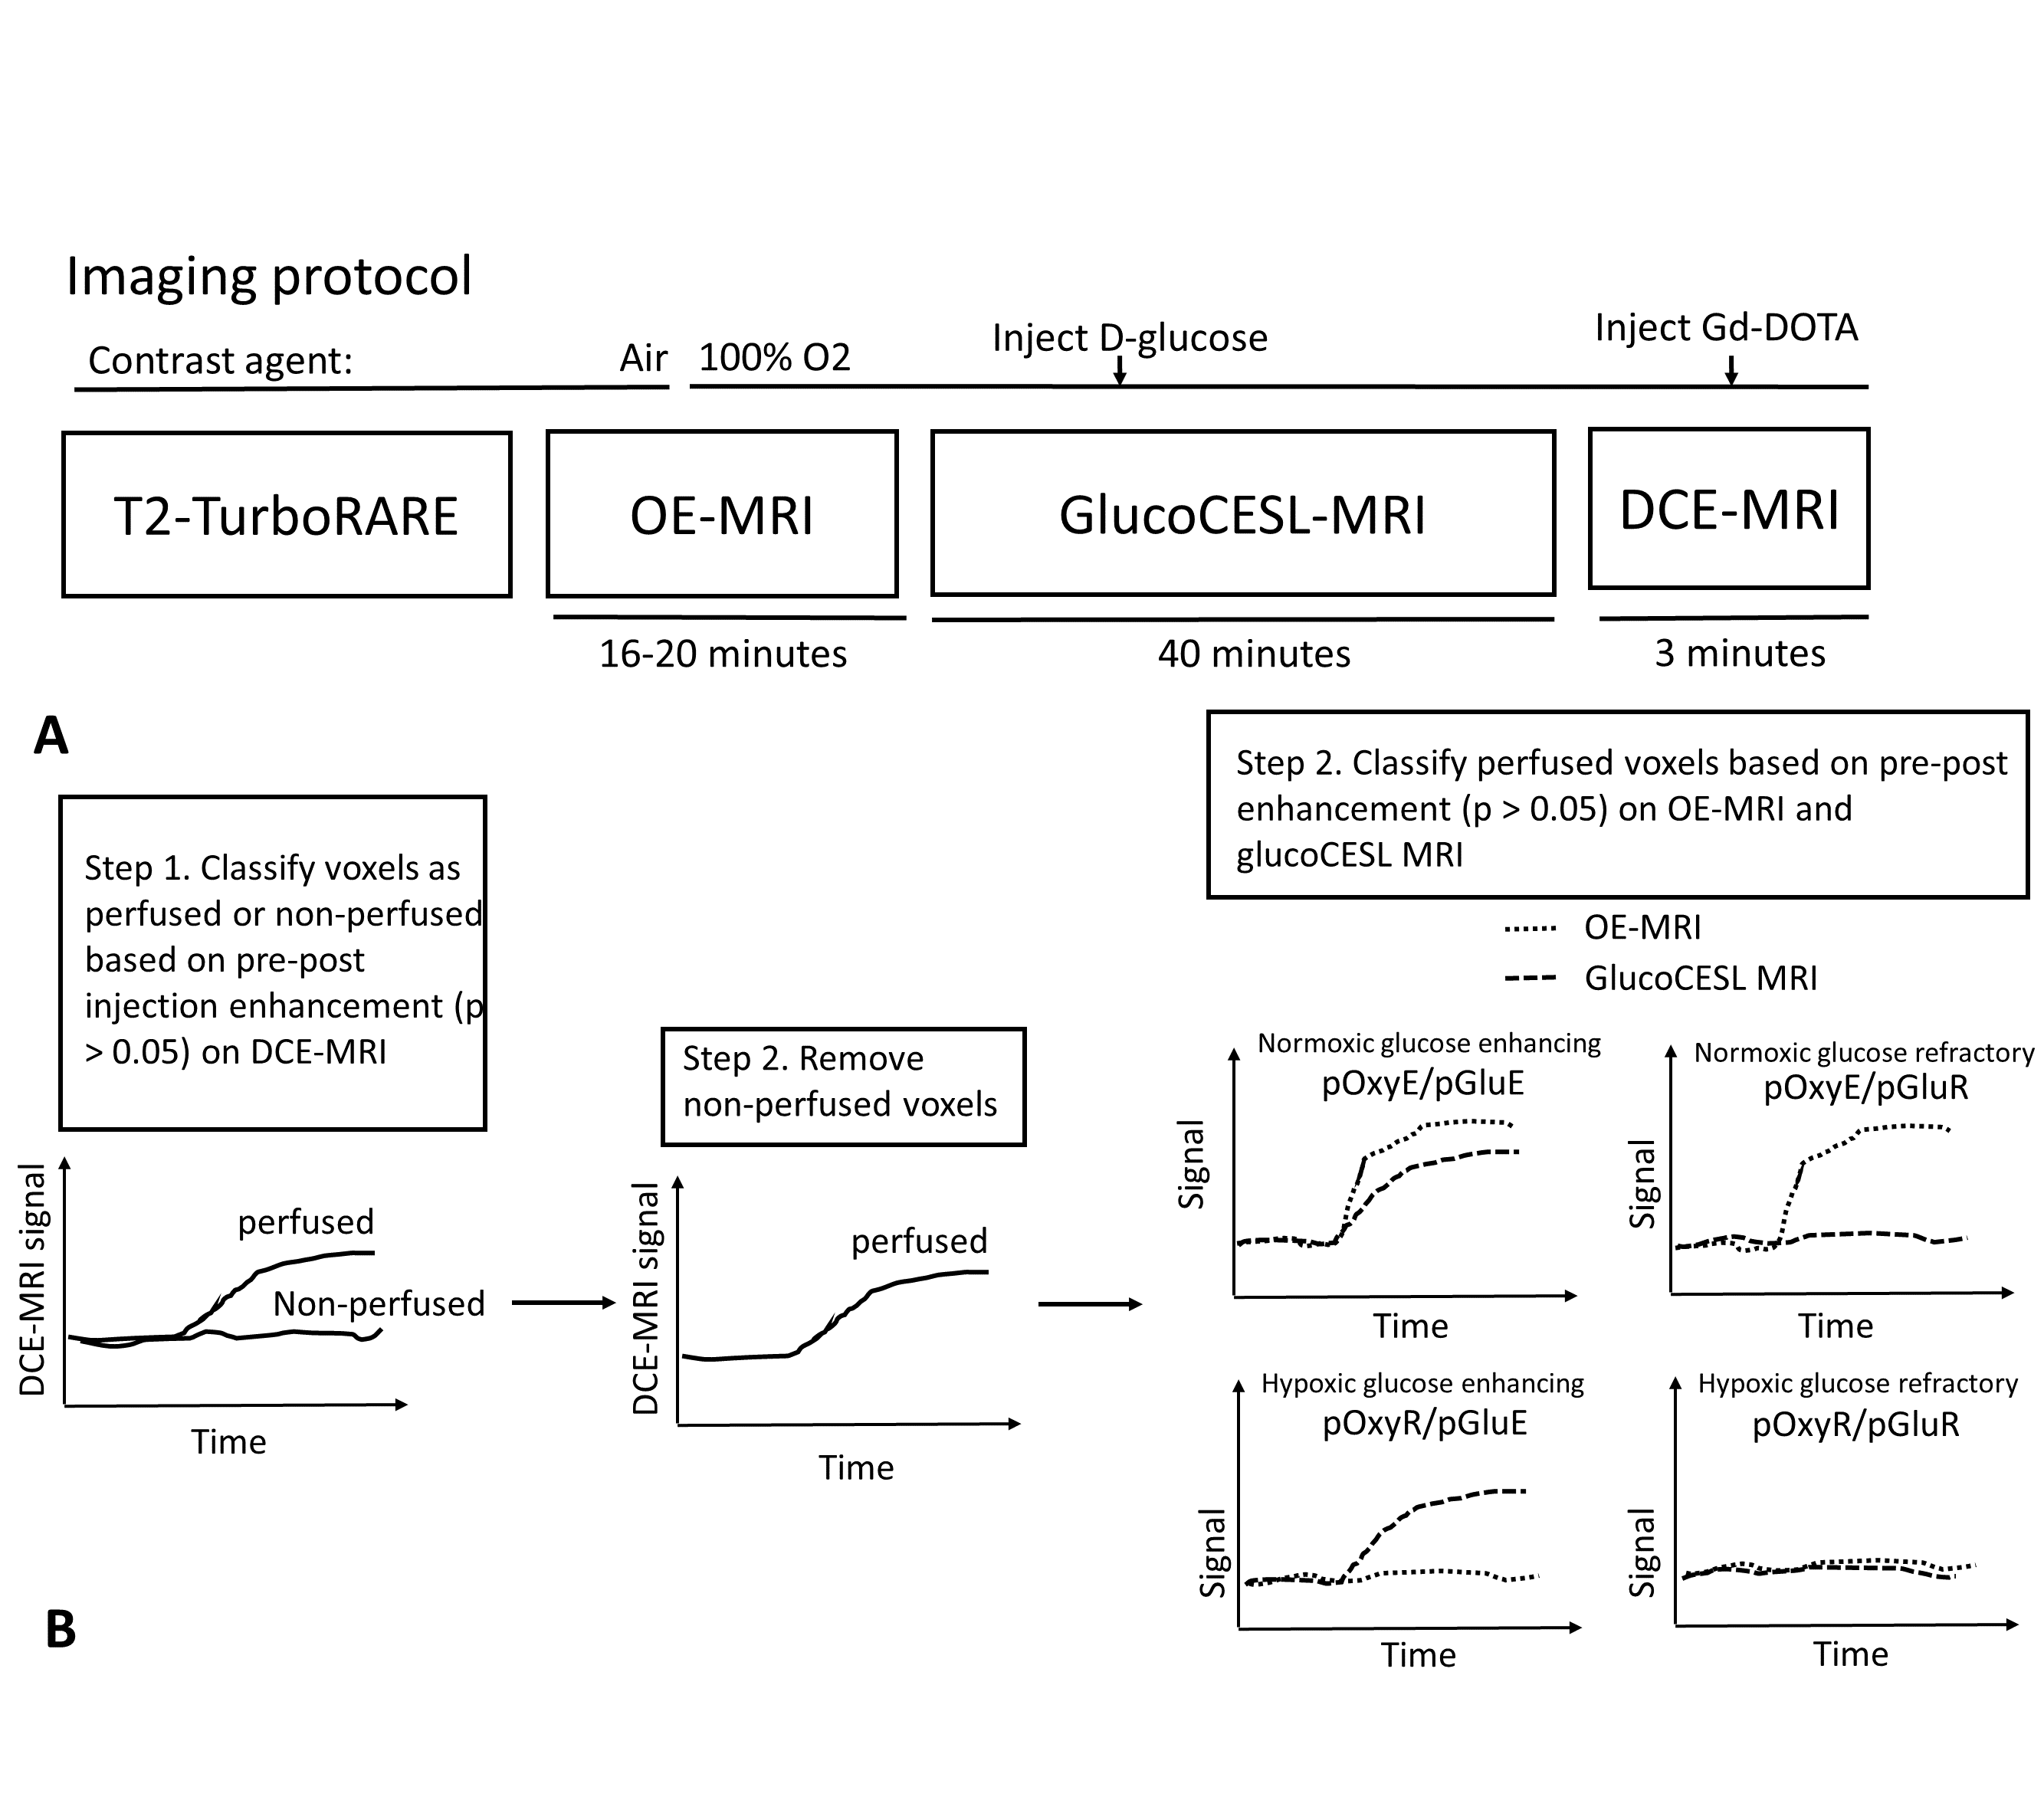
Animals were scanned using T2-TurboRARE, oxygen-enhanced MRI (OE-MRI), glucose-enhanced MRI (glucoCESL MRI) and dynamic-contrast enhanced MRI (DCE-MRI) (Figure 1A). OE-MRI scans were acquired using a dynamic MPRAGE acquisition (GL261 tumours: TR/TE = 4000/3.10 ms, TI = 1500 ms, voxel size = 0.156 x 0.156 x 0.5 mm, 30 slices; MOC2 tumours: TR/TE = 6000/3.10 ms, TI = 1500 ms voxel size = 0.23 x 0.23 x 0.5 mm, 30 slices) with total duration of 16 minutes (GL261) or 20 minutes (MOC2). The anaesthetic carrier gas was switched from medical air to 100% O2 midway through the OE-MRI scan, and kept at 100% O2 for the remainder of the scanning session. GlucoCESL MRI data were acquired using adiabatic spin-lock preparation (ω1 = 500 Hz) and SE-EPI readout (FOV = 20 x 20 mm, 1 slice (GL261) or 2 slices (MOC2) with thickness 1mm, matrix size = 64 x 64, TR/TE = 4000/27.1 ms). Images were acquired in blocks consisting of 1 TSL = 0 ms image followed by three TSL = 50 ms images, providing an R1,ρ estimate every 16 seconds over a total scan duration of 40 minutes. GlucoCESL slices were placed through the central portion of the tumour and matched to the location of OE-MRI slices. A bolus of glucose (1g/kg) was injected manually after 10 minutes of baseline images. Following glucoCESL MRI, DCE-MRI was performed to determine perfused voxels. Dynamic SPGR images were acquired for 2 minutes 44 seconds, with 0.1 mmol/kg Gd-DOTA (Dotarem, Guerbet) injected after 60 seconds at 1mL/min. Voxel size and FOV of DCE-MRI and OE-MRI scans were matched.
Image processing
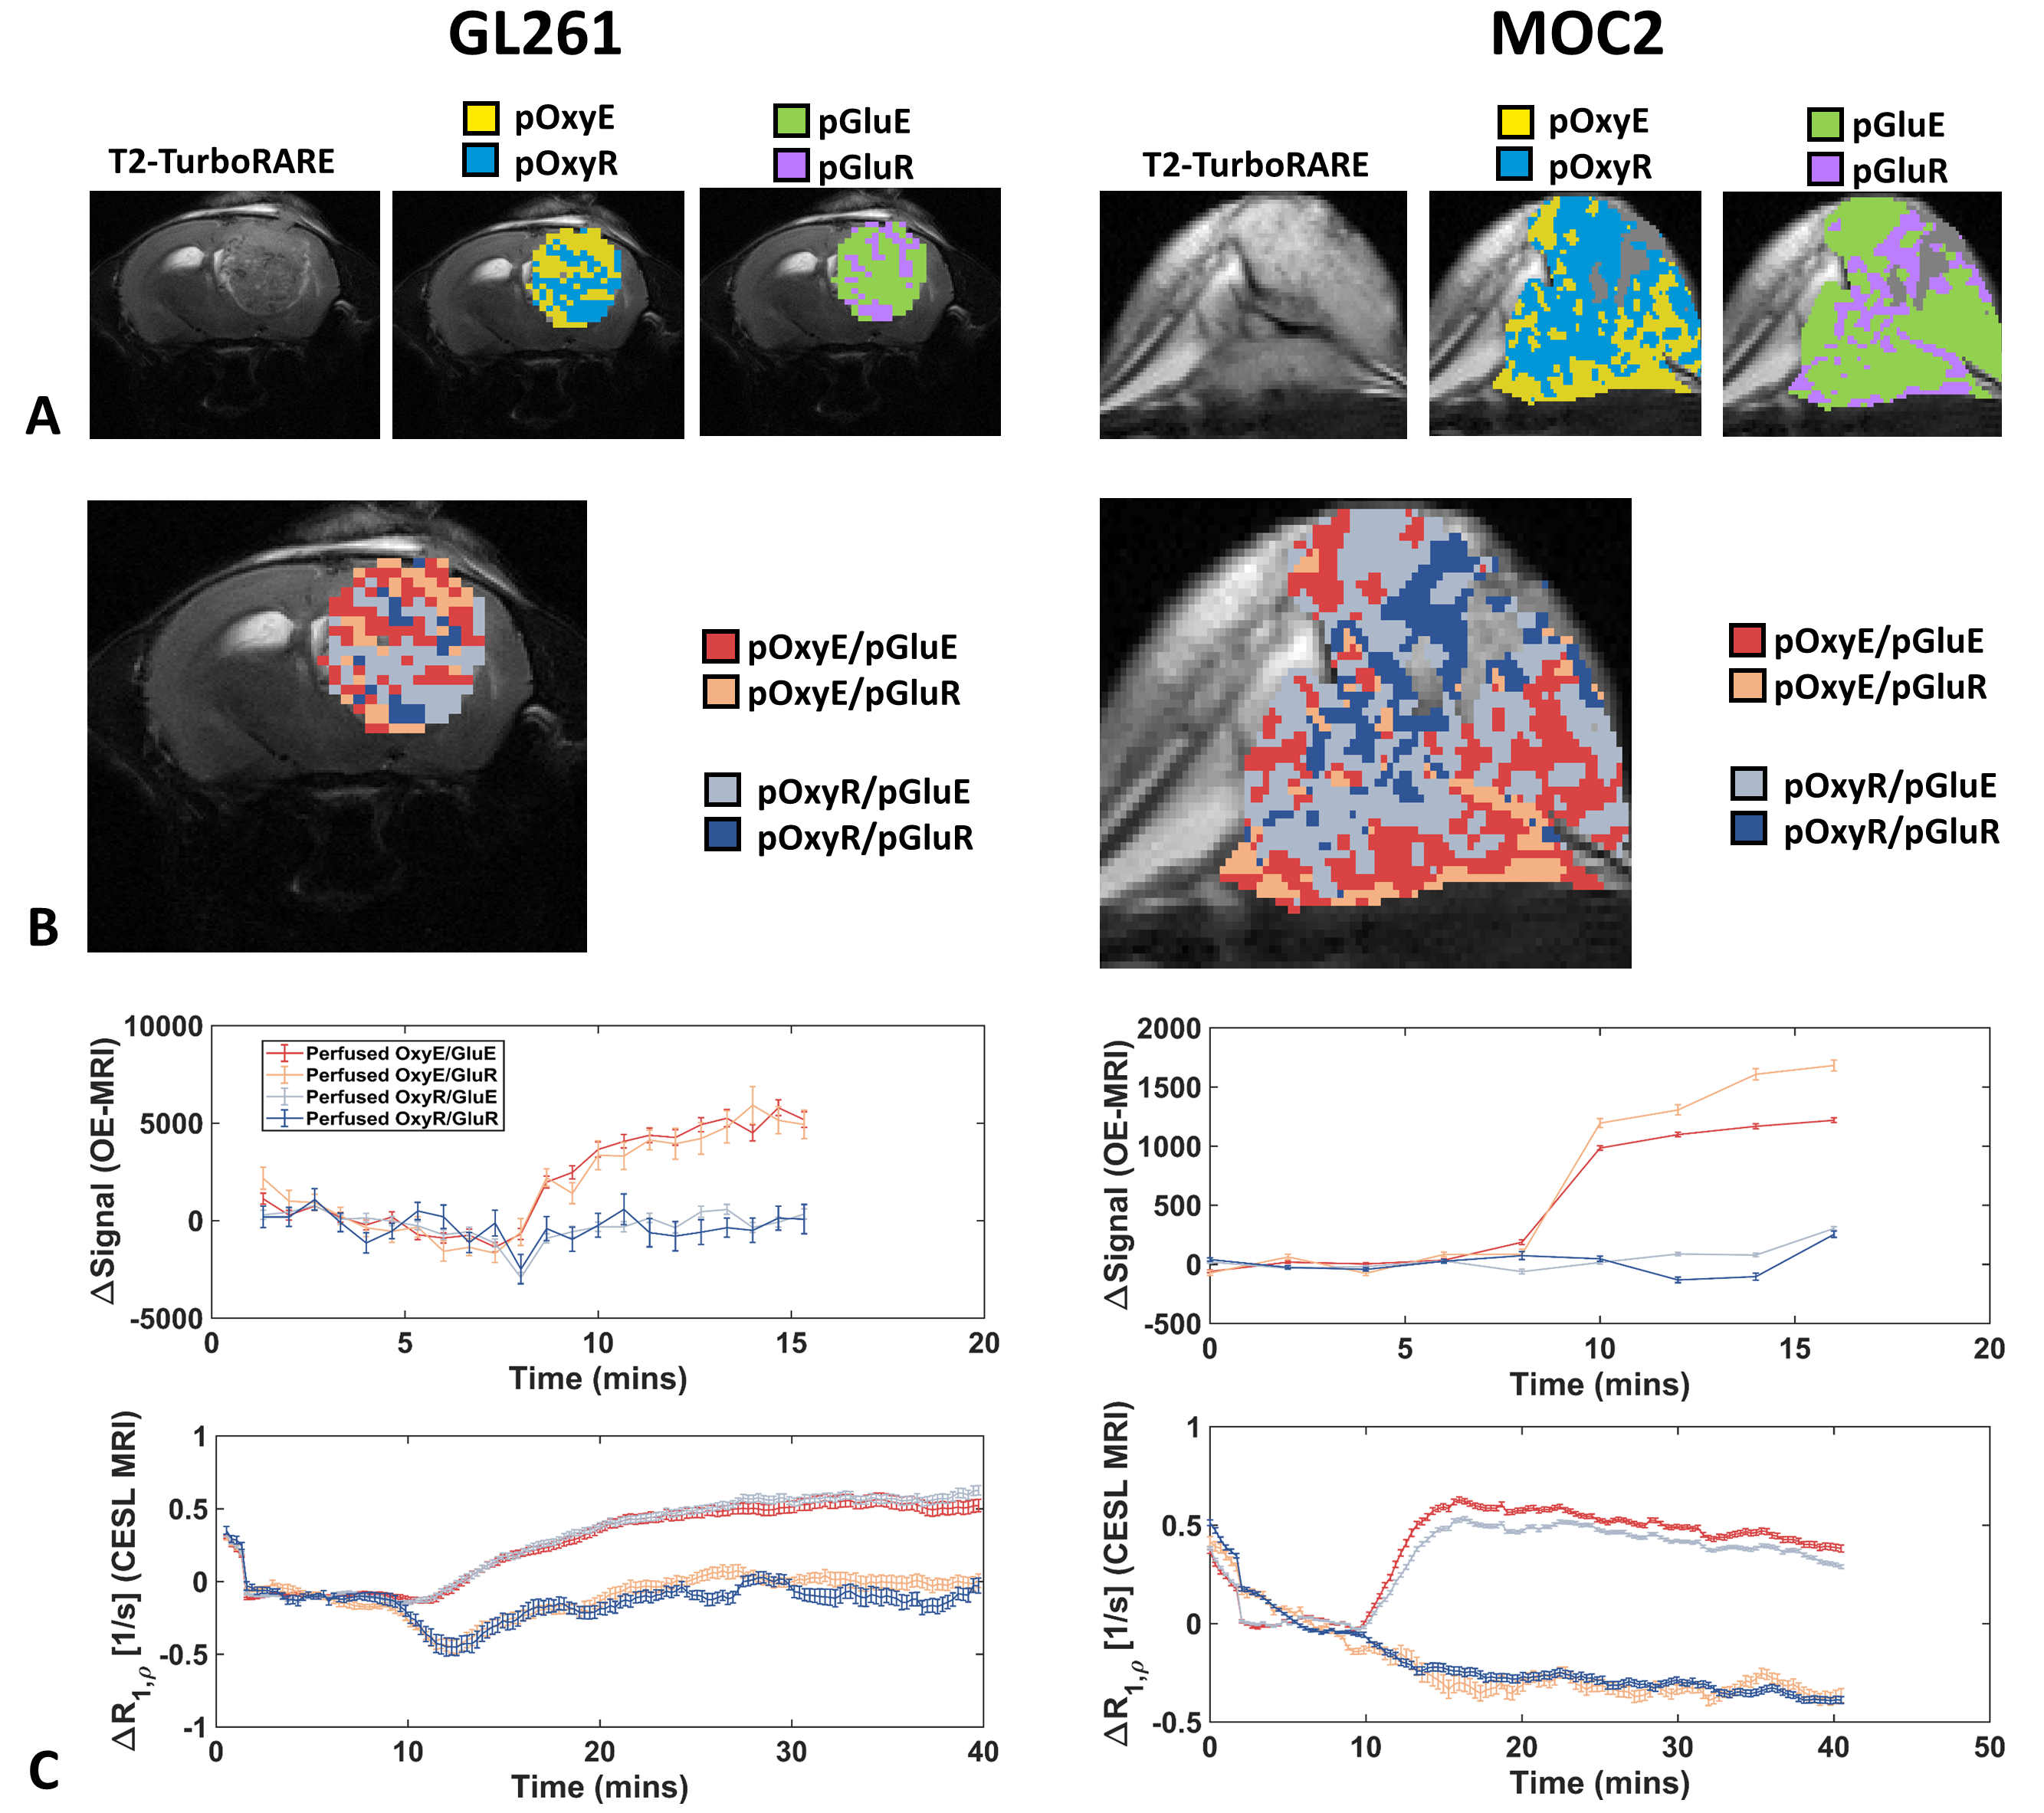
Deformable registration was applied in Elastix (version 5.0.1) to correct geometric distortions in glucoCESL MRI images. Voxels with significant post-contrast enhancement (p < 0.05) in DCE-MRI scans were classified as perfused. From the perfused voxels, tissue was further split into 4 sub-regions based on post-contrast enhancement on OE-MRI (p < 0.05) and glucoCESL MRI (p < 0.05) (Figure 1B). Regions were defined as normoxic glucose enhancing (pOxyE/pGluE), normoxic glucose refractory (pOxyE/pGluR), hypoxic glucose enhancing (pOxyR/pGluE) or hypoxic glucose refractory (pOxyR/pGluR). Unpaired t-tests were performed to compare sub-region fractions between GL261 and MOC2 tumours and to compare the sizes of pOxyE/pGluE with pOxyE/pGluR, and pOxyR/pGluE with pOxyR/pGluR.
Results
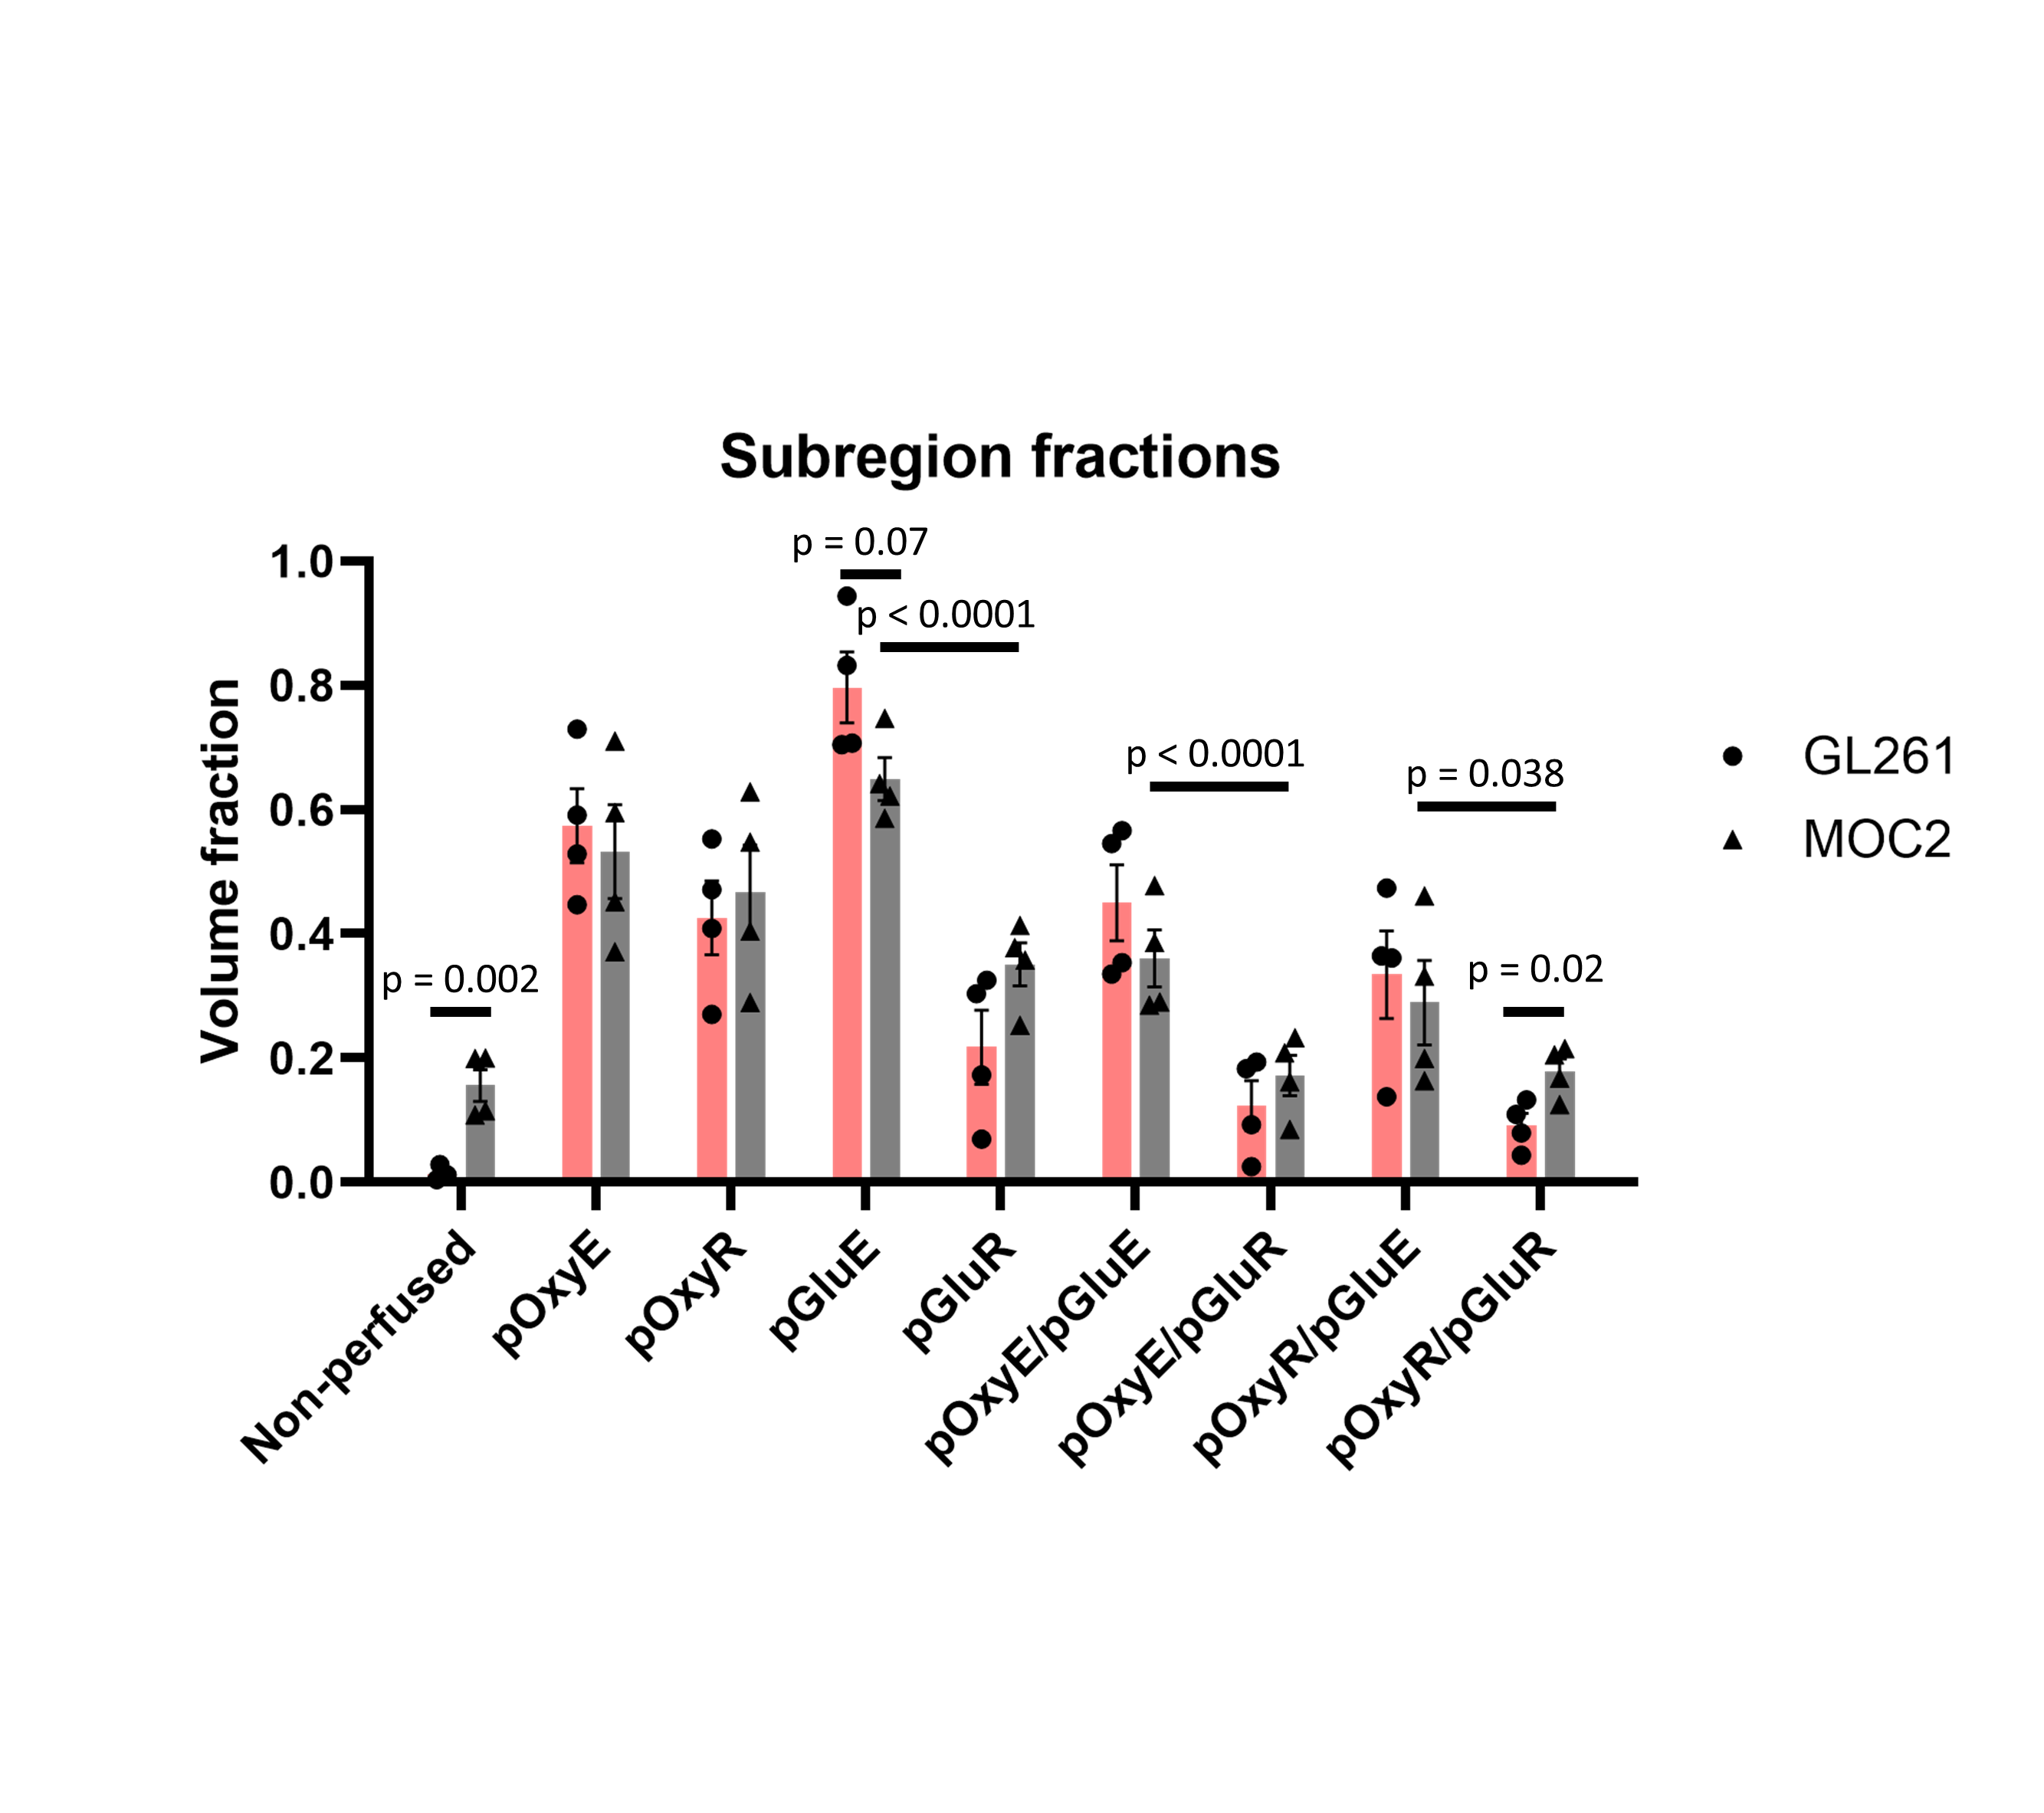
Sub-region maps from representative GL261 and MOC2 tumours are shown in Figure 2A-B. In both models, the kinetics of glucose uptake was consistent in normoxic and hypoxic sub-regions (Figure 2C). GL261 tumours had a lower non-perfused fraction (Figure3; 1.4% for GL261 vs 16% for MOC2; p = 0.0015). There was no difference in pOxyR (p = 0.67), pOxyE (p = 0.67) or pGluR fractions (p = 0.10). GL261 tumours had a trend to higher pGluE fraction (80% vs 65%; p = 0.07). GL261 tumours had smaller pOxyR/pGluR (9% vs 18%; p= 0.021). There was no difference in the size of subregion fractions pOxyE/pGluE, pOxyE/pGluR, pOxyR/pGluE between models. Averaged across model, the normoxic fraction with glucose enhancement was significantly higher than the normoxic fraction without glucose uptake (pOxyE/pGluE vs pOxyE/pGluR; p < 0.0001). To a lesser degree, hypoxic subregions with glucose enhancement were larger than hypoxic subregions without glucose enhancement (pOxyR/pGluE vs pOxyR/pGluR; p < 0.02).Discussion
We have demonstrated feasibility of combined in vivo mapping of hypoxia and glucose uptake within the same tumour and scanning session using MRI. The normoxic glucose enhancing fraction was significantly larger than the normoxic glucose refractory fraction (p < 0.0001) in both models, possibly reflecting the high perfusion status of oxygenated tissue.The approach for mapping glucose uptake used a 1-2 slices, meaning that glucose sub-regions could only be evaluated on a fraction of the total tumour volume. Furthermore, glucoCESL images used an EPI readout, creating issues when co-aligning glucoCESL and OE-MRI scans. Future work will aim to incorporate multi-slice imaging of glucose uptake with a readout that suffers less from geometric distortion.
Acknowledgements
Cancer Research UK Advanced Clinician Scientist Fellowship C19221/A22746 (to JOC) and Cancer Research UK RadNet Manchester [C1994/A28701].References
[1] Schwartz G. Ueber Desensibilisierung gegen rontgen und radiumstrahlen. Munchener Medizinische Wochenschrift. 1909;24:1-2.
[2] Hanahan D, Weinberg RA. Hallmarks of cancer: the next generation. cell. 2011 Mar 4;144(5):646-74.
[3] Brenner AJ, Floyd J, Fichtel L, Michalek J, Kanakia KP, Huang S, Reardon D, Wen PY, Lee EQ. Phase 2 trial of hypoxia activated evofosfamide (TH302) for treatment of recurrent bevacizumab-refractory glioblastoma. Scientific reports. 2021 Jan 27;11(1):1-6.
[4] Mudassar F, Shen H, O’Neill G, Hau E. Targeting tumor hypoxia and mitochondrial metabolism with anti-parasitic drugs to improve radiation response in high-grade gliomas. Journal of Experimental & Clinical Cancer Research. 2020 Dec;39(1):1-7.
[5] O'Connor JP, Boult JK, Jamin Y, Babur M, Finegan KG, Williams KJ, Little RA, Jackson A, Parker GJ, Reynolds AR, Waterton JC. Oxygen-Enhanced MRI Accurately Identifies, Quantifies, and Maps Tumor Hypoxia in Preclinical Cancer ModelsImaging Tumor Hypoxia In Vivo with Oxygen-Enhanced MRI. Cancer research. 2016 Feb 15;76(4):787-95.
[6] Chitneni SK, Palmer GM, Zalutsky MR, Dewhirst MW. Molecular imaging of hypoxia. Journal of nuclear medicine. 2011 Feb 1;52(2):165-8.
[7] Dickie BR, Jin T, Wang P, Hinz R, Harris W, Boutin H, Parker GJ, Parkes LM, Matthews JC. Quantitative kinetic modelling and mapping of cerebral glucose transport and metabolism using glucoCESL MRI. Journal of Cerebral Blood Flow & Metabolism. 2022 Jun 23:0271678X221108841.
[8] De Feyter HM, Behar KL, Corbin ZA, Fulbright RK, Brown PB, McIntyre S, Nixon TW, Rothman DL, de Graaf RA. Deuterium metabolic imaging (DMI) for MRI-based 3D mapping of metabolism in vivo. Science advances. 2018 Aug 22;4(8):eaat7314.
Figures