1351
Delta-relaxometry with contrast-enhanced MR Fingerprinting: phantom validation and application to tumor imaging1Department of Radiology, Case Western Reserve University and University Hospitals Cleveland Medical Center, Cleveland, OH, United States, 2Department of Biomedical Engineering, Case Western Reserve University, Cleveland, OH, United States, 3Case Western Reserve University School of Medicine, Cleveland, OH, United States, 4Seidman Cancer Center and Case Comprehensive Cancer Center,, Cleveland, OH, United States
Synopsis
Keywords: Relaxometry, MR Fingerprinting, Delta Relaxometry; Tumor Imaging
The influence of hemodynamics and contrast concentration can be eliminated with ratios between delta-relaxometry in contrast-enhanced MR Fingerprinting (MRF). This delta ratio can be used to characterize the in vivo contrast-specific tissue response, beyond the conventional T1/T2 shortening effect. In this abstract, we: 1) developed a MRF-based strategy to image the concentration-independent, contrast-specific tissue response using delta-relaxometry; 2) validated reproducibility and linearity of delta-relaxometry in phantom experiments; 3) reported the novel Delta-relaxometry image contrast distinct from current clinical image contrasts; and 4) illustrated the sensitivity of delta-relaxometry in brain tumor characterization and classification.INTRODUCTION
Hemodynamic information in contrast-enhanced MRI is concentration-dependent [1]. The influence of contrast concentration can be eliminated with ratios between delta transverse and longitudinal relaxivity, when the contrast-agent concentration and relaxivity changes are linear [2, 3]. This ratio has been used for contrast agent optimization [2], and could potentially be used to map in-vivo tissue response to specific contrast agent using MR Fingerprinting.Based on these concepts, we aimed to 1) develop MRF based ΔR1/ΔR2 and ΔT1/ΔT2 delta-relaxometry metrics; 2) validate the reproducibility and linearity assumption of delta-relaxometry; 3) report unique delta-relaxometry image contrast of tumor compared to clinical images; and 4) assess role of delta-relaxometry in brain tumor characterization.
METHODS
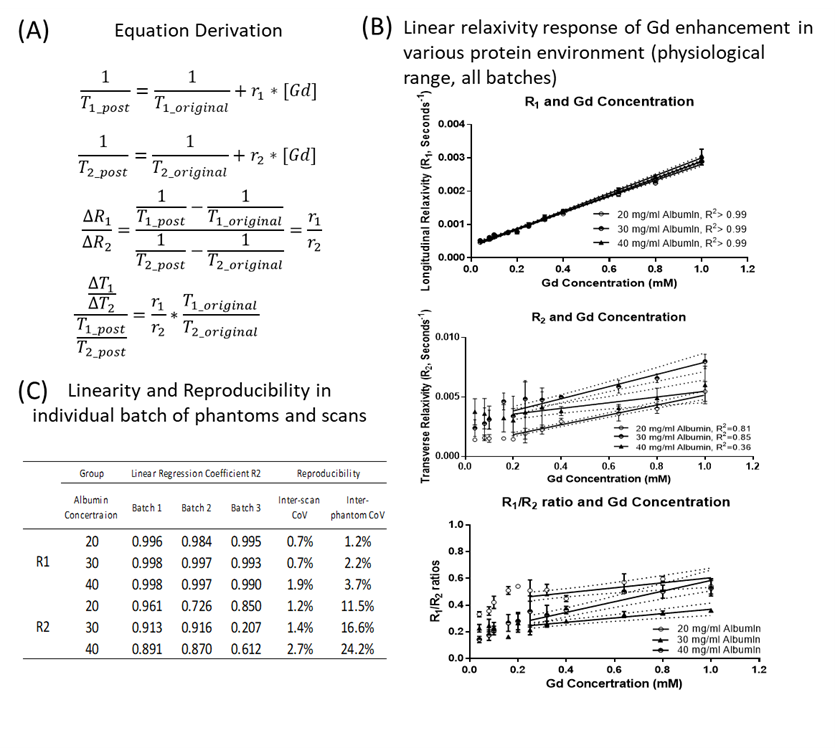
Theory:Delta-relaxometry metrics (ΔR1/ΔR2 ratio, normalized ΔT1/ΔT2 ratio) were derived using existing relaxation enhancement theories of Gadolinium [2, 3]. These Delta-relaxometry metrics were function of contrast-specific relaxivities ratio (r1/r2), influenced by pH and protein concentration [2, 4].
Phantom Validation:
To assess linearity of gadolinium concentration versus relatxivity, phantoms with physiological range of T1 (200 – 2500 ms), T2 (50 -200 ms) and protein concentration (20, 30, 40 mg/dl Bovine Serum Albumin) were constructed. Eleven gadolinium concentrations (from 0.04 mM to 1 mM; Dotarem, Guerbert) were added into Tris-buffered saline at three albumin concentrations ( pH = 7.4). Three batches were made for each protein concentration for reproducibility purposes.
The phantoms were scanned within 1 hour after construction to minimize albumin degradation (Siemens MAGNETOM Vida 3.0T, 20-channel head coil, MRF protocol as in reference [5]). Two separate and sequential sessions were acquired to evaluate acquisition reproducibility.
In-vivo Experiments:
Pre-operative MRF T1 and T2 maps, before and after Gadolinium injection, were previously acquired as part of an IRB approved cohort of glioblastomas (GB, n = 15) and metastases (METs, n =14). Post-contrast MRF were acquired ~ 5 minutes after contrast injection. Additional details of MRF acquisition are in reference[4].
Data Analyses:
For phantoms, volumetric regions of interest (ROI) were used for measurements. Reproducibility of R1 and R2 were evaluated with coefficient of variation between phantom batches (inter-phantom CoV) and imaging sessions (inter-session CoV). Linearity of gadolinium effect on observed R1 and R2 was quantified using coefficient of determination (R2) for each batch. Consistency of linearity in different Gd concentration was visualized in R1/R2 ratio plot for all phantom batches (Figure 1B).
For patient data, post-contrast MRF maps were skull-striped and co-registered with pre-contrast MRF non-linearly with FSL in the native image space (1.2mm x 1.2mm x 3.0mm(slice). Tumor regions were automatically segmented from co-registered clinical images using the DeepMedic algorithm [6], producing Enhancing tumor (ET), and peritumoral edema (ED) regions.
ROI-mean values of Delta-relaxometry metrics were compared using paired T-test for ET and ED regions in Metastases vs Glioblastoma. Voxel-wise ΔR1/ΔR2 (Log transformed, to normalize the kurtosis ) were compared using an unpaired two-tailed T-test with Bonferroni correction, to compare the distribution of delta-relaxometry in metastasis and glioblastomas. All analyses were performed on per-patient and group levels.
RESULTS
Theory and Validation:Derivations showes that delta-relaxometry are reflective of contrast-agent specific relaxivity, and independent of contrast agent concentration (Figure 1A). For Gd concentrations between 0.32 – 1.0 mM, Linear changes of R1 and R2 were observed (Figure 1B). This linear range fell in the physiological range during the venous phase of Gd injection (~1mM) [7]. Although a considerable inter-batch R2 variation existed, good linearity (R2 > 0.8) within batches was observed at albumin concentrations of 20 and 30 mg/dl (Figure 1C). At very low gadolinium concentrations (0.04 – 0.2 mM), T2 prolonging effect was observed, in agreement with prior literature[8].
In-vivo Application:
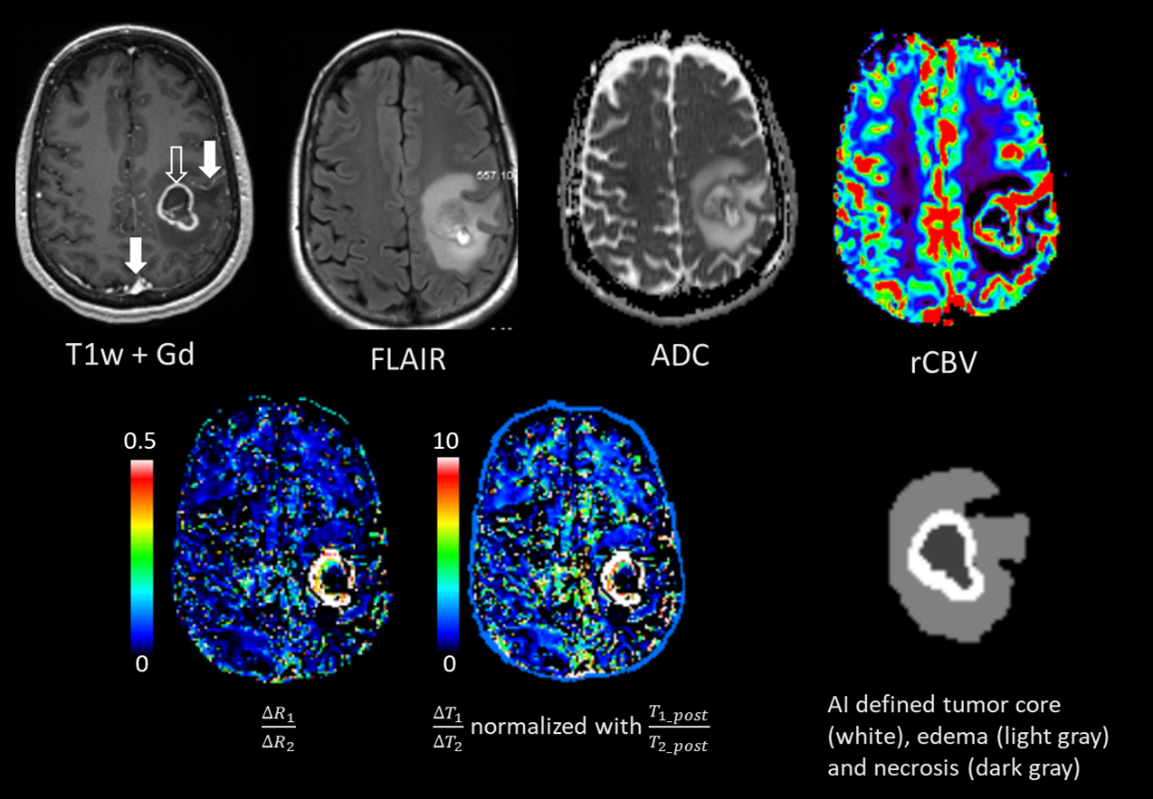
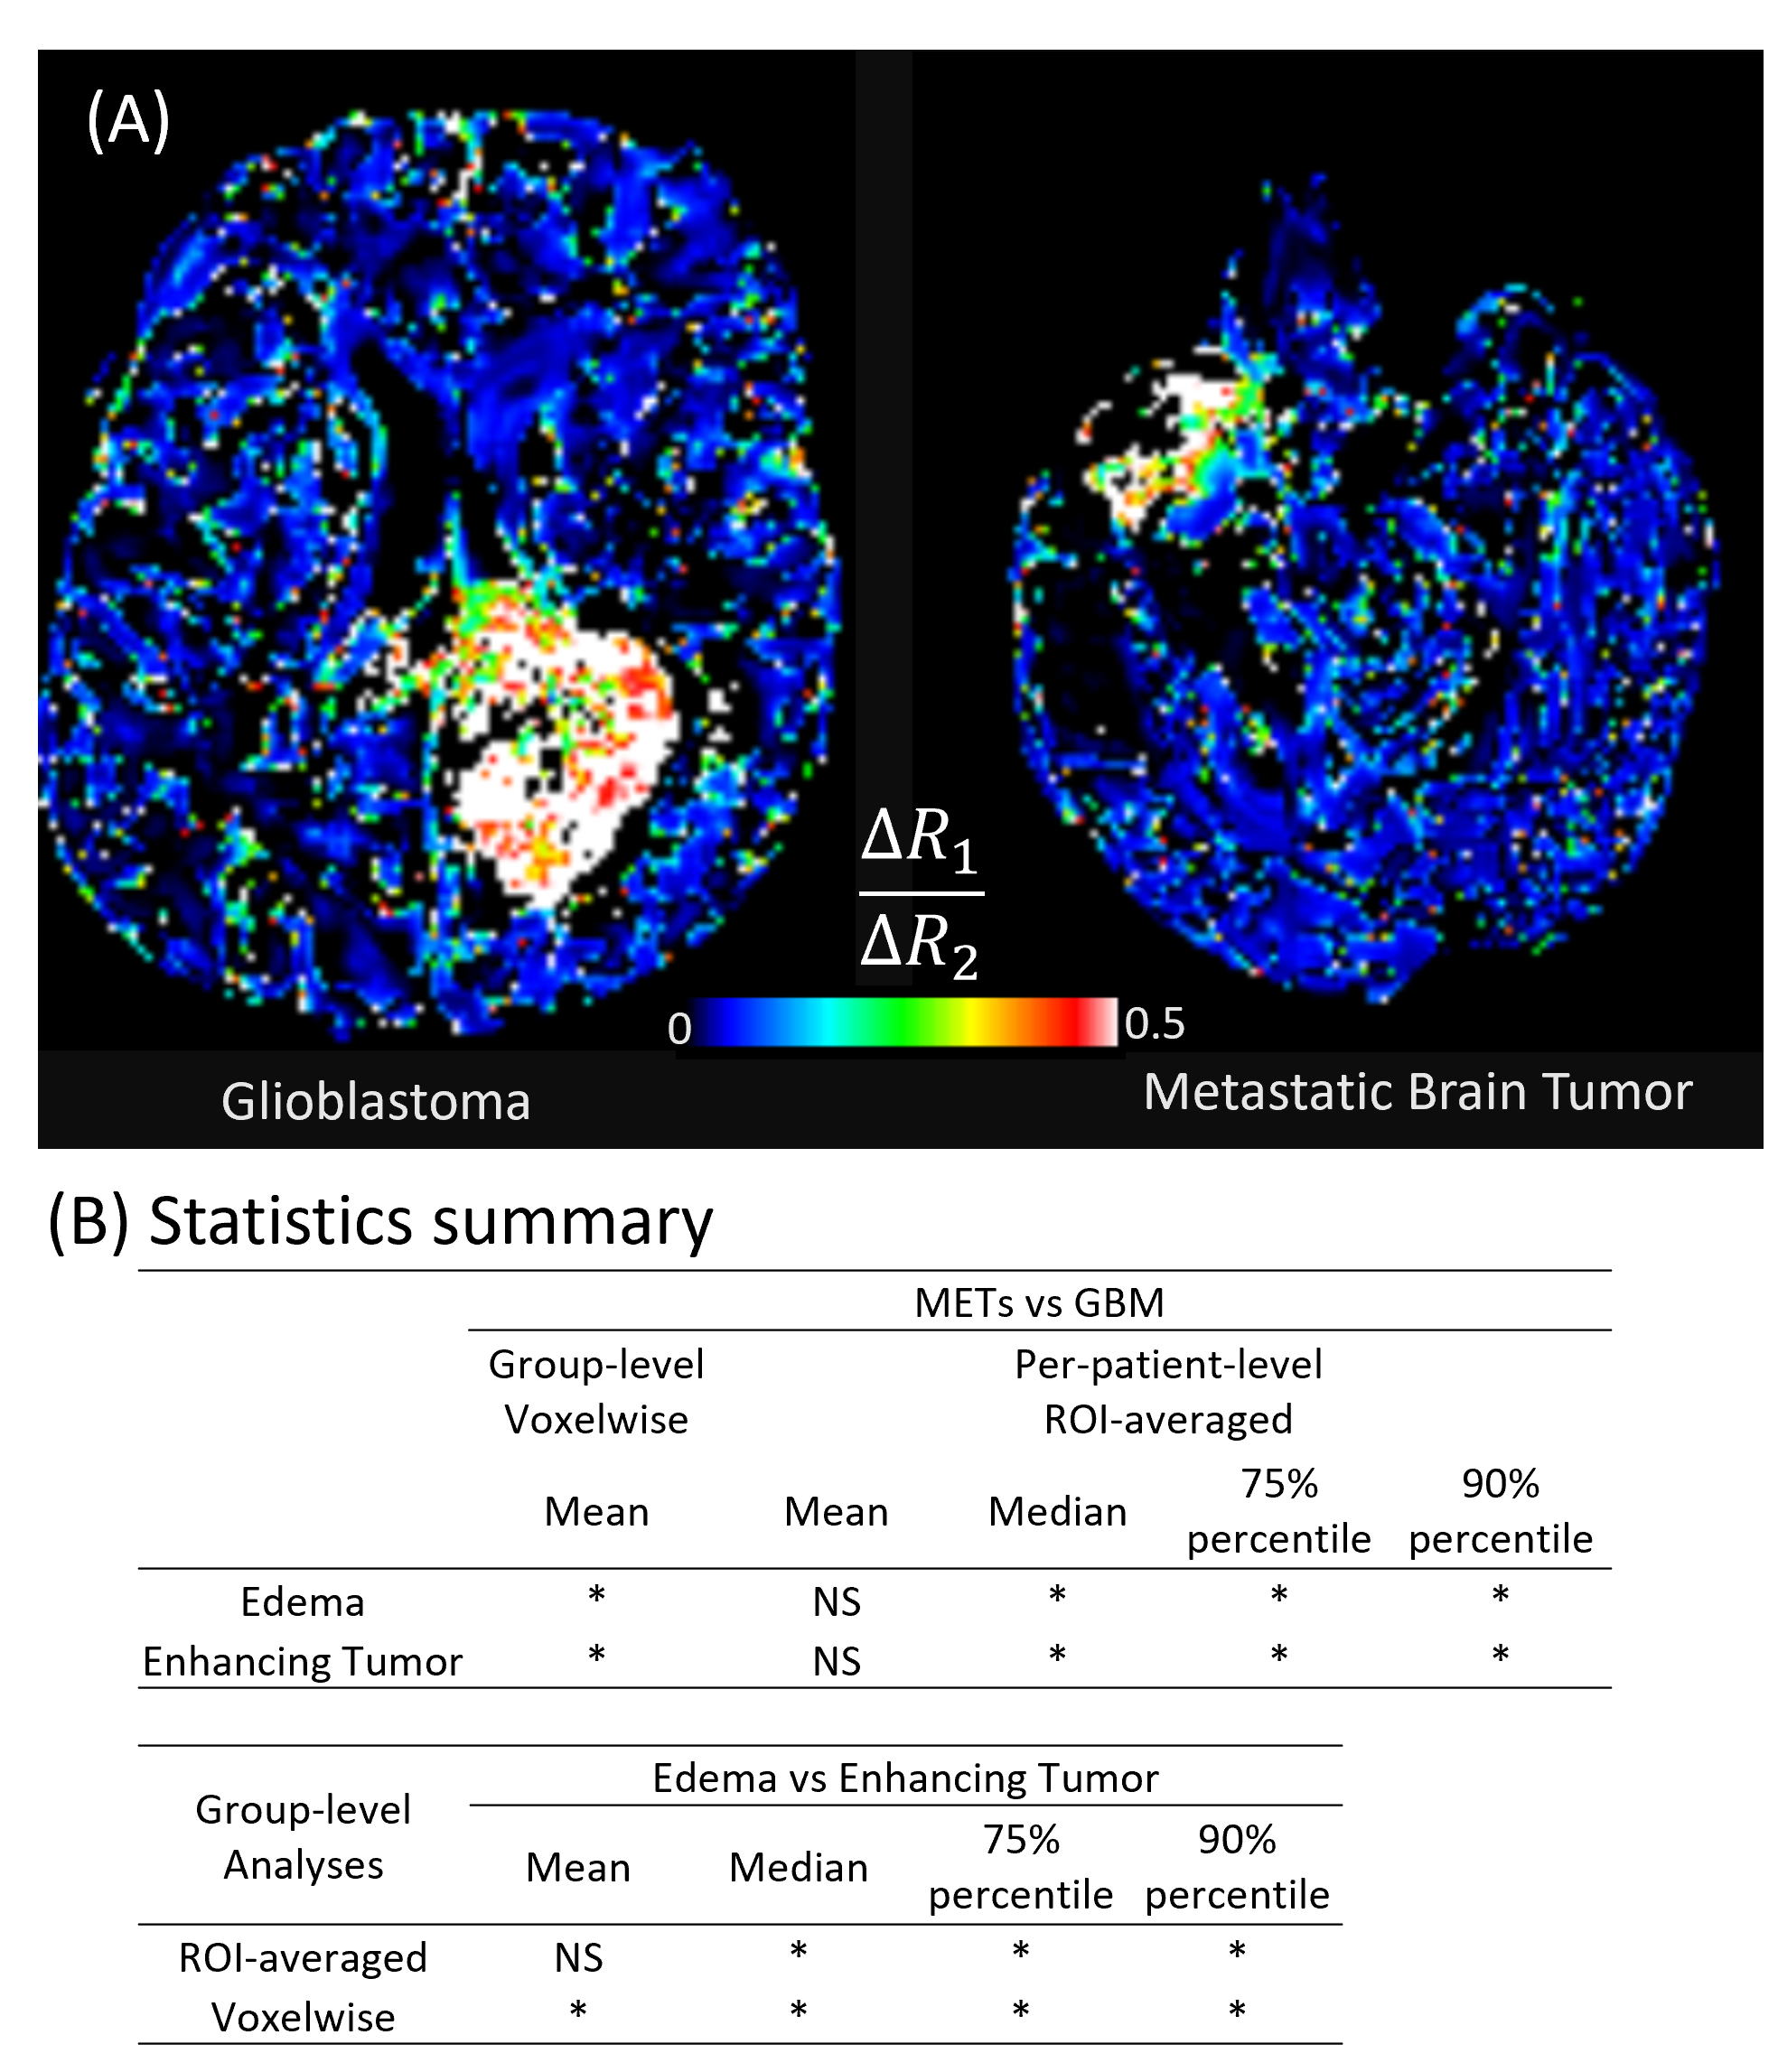
For patient data, ΔR1/ΔR2 values were different between the vascular ROI and the enhancing tumor region (Figure 2 arrows), showing tumor contrast distinct from T1w enhancement. ΔR1/ΔR2 images showed unique contrast in enhancing tumor and peritumoral edema regions, compared to T1-weighted enhancement, ADC, relative CBV (from perfusion MRI), and FLAIR images (Figure 2). This pattern was noticed in both GB and METs tumors (Figure 3A). For group-level voxel-wise analyses, ΔR1/ΔR2 ratios between Metastases and Glioblastoma were different (0.272 ±0.61 vs 0.247±0.66 in edema, p = 2.02E-46; 0.278±0.69 vs 0.264±0.67 in enhancing tumor, p=1.56E-18). For per-patient analyses, ΔR1/ΔR2 ratios between GB and METs were also different (Figure 3B, bottom).
DISCUSSION
Delta-relaxometry can quantify contrast-response of tissue, providing complimentary information to clinical images. Phantom experiments verified that the relaxation enhancement response of gadolinium was linear in physiological range. Contrast specific relaxivity ratios (r1/r2) changed with protein concentration, which indicated that observed ΔR1/ΔR2 in vivo could be sensitive to tissue micro-environment such as macromolecule concentration.In brain tumor subjects, ΔR1/ΔR2 showed unique contrast for enhancing tumor and peri-tumoral edema. Additionally, voxel-wise distribution of ΔR1/ΔR2 ratios was different between tumor types in both peritumoral edema and enhancing tumor regions.
CONCLUSION
Delta-relaxometry can offer unique contrast to map contrast-agent specific tissue responses, independent of hemodynamics and contrast agent concentration. ΔR1/ΔR2 can potentially be used as a novel image contrast for improved tissue characterization and tumor classification.Acknowledgements
This project was supported by the Clinical and Translational Science Collaborative (CTSC) of Cleveland which is funded by the National Institutes of Health (NIH), National Center for Advancing Translational Science (NCATS), Clinical and Translational Science Award (CTSA) grant, UL1TR002548. The authors would also like to acknowledge funding from Siemens Healthineers and NIH grants EB026764-01 and NS109439-01.References
1. Østergaard, L., Weisskoff, R. M., Chesler, D. A., Gyldensted, C., & Rosen, B. R. (1996). High resolution measurement of cerebral blood flow using intravascular tracer bolus passages. Part I: Mathematical approach and statistical analysis. Magnetic resonance in medicine, 36(5), 715-725.
2. Aime, S., Fedeli, F., Sanino, A., & Terreno, E. (2006). A R2/R1 ratiometric procedure for a concentration-independent, pH-responsive, Gd (III)-based MRI agent. Journal of the American Chemical Society, 128(35), 11326-11327.
3. Rohrer, M., Bauer, H., Mintorovitch, J., Requardt, M., & Weinmann, H. J. (2005). Comparison of magnetic properties of MRI contrast media solutions at different magnetic field strengths. Investigative radiology, 40(11), 715-724.
4. Goetschi, S., Froehlich, J. M., Chuck, N. C., Curcio, R., Runge, V. M., Andreisek, G., ... & Boss, A. (2014). The protein and contrast agent–specific influence of pathological plasma-protein concentration levels on contrast-enhanced magnetic resonance imaging. Investigative Radiology, 49(9), 608-619.
5. Badve, C., Yu, A., Dastmalchian, S., Rogers, M., Ma, D., Jiang, Y., ... & Gulani, V. (2017). MR fingerprinting of adult brain tumors: initial experience. American Journal of Neuroradiology, 38(3), 492-499.
6. Kickingereder P, Burth S, Wick A, Götz M, Eidel O, Schlemmer HP, Maier-Hein KH, Wick W, Bendszus M, Radbruch A, Bonekamp D. Radiomic profiling of glioblastoma: identifying an imaging predictor of patient survival with improved performance over established clinical and radiologic risk models. Radiology. 2016 Sep;280(3):880-9.
7. Chachuat, A., Molinier, P., Bonnemain, B., Chambon, C., & Gayet, J. L. (1992). Pharmacokinetics and tolerance of Gd-DOTA (DOTAREM) in healthy volunteers and in patients with chronic renal failure. European Radiology, 2(4), 326-329.
8. Lee, M. J., Kim, M. J., Yoon, C. S., Song, S. Y., Park, K., & Kim, W. S. (2011). The T2-shortening effect of gadolinium and the optimal conditions for maximizing the CNR for evaluating the biliary system: a phantom study. Korean journal of radiology, 12(3), 358-364.
Figures