1349
Decoding the phase-cycled bSSFP signal for maximized parameter quantification - T1, T2, proton density and magnetic field inhomogeneity1Department of Diagnostic, Interventional and Pediatric Radiology (DIPR), Inselspital, Bern Universit, Bern, Switzerland, 2Department of Radiology, Lausanne University Hospital (CHUV) and University of Lausanne (UNIL), Lausanne, Switzerland, 3Department of Diagnostic, Interventional and Pediatric Radiology (DIPR), Inselspital, Bern University Hospital, University of Bern, Bern, Switzerland
Synopsis
Keywords: Relaxometry, Data Analysis, phase-cycled bSSFP, T1-quantification, T2-quantification, B0 quantification, proton-density quantification, multi-parameter quantification
A novel analytical method for off-resonance encoded parameter quantification of voxel-wise phase-cycled bSSFP signal profiles was developed. The approach conserves both magnitude and phase information in a complete, linearized, and compact way. A framework for ultra-rapid and simultaneous $$$T_1$$$, $$$T_2$$$, $$$B_0$$$ inhomogeneity and proton density quantification were developed. The approach was validated in simulations, phantom and in vivo knee experiments and compared with gold-standard reference measurements when available. Simulations and experiments validated the proposed method for multi-parameter quantification with high accuracy and precision, providing the first step towards novel analytical quantification possibilities with phase-cycled bSSFP.Introduction
Phase-cycled (PC) balanced steady-state free-precession (bSSFP) acquisitions enable a simultaneous quantification of $$$T_1$$$ and $$$T_2$$$ [1,2]. In prior methods, off-resonance effects were corrected after dismissing valuable parts of the phase information [1,2,3], requiring lengthy iterative processes to retrieve the underlying quantitative information.This study aims to develop an Off-Resonant encoded Analytical parameter quantification using Complex Linearized Equations (ORACLE) from PC-bSSFP signal-profiles. We demonstrate that by using the entirety of encoded information, $$$T_1$$$, $$$T_2$$$, proton-density (PD) and magnetic field inhomogeneity ($$$B_0$$$) quantification of single-compartment systems is possible, and a clear visual separation of tissues by chemical-shift.
Methods
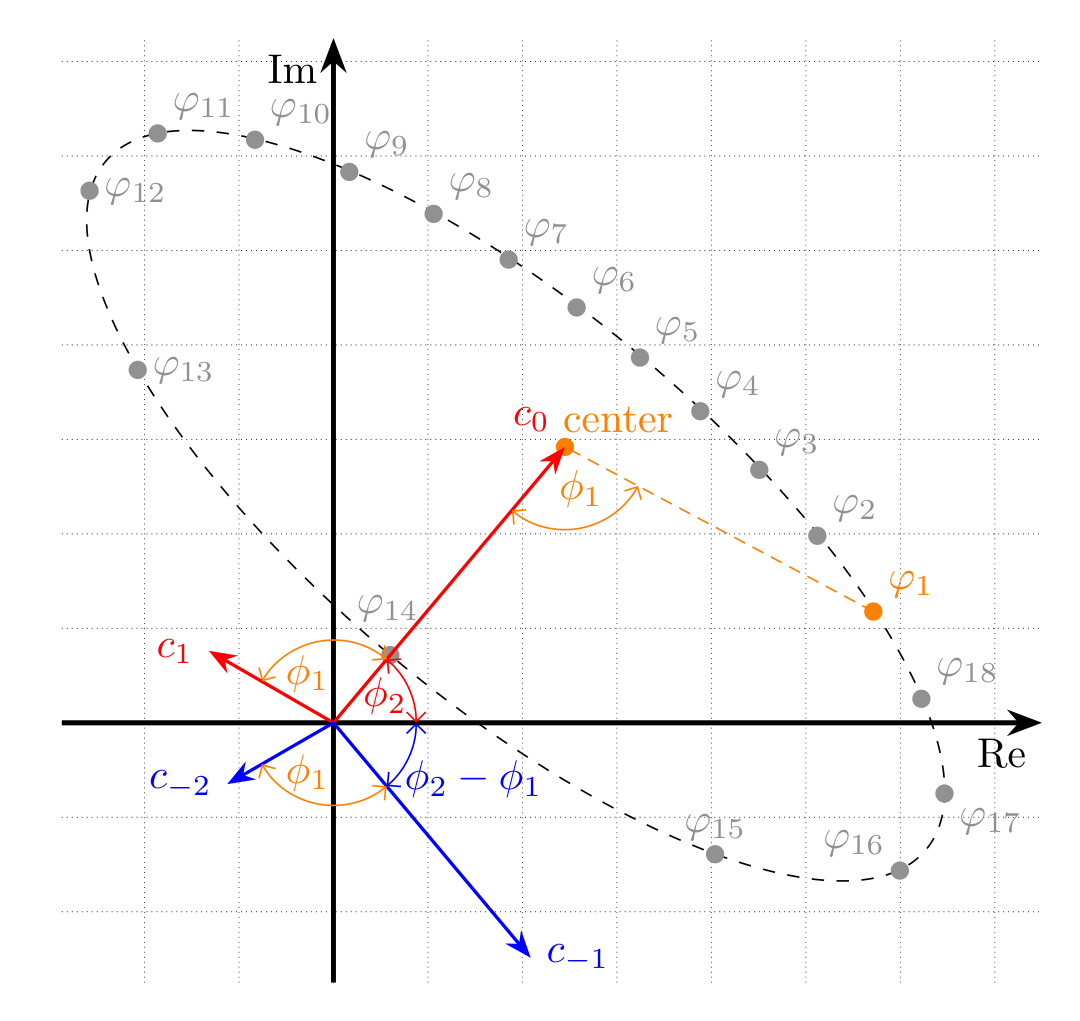
PC-bSSFP Fourier-spacePC-bSSFP equations have been represented in spatial magnetization-space [1,4]. For independent $$$T_1$$$ and $$$T_2$$$ quantification it is required to use complex data i.e., independent $$$M_x$$$ and $$$M_y$$$ information. Since the signal-evolution along the PC-dimension is exhibiting $$$\text{mod}(2\pi)$$$-ambiguities and non-linear dynamics due to off-resonance effects, information is challenging to extract. This problem is simplified by transforming the signal $$$S(\varphi)$$$ into Fourier-space [2,3]:
$$c_n=\sum_{j=0}^{N-1}S(\varphi_j)\cdot \text{e}^{\text{i}\,n\,\varphi_j}\, , \quad \varphi_j = \frac{2\,\pi}{N}\cdot j\,,\quad j =[0,N-1]\; ,$$
where $$$N$$$ is the number of phase-cycles, $$$c_n$$$ the $$$\text{n}^\text{th}$$$-mode, and $$$\varphi$$$ the RF-pulse phase-cycle increment. Discrete Fourier-transformation has three mathematical advantages: First, it generates a new complex space that provides a phase-quantification without $$$\text{mod}(2\pi)$$$-ambiguity. Second, it handles off-resonance effects as constant linear phase-factors, linearizing the problem. Finally, it compresses almost all information in the center of the Fourier-mode-space, summarizing the entire system in three modes $$$c_{-1}$$$, $$$c_0$$$ and $$$c_1$$$ similar to the relation between k-space and image-space (Figure 1). These three central modes form the basis of our proposed approach and are an irreducible and complete representation of the system, comprising $$$T_1$$$, $$$T_2$$$, PD and $$$B_0$$$-inhomogeneity.
Simulations and Experiments
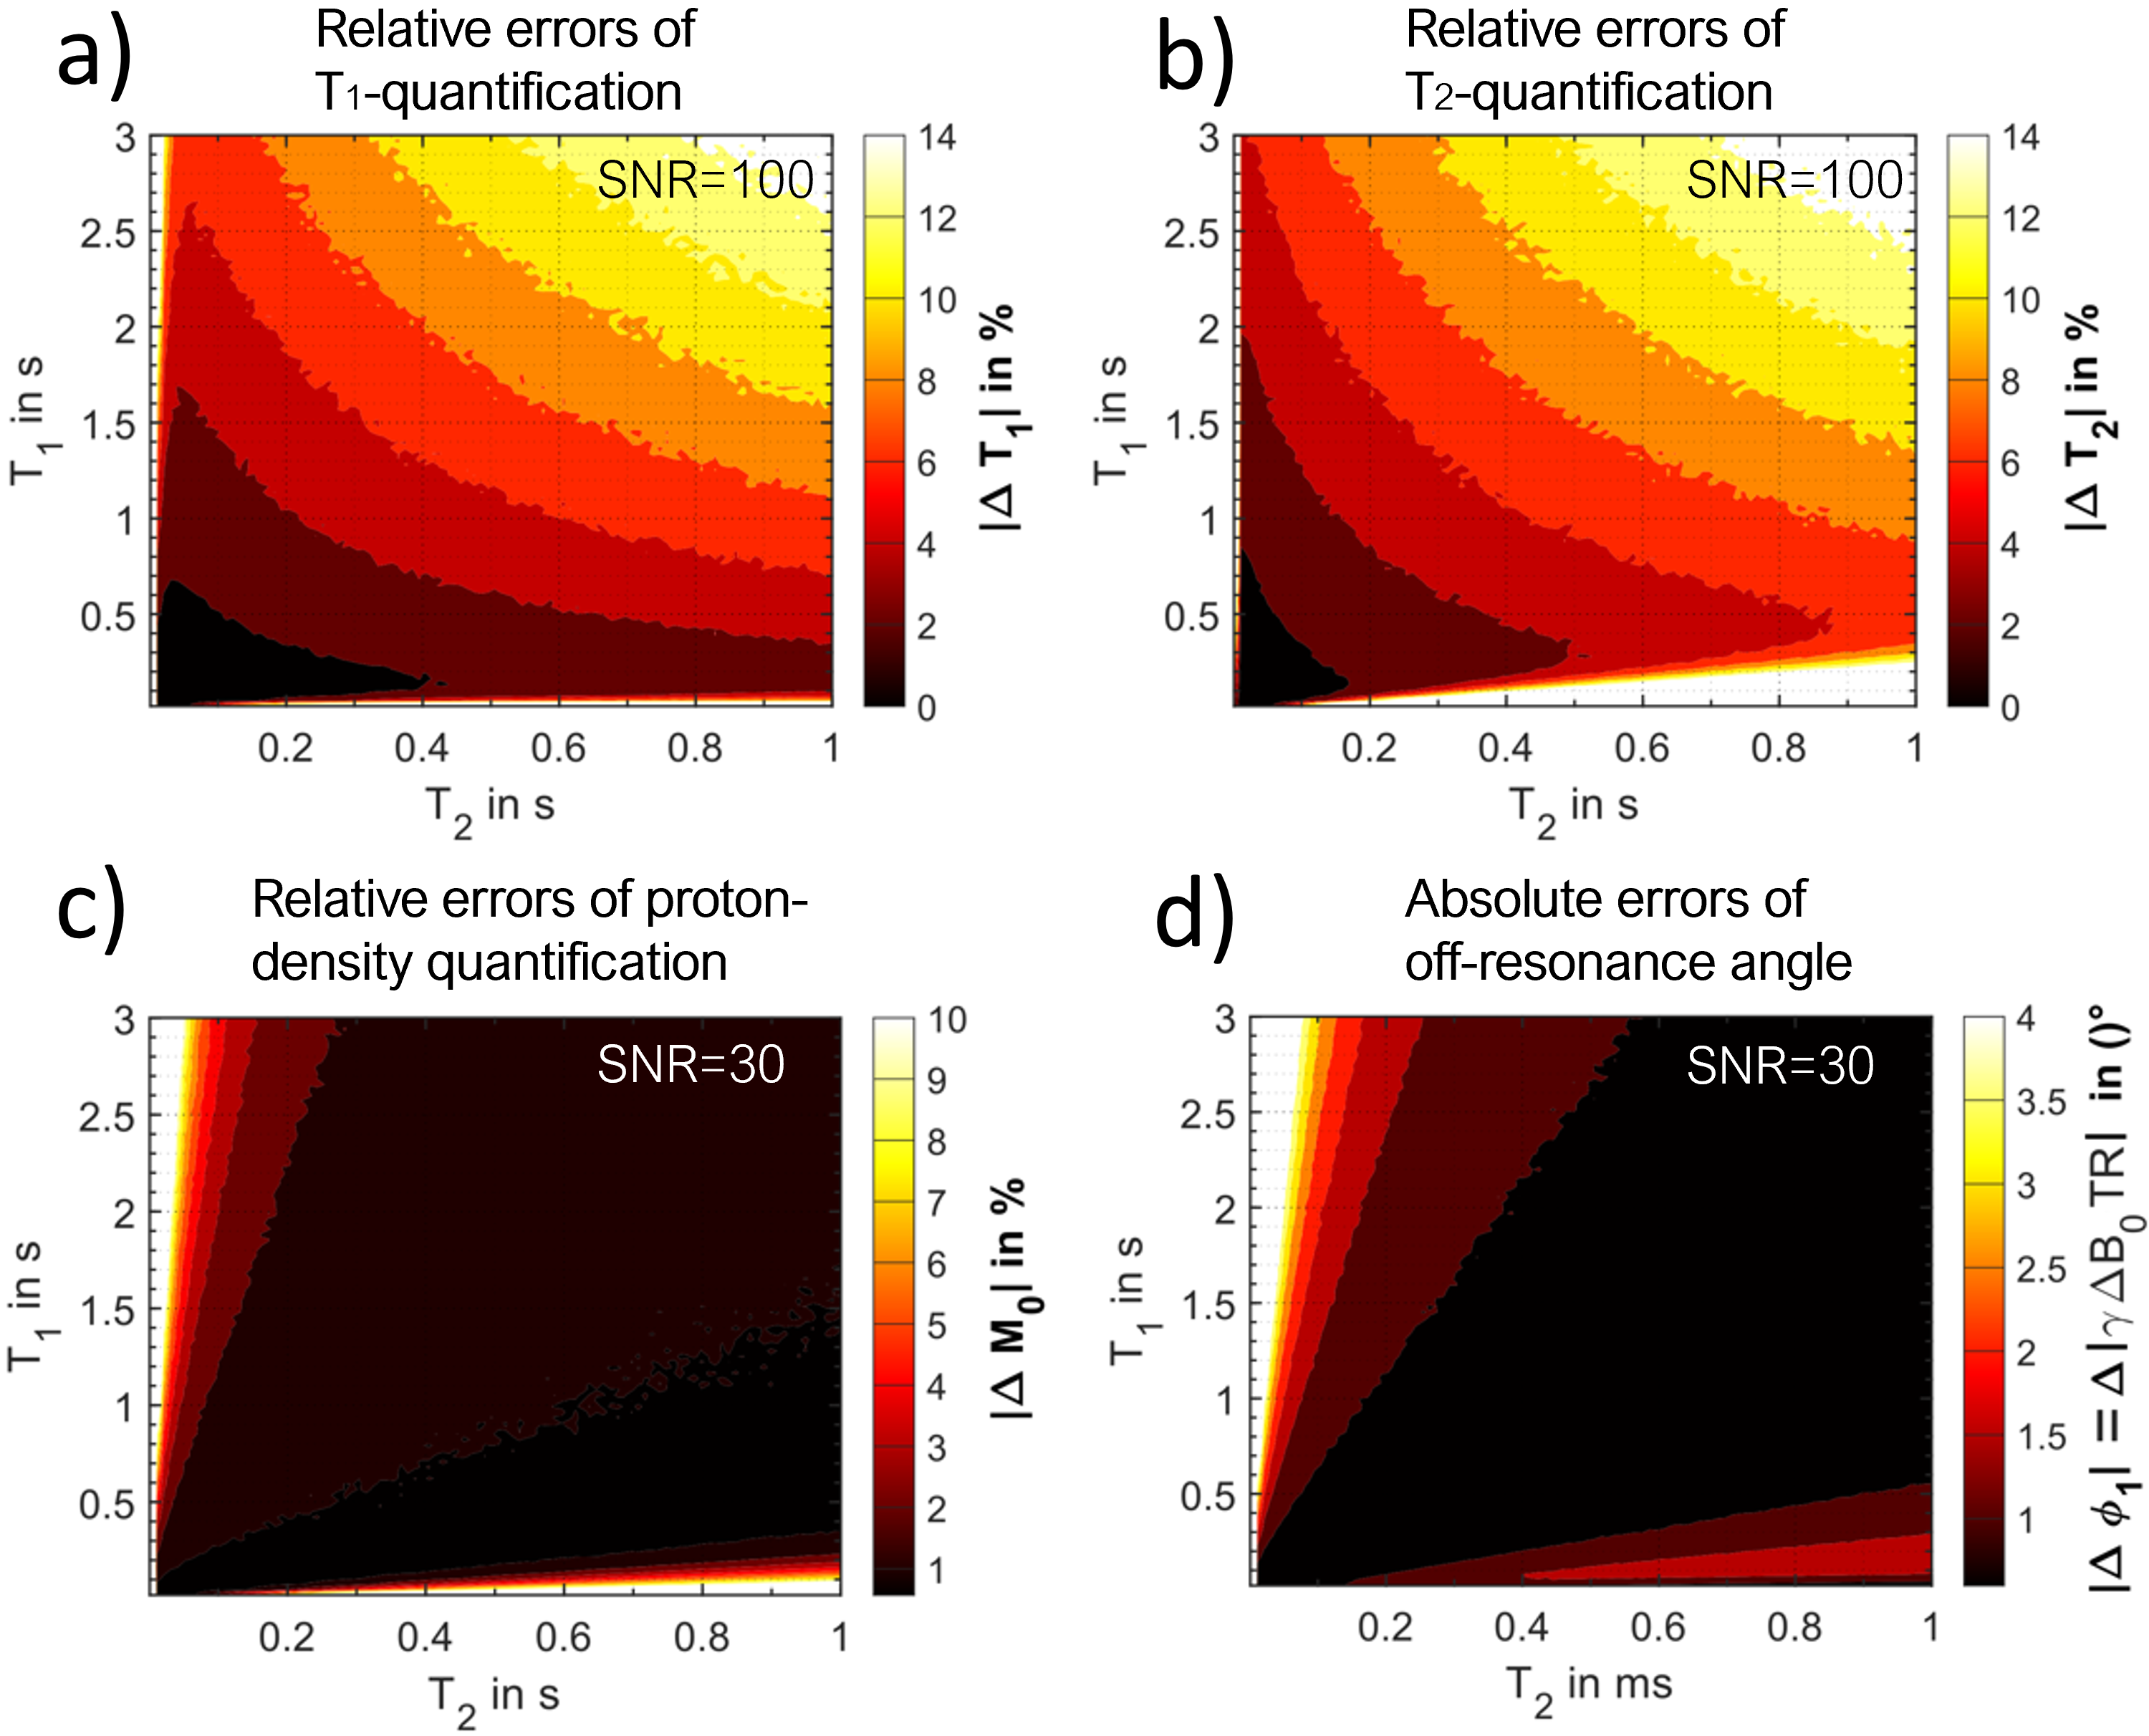
Simulations: The accuracy and precision of multi-parameter quantification is dependent on ($$$T_1$$$,$$$T_2$$$)-value-pairs and SNR. To investigate the quantification-error of $$$T_1$$$, $$$T_2$$$, $$$\Delta B_0$$$ and PD values, Monte-Carlo-simulations of the Bloch-equations for PC-bSSFP (5000 for each ($$$T_1$$$,$$$T_2$$$)-value-pair) with an SNR of 100 for $$$T_1$$$ and $$$T_2$$$ and 30 for $$$\Delta B_0$$$ and PD quantification were performed, while varying $$$T_1$$$ and $$$T_2$$$. The latter SNR was chosen, to demonstrate the high robustness of parameter quantification with ORACLE. $$$N=18$$$, $$$\alpha=15^\circ$$$, and $$$\text{TR}=5\,\text{ms}$$$ were used to be sensitive to biological plausible $$$T_1<1500\,\text{ms}$$$ and $$$T_2<400\,\text{ms}$$$ values. Next, the obtained profiles were processed with ORACLE and the root-mean-square-error of $$$T_1$$$, $$$T_2$$$, $$$\Delta B_0$$$ and PD was determined and plotted as function of $$$T_1$$$ and $$$T_2$$$.
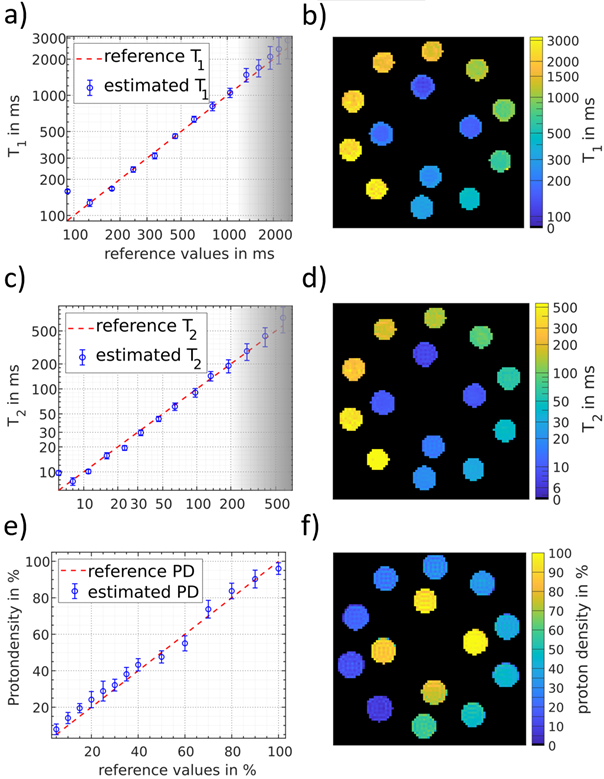
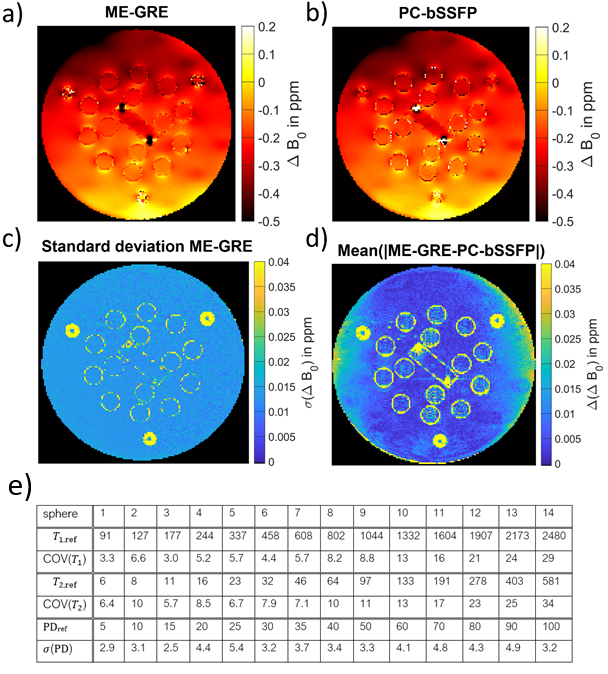
Phantom-experiments: 3 separate PC-bSSFP experiments on a standardized NIST-phantom [5] were performed at 3T (PRISMA, Siemens Healthineers). Scan parameters were equal to simulation parameters, with FOV of (223x223x202)mm with (1.4mm)3 isotropic resolution and BW=975kHz. To obtain a reference for $$$\Delta B_0$$$-mapping and to check for B0-drift, multi-echo-gradient-echo (ME-GRE) acquisitions were performed before each PC-bSSFP-acquisition and after the last PC-bSSFP-acquisition, resulting in four ME-GRE scans in total. For $$$B_1$$$-correction GRE-acquisitions were performed using the double-flip-angle-method [6]. For accuracy the coefficient-of-determination ($$$R^2$$$) w.r.t. the reference [5], for precision the coefficient-of-variation (COV) or the standard-deviation ($$$\sigma$$$) was calculated.
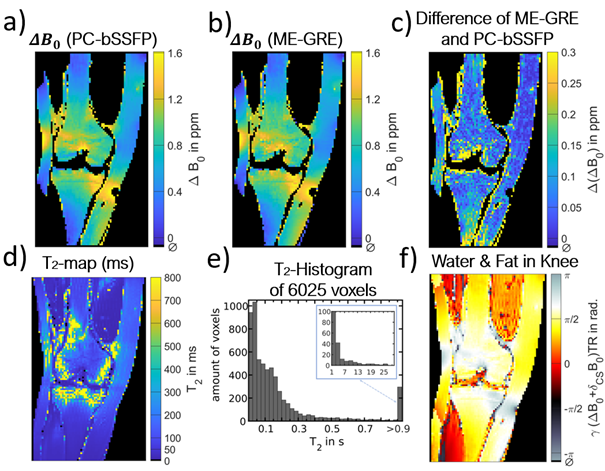
In-vivo-imaging: Knee data of a volunteer was acquired with ME-GRE and PC-bSSFP as described before [7]. Off-resonance ($$$\Delta B_0$$$ and chemical-shift) and $$$T_2$$$-quantification was performed using ORACLE and evaluated. ME-GRE and PC-bSSFP $$$\Delta B_0$$$-maps were masked for muscle-tissue to get a better comparison.
Results and Discussion
Simulations verified the high accuracy of multi-parameter quantification using ORACLE with errors below 5% for biological $$$T_1$$$ and $$$T_2$$$ (Figure 2a,b). PD and $$$\Delta B_0$$$ quantification exhibits high robustness against noise (Figure 2c,d). Parameter quantification was performed on a simple computer(2.80GHz, 32GB) for 106 voxels within a second, compared with current methods that require over 2 min[8]. Experimentally estimated $$$T_1$$$ and $$$T_2$$$ values as well as PD-quantification agreed well with reference-values from the NIST-phantom with $$$R^2=[0.986, 0.993]$$$ and $$$R^2=0.986$$$, respectively (Figure 3). The COVs of $$$T_1$$$ and $$$T_2$$$ for the chosen sensitivity-range were below 10% (Figure 4e). $$$\sigma$$$ of the PD-estimation was below 5%. The $$$\Delta B_0$$$-maps extracted from PC-bSSFP compared well with neighboring $$$\Delta B_0$$$-maps obtained with ME-GRE (Figure 4). $$$\sigma$$$ of $$$\Delta B_0$$$-maps of four ME-GRE experiments performed over a 3-hour period was globally higher than the three averaged differences between neighboring ME-GRE and PC-bSSFP $$$\Delta B_0$$$-maps. Thus, $$$\Delta B_0$$$-quantification with PC-bSSFP exhibited high precision and accuracy, equivalent to ME-GRE $$$\Delta B_0$$$-quantification, whose difference was notably below $$$B_0$$$-drift-effects.The knee $$$\Delta B_0$$$-maps obtained with ME-GRE and PC-bSSFP were in good agreement with an average error of 0.085ppm, which is in a plausible range for $$$\Delta B_0$$$-drift, susceptibility and motion (Figure 5abc). $$$\Delta B_0$$$-values of the knee were in a reasonable range of 30-250ms (Figure 5de). Outliers are attributed to the single-compartment assumption of ORACLE, which overestimates $$$T_2$$$ in the presence of other chemical species within the voxel [9]. Chemical-shift-effects allowed a visual separation between muscle and subcutaneous fat/bone-marrow with PC-bSSFP (Figure 5f). Off-resonance quantifications and chemical-shift-effects were completely decoupled from $$$T_2$$$-quantifications, making off-resonance-corrections expendable.
Conclusion
ORACLE was developed for ultra-rapid, and simultaneous $$$T_1$$$, $$$T_2$$$, $$$\Delta B_0$$$ and PD quantification. $$$T_1$$$, $$$T_2$$$, $$$\Delta B_0$$$ and PD could be quantified with high accuracy and precision. ORACLE compactifies all information content of experimental data, enabling the first PC-bSSFP signal-analysis-framework for multi-parameter quantification, while making off-resonance corrections redundant.Acknowledgements
This study was supported by the Swiss National Science Foundation (grant number PCEFP2_194296).References
[1] Shcherbakova Y, van den Berg CAT, Moonen CTW, Bartels LW. PLANET: An ellipse fitting approach for simultaneous T1 and T2 mapping using phase-cycled balanced steady-state free precession. Magn Reson Med. 2018 Feb;79(2):711-722. doi: 10.1002/mrm.26717. Epub 2017 May 22. PMID: 28543430; PMCID: PMC5811804.
[2] Nguyen D, Bieri O. Motion-insensitive rapid configuration relaxometry. Magn Reson Med. 2017 Aug;78(2):518-526. doi: 10.1002/mrm.26384. Epub 2016 Sep 8. PMID: 27605508.
[3] Heule R, Ganter C, Bieri O. Triple echo steady-state (TESS) relaxometry. Magn Reson Med. 2014 Jan;71(1):230-7. doi: 10.1002/mrm.24659. Epub 2013 Apr 2. PMID: 23553949.
[4] Ganter C. Steady state of gradient echo sequences with radiofrequency phase cycling: analytical solution, contrast enhancement with partial spoiling. Magn Reson Med. 2006 Jan;55(1):98-107. doi: 10.1002/mrm.20736. PMID: 16342263.
[5] NIST NIST-Phantom: ISMRM Singapore Proceedings, program number 3290
[6] Cunningham CH, Pauly JM, Nayak KS. Saturated double-angle method for rapid B1+ mapping. Magn Reson Med. 2006 Jun;55(6):1326-33. doi: 10.1002/mrm.20896. PMID: 16683260.
[7] Rossi G et. al. Fat fraction mapping using bSSFP Signal Profile Asymmetries for Robust multi-Compartment Quantification (SPARCQ). Joint Annual Meeting ISMRM & SMRT, 8-14 August 2020, Virtual conference
[8] Shcherbakova Y et. al. On the accuracy and precision of PLANET for multiparametric MRI using phase-cycled bSSFP imaging. Magn Reson Med. 2019 Mar;81(3):1534-1552. doi: 10.1002/mrm.27491. Epub 2018 Oct 10. PMID: 30303562; PMCID: PMC6585657
[9] Rossi G et. al. arXiv:2005.09734 [physics.med-ph]
Figures