1344
Optimisation of an MRI protocol to assess the effects of noise exposure on the auditory pathway1Sir Peter Mansfield Imaging Centre, School of Physics and Astronomy, University of Nottingham, Nottingham, United Kingdom, 2National Institute for Health and Care Research (NIHR) Nottingham Biomedical Research Centre, Nottingham, United Kingdom, 3Hearing Sciences, Division of Mental Health and Clinical Neurosciences, School of Medicine, University of Nottingham, Nottingham, United Kingdom, 4Manchester Centre for Audiology and Deafness (ManCAD), University of Manchester, Manchester, United Kingdom, 5National Institute for Health and Care Research (NIHR) Manchester Biomedical Research Centre, Central Manchester University Hospitals NHS Foundation Trust, Manchester, United Kingdom, 6Department of Psychology, Lancaster University, Lancaster, United Kingdom
Synopsis
Keywords: Head & Neck/ENT, Nerves, Neurography, diffusion, DTI
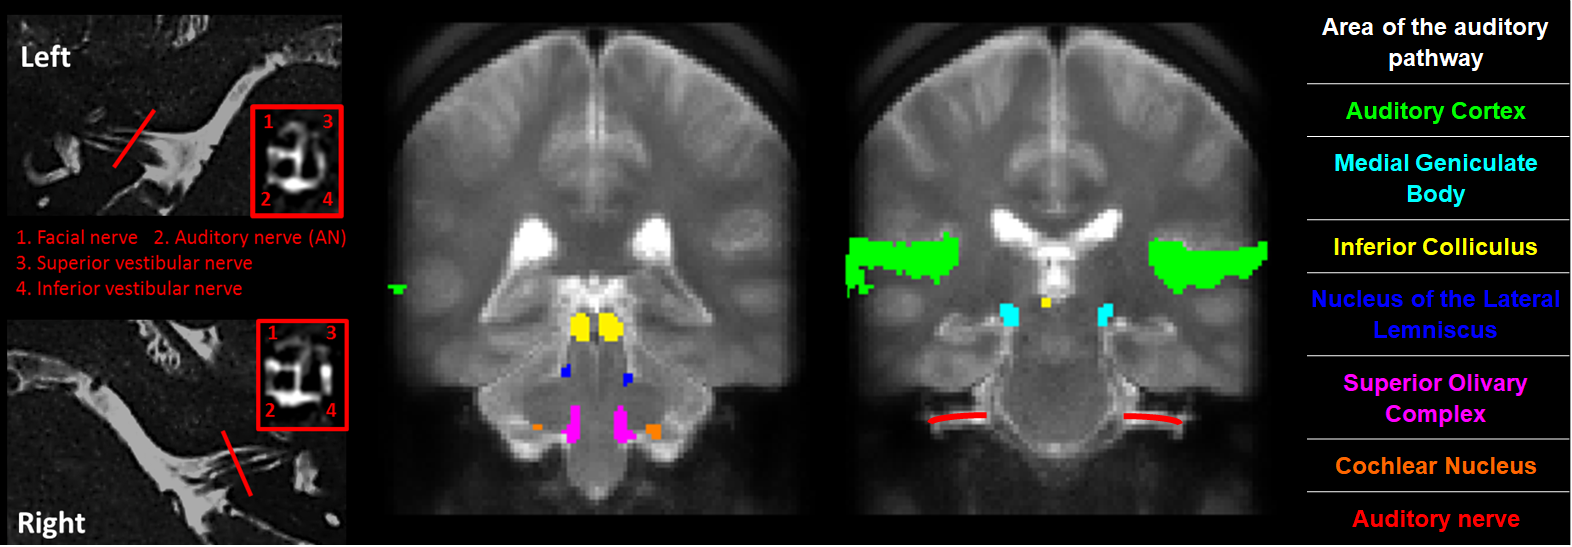
Recent findings suggest that noise exposure can cause substantial damage to the auditory nerve, without damage to the sensory hair cells or loss of threshold sensitivity. It is unclear which physiological measures are most sensitive to neural damage. Here, a comprehensive MRI protocol (neurography, high-resolution DTI of the auditory nerve and brain, morphometry, T1-myelination mapping, and resting-state functional connectivity) to study the ascending auditory pathway (auditory nerve, auditory brainstem, and cortex) is described. 200 participants will be recruited with varying noise exposure levels, with the aim of identifying diagnostic tests indicative of future hearing loss.Introduction
Noise exposure is the main cause of preventable hearing loss worldwide and is typically diagnosed using pure-tone audiometry. However, animal studies suggest that noise exposure can cause substantial damage to the auditory nerve without noticeable hair-cell damage or audiometric threshold elevation. Such noise-induced damage may exacerbate the effects of aging1,2. One in 7 adults aged 17-30 report "great difficulty" hearing speech in noisy backgrounds, while only 1 in 50 have impaired audiometric sensitivity3. There is a need to determine the extent of noise-induced neural damage in the peripheral (auditory nerve) and central (auditory brainstem and auditory cortex) auditory system. Here we optimise an MRI protocol and outline its use in an ongoing study of noise exposure to (1) determine the relative contributions of age and noise exposure to neural damage, and (2) investigate the degree of association between the anatomical measures of the auditory nerve (as provided using structural MRI) and electrophysiological measures of auditory nerve function.Method
Participants: The study aims to recruit 200 healthy participants into four groups (each n=50): Group 1: 18-19yrs, low noise exposure, normal hearing; Group 2: 30-50yrs; low noise exposure, normal hearing; Group 3: 30-50yrs, high noise exposure, normal hearing; Group 4 30-50yrs, high noise exposure, suspected noise-induced hearing loss. Recruitment opened in May 2022 and is expected to close in April 2025.Audiometry: Participants will undergo pure-tone audiometry (0.5 to 8 kHz) and the Noise Exposure Structured Interview4 to determine eligibility for one of the above groups. Upon allocation to a group, participants will undergo testing for extended high-frequency audiometry, distortion product otoacoustic emissions, middle ear muscle reflex, and the electrophysiological auditory brainstem response.
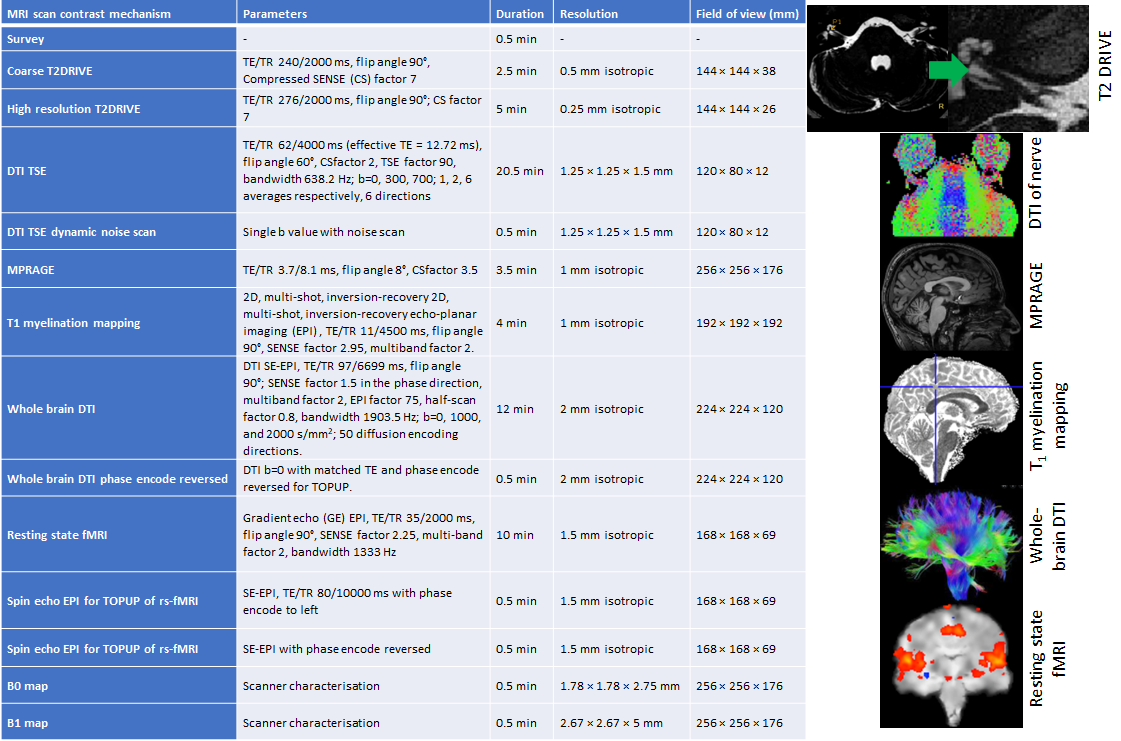
MRI protocol development: The MRI protocol has been developed and optimised on a Philips 3.0 T Ingenia MR scanner (Philips Healthcare, Best, Netherlands) using a 32-element SENSE head coil to study the structural and functional properties of the ascending auditory pathway (Figure 1). High-resolution T2-DRIVE and DTI data acquisition methods were optimised to characterise the structural integrity of the auditory nerve. The T2-DRIVE was planned from a coarse-resolution T2-DRIVE and assessed at a range of compressed sense factors to provide a high-resolution measure of nerve cross-sectional area in a shortened scan time. High-resolution DTI schemes with TSE and IRIS-Zoom EPI readout (covering a small field-of-view in the foot-head direction) were compared to measure the fractional anisotropy and apparent diffusion coefficient of the auditory nerve. A dynamic noise scan was added to the DTI acquisition to perform NORDIC (Noise Reduction with Distributed Corrected) PCA denoising6 to improve the signal-to-noise ratio of the DTI measures. The geometry of the DTI acquisition was matched to that of the high-resolution T2-DRIVE for overlaying onto the auditory nerve measures. To assess structural connectivity, a whole-brain DTI based on the UK Biobank7 protocol is included. An MPRAGE provides morphometric measures, along with a whole-brain high-resolution 2D, multi-shot, inversion-recovery EPI T1 mapping scheme8 to assess myelination. A high-resolution resting-state scan will be used to measure functional connectivity within the auditory network. T1-myelination mapping, morphometric (volumes, thicknesses, curvatures), and structural and functional connectivity will be quantified in peripheral, subcortical, and cortical regions of interest and compared to audiometric measures.
Results
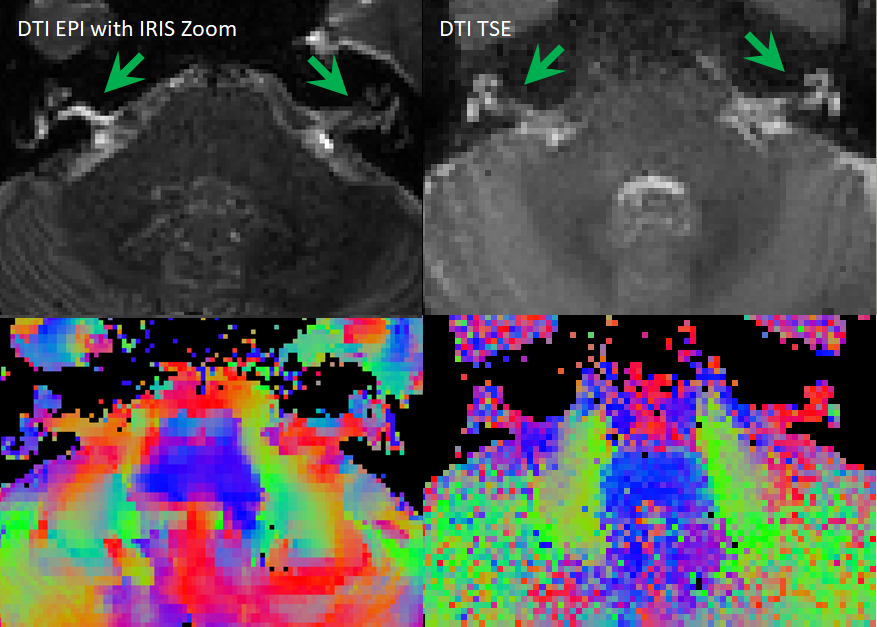
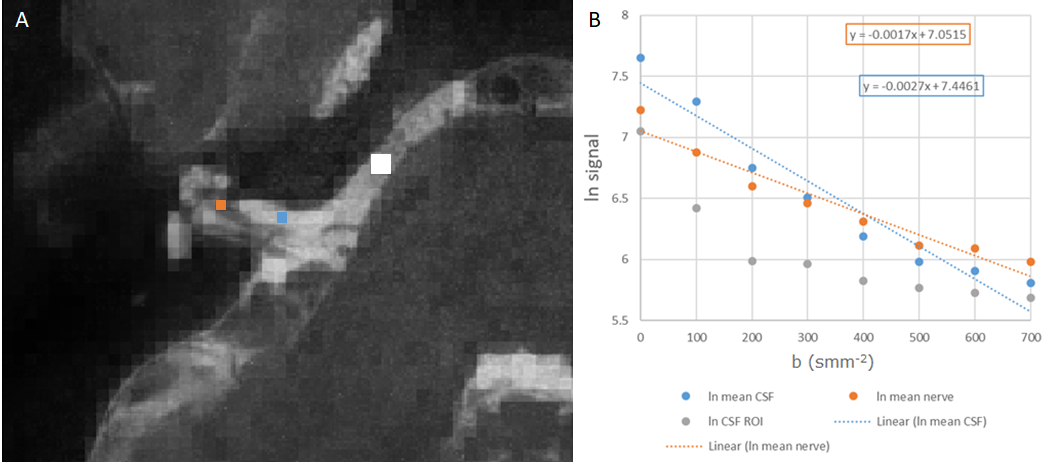
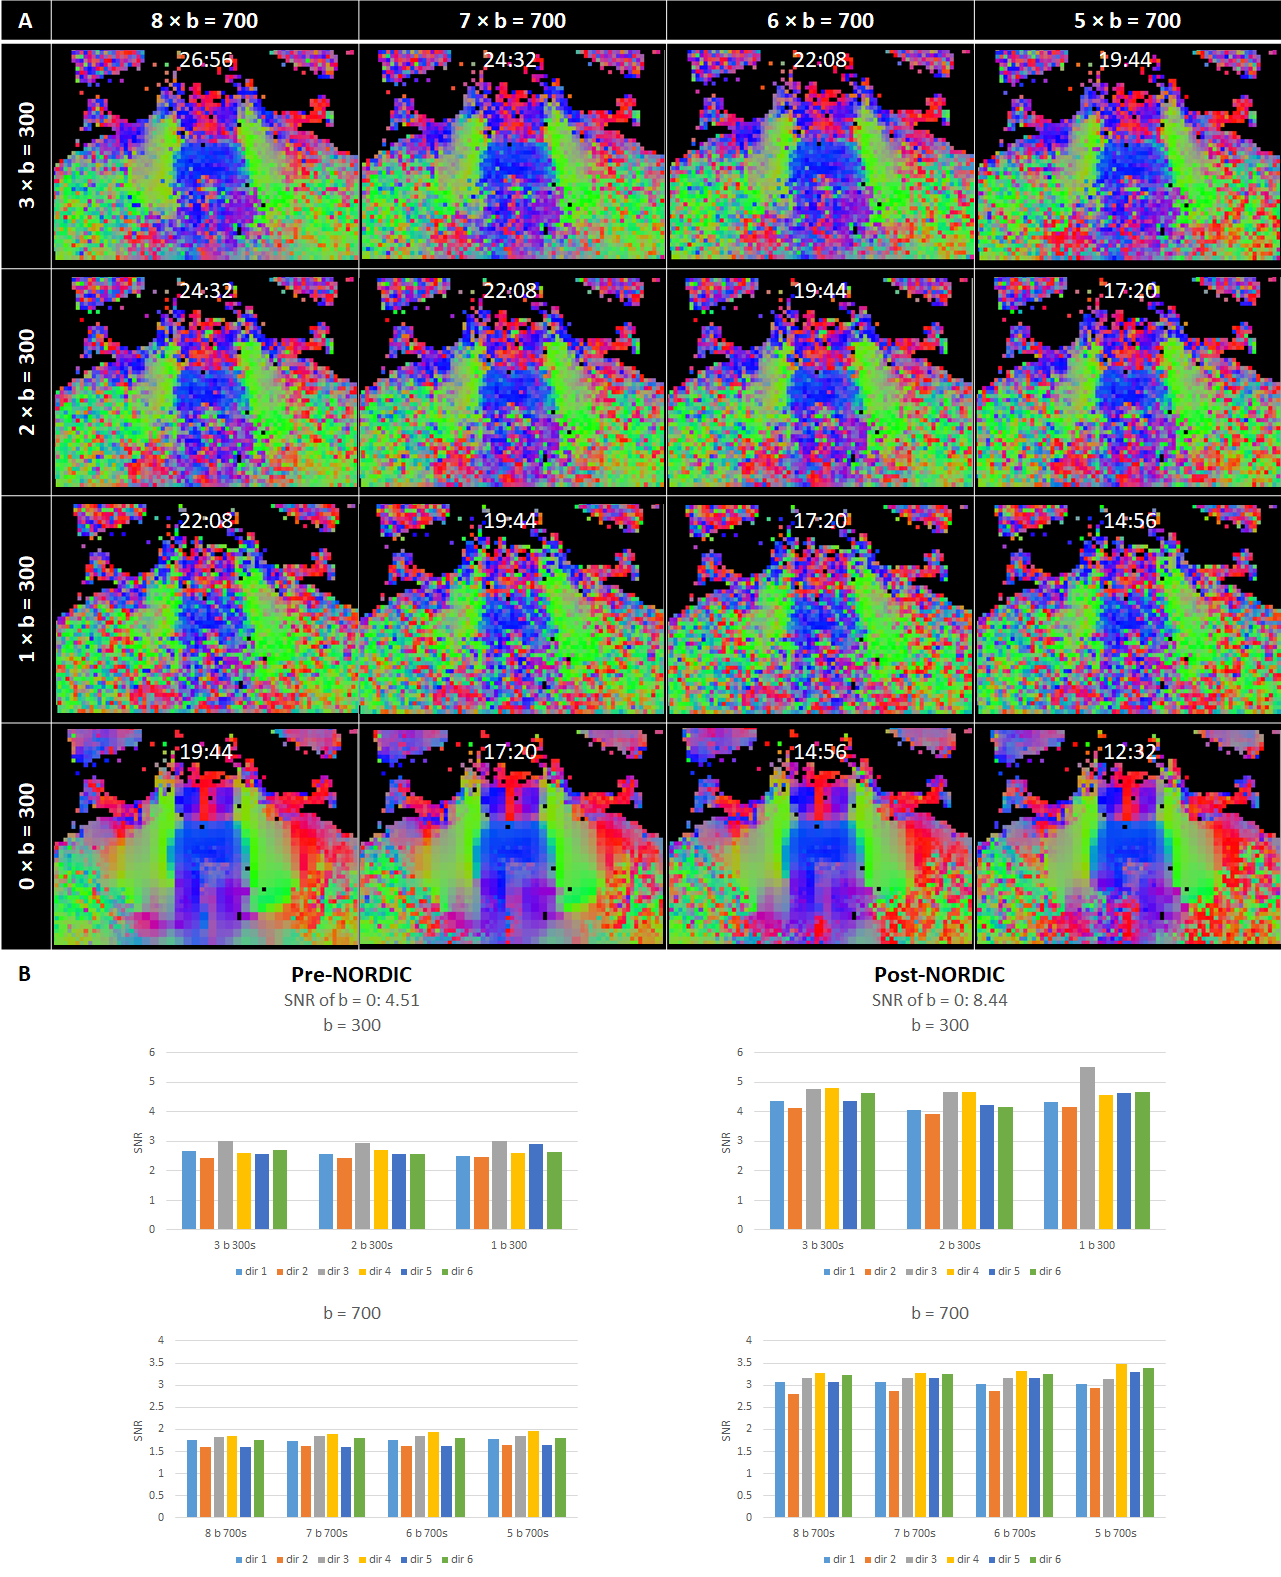
Optimisation resulted in a comprehensive 1-hour MRI protocol to study the auditory pathway, as outlined in Figure 2 along with exemplar images. Figure 3 compares the DTI TSE and IRIS-Zoom EPI readouts to image the auditory nerve. Since the TSE readout circumvents EPI distortions and allows diffusion metrics to be overlaid on T2-DRIVE images, this scheme was chosen. The DTI TSE was further optimised for choice of b-values by first assessing the signal across a range of b = 0 to 700 smm-2, in 100-smm-2 steps, on the basis that b=700 smm-2 has been used for imaging peripheral nerves9. Figure 4 shows the signal measured in the auditory nerve, CSF immediately adjacent to the nerve, and a region composed entirely of CSF. A b of 300 smm-2 provided the optimum difference in signal between the region composed entirely of CSF and the auditory nerve canal while still providing near-even spacing of b-values across the range (Figure 4B). DTI data were then collected systematically at b-values of both 300 smm-2 and at 700 smm-2, with the number of repeated averages of each b-value optimised for subsequent fitting using DTIFIT (FSL10). Figure 5 shows a visual comparison of the principal diffusion direction when systematically reducing the number of repeated averages of the b=300 smm-2 and b=700 smm-2 images. An optimal combination of two b=300 smm-2 and six b=700 smm-2 repeated averages was selected (Figure 5A). For this scheme, image SNR was significantly (p<0.0001) improved by using NORDIC (Figure 5B).Conclusion
This work presents an optimised MRI protocol to study the auditory pathway from the auditory nerve through to the brainstem and central auditory brain. A future aim is to determine if MRI measures will facilitate the identification of individuals at risk of neural damage resulting from noise exposure. A diagnostic test of this neural damage could then be used to provide personalised healthcare advice, regarding, for example, reducing further noise exposure, and could provide evidence for noise exposure regulations and policy.Acknowledgements
This work was funded by Medical Research Council Grant (MR/V01272X/1) and supported by the National Institute for Health Research (NIHR) Manchester and Nottingham Biomedical Research Centres.References
1. Gates, GA, et al. Longitudinal threshold changes in older men with audiometric notches. Hear Res, 2000. 141(1-2): p. 220-8.
2. Kujawa SG, Liberman MC. Adding insult to injury: cochlear nerve degeneration after "temporary" noise-induced hearing loss. J Neurosci. 2009 Nov 11;29(45):14077-85. doi: 10.1523/JNEUROSCI.2845-09.2009.
3. Gopinath B, et al. Association between age-related hearing loss and stroke in an older population. Stroke, 2009. 40(4): p. 1496-8.
4. Guest H, et al. The Noise Exposure Structured Interview (NESI): An Instrument for the Comprehensive Estimation of Lifetime Noise Exposure. Trends Hear. 2018 Jan-Dec;22:2331216518803213.
5. Dewey RS, et al. The association between subcortical and cortical fMRI and lifetime noise exposure in listeners with normal hearing thresholds. Neuroimage, 2020. 204: p. 116239.
6. Moeller S, et al. NOise reduction with DIstribution Corrected (NORDIC) PCA in dMRI with complex-valued parameter-free locally low-rank processing. Neuroimage, 2021. 226: p. 117539.
7. https://www.ukbiobank.ac.uk/
8. Sanchez Panchuelo RM, et al. Quantitative T1 mapping using multi-slice multi-shot inversion recovery EPI. Neuroimage, 2021. 234: p. 117976.
9. Foesleitner O, et al. Diffusion MRI in Peripheral Nerves: Optimized b Values and the Role of Non-Gaussian Diffusion. Radiology, 2022. 302(1): p. 153-161.
10. Sotiropoulos SN, et al. Fusion in diffusion MRI for improved fibre orientation estimation: An application to the 3T and 7T data of the Human Connectome Project. Neuroimage 134:396-409, 2016.
Figures